Estimated zip code population in 2022: 4,256 Zip code population in 2010: 3,977 Zip code population in 2000: 3,687
Houses and condos: 1,846 Renter-occupied apartments: 254
% of renters here:
16%
State:
33%
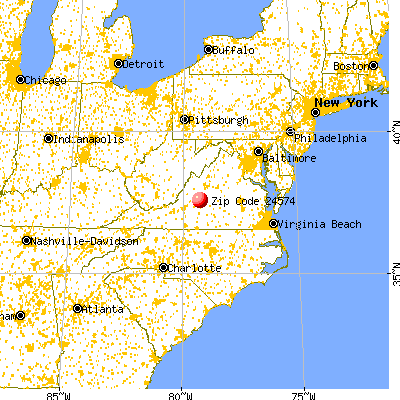
March 2022 cost of living index in zip code 24574: 84.7 (less than average, U.S. average is 100)
Land area: 108.8 sq. mi. Water area: 1.3 sq. mi.
Population density: 39 people per square mile
(very low).
OSM Map
General Map
Google Map
MSN Map
OSM Map
General Map
Google Map
MSN Map
OSM Map
General Map
Google Map
MSN Map
OSM Map
General Map
Google Map
MSN Map
Please wait while loading the map...
Real estate property taxes paid for housing units in 2022:
This zip code:
0.5% ($1,198)
Virginia:
0.7% ($2,617)
Median real estate property taxes paid for housing units with mortgages in 2022: $1,224 (0.5%) Median real estate property taxes paid for housing units with no mortgage in 2022: $1,179 (0.6%)
Business Search- 14 Million verified businesses
Males: 2,039
(47.9%)
Females: 2,217
(52.1%)
For population 25 years and over in 24574:
High school or higher: 91.4%
Bachelor's degree or higher: 26.2%
Graduate or professional degree: 9.2%
Unemployed: 1.2%
Mean travel time to work (commute): 33.7 minutes
For population 15 years and over in 24574:
Never married: 24.3%
Now married: 53.5%
Separated: 3.8%
Widowed: 7.9%
Divorced: 10.5%
Zip code 24574 compared to state average:
Median house value below state average.
Unemployed percentage significantly below state average.
Hispanic race population percentage significantly below state average.
Median age significantly above state average.
Foreign-born population percentage significantly below state average.
Renting percentage below state average.
Length of stay since moving in significantly above state average.
Estimated median house/condo value in 2022: $218,796
24574:
$218,796
Virginia:
$365,700
According to our research of Virginia and other state lists, there were 10 registered sex offenders living in 24574 zip code as of May 28, 2024. The ratio of all residents to sex offenders in zip code 24574 is 427 to 1. The ratio of registered sex offenders to all residents in this zip code is lower than the state average.
Median resident age:
This zip code:
47.2 years
Virginia median age:
39.0 years
Average household size:
This zip code:
2.5 people
Virginia:
2.5 people
Averages for the 2020 tax year for zip code 24574, filed in 2021:
Average Adjusted Gross Income (AGI) in 2020: $61,054 (Individual Income Tax Returns)
Here:
$61,054
State:
$86,446
Salary/wage: $52,157 (reported on 81.9% of returns)
Here:
$52,157
State:
$71,185
(% of AGI for various income ranges: 1103.0% for AGIs below $25k, 3507.5% for AGIs $25k-50k, 6190.0% for AGIs $50k-75k, 9720.0% for AGIs $75k-100k, 14601.1% for AGIs $100k-200k)
Taxable interest for individuals: $1,118 (reported on 28.8% of returns)
This zip code:
$1,118
Virginia:
$1,805
(% of AGI for various income ranges: 10.2% for AGIs below $25k, 17.2% for AGIs $25k-50k, 52.4% for AGIs $50k-75k, 42.1% for AGIs $75k-100k, 114.4% for AGIs $100k-200k)
Ordinary dividends: $7,167 (reported on 16.9% of returns)
Here:
$7,167
State:
$8,327
(% of AGI for various income ranges: 17.2% for AGIs below $25k, 28.9% for AGIs $25k-50k, 157.6% for AGIs $50k-75k, 163.6% for AGIs $75k-100k, 360.6% for AGIs $100k-200k)
Net capital gain/loss in AGI: +$16,696 (reported on 14.1% of returns)
Here:
+$16,696
State:
+$24,644
(% of AGI for various income ranges: 8.6% for AGIs below $25k, 27.5% for AGIs $25k-50k, 132.4% for AGIs $50k-75k, 106.4% for AGIs $75k-100k, 662.2% for AGIs $100k-200k)
Profit/loss from business: +$8,285 (reported on 11.3% of returns)
Here:
+$8,285
State:
+$12,836
(% of AGI for various income ranges: 98.6% for AGIs below $25k, 75.6% for AGIs $25k-50k, 195.9% for AGIs $50k-75k, 239.3% for AGIs $75k-100k, 162.8% for AGIs $100k-200k)
Taxable individual retirement arrangement distribution: $14,874 (reported on 10.7% of returns)
24574:
$14,874
Virginia:
$21,535
(% of AGI for various income ranges: 52.8% for AGIs below $25k, 125.8% for AGIs $25k-50k, 302.9% for AGIs $50k-75k, 380.7% for AGIs $75k-100k, 610.0% for AGIs $100k-200k)
Total itemized deductions: $28,018 (reported on 6.2% of returns)
Here:
$28,018
State:
$33,287
(% of AGI for various income ranges: 715.3% for AGIs $50k-75k, 1036.7% for AGIs $100k-200k)
Charity contributions: $11,025 (reported on 4.5% of returns)
Here:
$11,025
State:
$10,381
(% of AGI for various income ranges: 57.8% for AGIs $25k-50k, 374.4% for AGIs $100k-200k)
Taxes paid: $6,455 (reported on 6.2% of returns)
24574:
$6,455
State:
$8,284
(% of AGI for various income ranges: 121.2% for AGIs $50k-75k, 280.0% for AGIs $100k-200k)
Earned income credit: $2,114 (reported on 16.4% of returns)
Here:
$2,114
State:
$2,214
(% of AGI for various income ranges: 88.4% for AGIs below $25k, 64.7% for AGIs $25k-50k)
Percentage of individuals using paid preparers for their 2020 taxes: 91.0%
Here:
91%
State:
92%
(% for various income ranges: 89.3% for AGIs below $25k, 91.1% for AGIs $25k-50k, 91.7% for AGIs $50k-75k, 95.0% for AGIs $75k-100k, 92.6% for AGIs $100k-200k, 80.0% for AGIs over 200k)
Averages for the 2012 tax year for zip code 24574, filed in 2013:
Average Adjusted Gross Income (AGI) in 2012: $51,313 (Individual Income Tax Returns)
Here:
$51,313
State:
$71,192
Salary/wage: $44,535 (reported on 83.7% of returns)
Here:
$44,535
State:
$59,229
(% of AGI for various income ranges: 71.7% for AGIs below $25k, 80.7% for AGIs $25k-50k, 77.9% for AGIs $50k-75k, 73.0% for AGIs $75k-100k, 82.5% for AGIs $100k-200k, 47.1% for AGIs over 200k)
Taxable interest for individuals: $1,074 (reported on 33.1% of returns)
This zip code:
$1,074
Virginia:
$1,600
(% of AGI for various income ranges: 1.2% for AGIs below $25k, 1.0% for AGIs $25k-50k, 0.4% for AGIs $50k-75k, 0.7% for AGIs $75k-100k, 0.4% for AGIs $100k-200k, 0.7% for AGIs over 200k)
Ordinary dividends: $4,497 (reported on 16.9% of returns)
Here:
$4,497
State:
$6,959
(% of AGI for various income ranges: 1.0% for AGIs below $25k, 1.2% for AGIs $25k-50k, 1.2% for AGIs $50k-75k, 1.1% for AGIs $75k-100k, 3.6% for AGIs $100k-200k)
Net capital gain/loss in AGI: +$10,810 (reported on 12.2% of returns)
Here:
+$10,810
State:
+$16,672
(% of AGI for various income ranges: 0.2% for AGIs $25k-50k, 0.5% for AGIs $50k-75k, 11.8% for AGIs $100k-200k)
Profit/loss from business: +$4,905 (reported on 11.6% of returns)
Here:
+$4,905
State:
+$14,116
(% of AGI for various income ranges: 6.0% for AGIs below $25k, 1.8% for AGIs $25k-50k, 0.7% for AGIs $50k-75k, 0.2% for AGIs $75k-100k, 0.4% for AGIs $100k-200k)
Taxable individual retirement arrangement distribution: $12,511 (reported on 10.5% of returns)
24574:
$12,511
Virginia:
$16,667
(% of AGI for various income ranges: 3.7% for AGIs below $25k, 1.8% for AGIs $25k-50k, 2.5% for AGIs $50k-75k, 8.0% for AGIs $75k-100k)
Total itemized deductions: $19,341 (19% of AGI, reported on 28.5% of returns)
Here:
$19,341
State:
$26,596
Here:
19.4% of AGI
State:
20.1% of AGI
(% of AGI for various income ranges: 6.9% for AGIs below $25k, 8.9% for AGIs $25k-50k, 8.9% for AGIs $50k-75k, 12.2% for AGIs $75k-100k, 14.3% for AGIs $100k-200k, 10.5% for AGIs over 200k)
Charity contributions: $4,031 (reported on 20.9% of returns)
Here:
$4,031
State:
$4,443
(% of AGI for various income ranges: 0.5% for AGIs below $25k, 1.1% for AGIs $25k-50k, 1.5% for AGIs $50k-75k, 2.1% for AGIs $75k-100k, 2.6% for AGIs $100k-200k, 1.4% for AGIs over 200k)
Taxes paid: $6,373 (reported on 28.5% of returns)
24574:
$6,373
State:
$9,951
(% of AGI for various income ranges: 1.0% for AGIs below $25k, 1.5% for AGIs $25k-50k, 2.3% for AGIs $50k-75k, 3.8% for AGIs $75k-100k, 5.6% for AGIs $100k-200k, 5.5% for AGIs over 200k)
Earned income credit: $2,162 (reported on 18.6% of returns)
Here:
$2,162
State:
$2,211
(% of AGI for various income ranges: 6.0% for AGIs below $25k, 1.2% for AGIs $25k-50k)
Percentage of individuals using paid preparers for their 2012 taxes: 48.8%
Here:
49%
State:
46%
(% for various income ranges: 44.9% for AGIs below $25k, 46.3% for AGIs $25k-50k, 56.0% for AGIs $50k-75k, 52.6% for AGIs $75k-100k, 53.3% for AGIs $100k-200k, 66.7% for AGIs over 200k)
Averages for the 2004 tax year for zip code 24574, filed in 2005:
Average Adjusted Gross Income (AGI) in 2004: $38,641 (Individual Income Tax Returns)
Here:
$38,641
State:
$56,704
Salary/wage: $35,328 (reported on 86.2% of returns)
Here:
$35,328
State:
$48,441
(% of AGI for various income ranges: 95.2% for AGIs below $10k, 79.5% for AGIs $10k-25k, 81.0% for AGIs $25k-50k, 80.9% for AGIs $50k-75k, 91.5% for AGIs $75k-100k, 61.6% for AGIs over 100k)
Taxable interest for individuals: $1,265 (reported on 37.6% of returns)
This zip code:
$1,265
Virginia:
$1,688
(% of AGI for various income ranges: 4.4% for AGIs below $10k, 1.9% for AGIs $10k-25k, 1.6% for AGIs $25k-50k, 1.0% for AGIs $50k-75k, 0.4% for AGIs $75k-100k, 1.0% for AGIs over 100k)
Taxable dividends: $2,225 (reported on 18.4% of returns)
Here:
$2,225
State:
$4,028
(% of AGI for various income ranges: 2.8% for AGIs below $10k, 0.8% for AGIs $10k-25k, 1.1% for AGIs $25k-50k, 1.1% for AGIs $50k-75k, 0.3% for AGIs $75k-100k, 1.7% for AGIs over 100k)
Net capital gain/loss: +$4,167 (reported on 13.9% of returns)
Here:
+$4,167
State:
+$14,375
(% of AGI for various income ranges: 1.6% for AGIs below $10k, 0.1% for AGIs $10k-25k, 0.8% for AGIs $25k-50k, 1.1% for AGIs $50k-75k, 0.0% for AGIs $75k-100k, 5.0% for AGIs over 100k)
Profit/loss from business: +$4,508 (reported on 11.1% of returns)
Here:
+$4,508
State:
+$13,342
(% of AGI for various income ranges: 13.5% for AGIs below $10k, 3.4% for AGIs $10k-25k, 1.6% for AGIs $25k-50k, 0.6% for AGIs $50k-75k, -0.2% for AGIs $75k-100k, 0.4% for AGIs over 100k)
IRA payment deduction: $2,875 (reported on 1.9% of returns)
24574:
$2,875
Virginia:
$2,943
Total itemized deductions: $15,687 (23% of AGI, reported on 26.9% of returns)
Here:
$15,687
State:
$21,492
Here:
23.4% of AGI
State:
21.0% of AGI
(% of AGI for various income ranges: 10.4% for AGIs below $10k, 4.1% for AGIs $10k-25k, 10.2% for AGIs $25k-50k, 11.2% for AGIs $50k-75k, 14.2% for AGIs $75k-100k, 13.2% for AGIs over 100k)
Charity contributions deductions: $3,432 (5% of AGI, reported on 23.1% of returns)
Here:
$3,432
State:
$3,794
Here:
4.9% of AGI
State:
3.5% of AGI
(% of AGI for various income ranges: 0.7% for AGIs $10k-25k, 1.7% for AGIs $25k-50k, 2.4% for AGIs $50k-75k, 2.0% for AGIs $75k-100k, 3.2% for AGIs over 100k)
Total tax: $4,624 (reported on 76.4% of returns)
24574:
$4,624
State:
$9,537
(% of AGI for various income ranges: 2.7% for AGIs below $10k, 3.9% for AGIs $10k-25k, 6.7% for AGIs $25k-50k, 8.4% for AGIs $50k-75k, 9.9% for AGIs $75k-100k, 16.3% for AGIs over 100k)
Earned income credit: $1,801 (reported on 16.7% of returns)
Here:
$1,801
State:
$1,734
Percentage of individuals using paid preparers for their 2004 taxes: 52.3%
Here:
52%
State:
52%
(% for various income ranges: 47.1% for AGIs below $10k, 52.2% for AGIs $10k-25k, 52.9% for AGIs $25k-50k, 54.9% for AGIs $50k-75k, 48.8% for AGIs $75k-100k, 65.1% for AGIs over 100k)
Likely homosexual households (counted as self-reported same-sex unmarried-partner households)
Lesbian couples: 0.4% of all households
Gay men: 0.0% of all households
Household received Food Stamps/SNAP in the past 12 months: 165 Household did not receive Food Stamps/SNAP in the past 12 months: 1,443
Women who had a birth in the past 12 months: 36 (23 now married, 12 unmarried) Women who did not have a birth in the past 12 months: 717 (298 now married, 418 unmarried)
Housing units in zip code 24574 with a mortgage: 734 (142 second mortgage, 94 both second mortgage and home equity loan) Median monthly owner costs for units with a mortgage: $1,386 Median monthly owner costs for units without a mortgage: $377
Residents with income below the poverty level in 2022:
This zip code:
14.4%
Whole state:
10.6%
Residents with income below 50% of the poverty level in 2022:
This zip code:
7.4%
Whole state:
5.2%
Median number of rooms in houses and condos:
Here:
6.5
State:
7.0
Median number of rooms in apartments:
Here:
5.1
State:
4.3
Notable locations in this zip code not listed on our city pages
Notable locations in zip code 24574: Middle Otter Creek Overlook (A), Hicks Store (B), Punchbowl Shelter (C), Rice Mountain Overlook (D), White Oak Plats Overlook (E), The Riffles Overlook (F), Terrapin Hill Overlook (G), Bluff Mountain Overlook (H), Dancing Creek Overlook (I), Knoll (J), Johns Hollow Shelter (K), Appomattox County Sheriffs Office (L), Monelison Fire Station Number 3 (M). Display/hide their locations on the map
Churches in zip code 24574 include: Bethany Church (A), Centenary Church (B), Chestnut Grove Baptist Church (C), Smyrna Church (D), Corner Stone Baptist Church (E), Sunrise Church (F), Ivy Hill Church (G), Thornton Church (H), Little Bethel Church (I). Display/hide their locations on the map
Cemeteries: Roberts Cemetery (1), Campbell Cemetery (2), Watts Cemetery (3), Fletcher Cemetery (4), Gatewood Cemetery (5), McIvor Cemetery (6), Hudson Cemetery (7). Display/hide their locations on the map
Streams, rivers, and creeks: Salt Creek (A), Pryor Creek (B), Muddy Creek (C), Mud Creek (D), Mill Creek (E), Wilderness Creek (F), Skulking Branch (G), Forest Creek (H), Falling Rock Creek (I). Display/hide their locations on the map
In group quarters: 253 (-1 institutionalized population)
Size of family households: 636 2-persons, 136 3-persons, 137 4-persons, 34 5-persons, 70 6-persons, 98 7-or-more-persons
Size of nonfamily households: 409 1-person, 100 2-persons
381 married couples with children.
79 single-parent households (9 men, 70 women).
96.2% of residents of 24574 zip code speak English at home.
1.4% of residents speak Spanish at home (65% very well, 30% not well, 5% not at all).
0.9% of residents speak Asian or Pacific Island language at home (100% very well).
1.6% of residents speak other language at home (100% very well).
Foreign born population: 178 (4.2%) (75.5% of them are naturalized citizens)
This zip code:
4.2%
Whole state:
12.7%
26%Cabo Verde
14%Micronesia
13%Costa Rica
10%El Salvador
7%Romania
6%Belize
5%Honduras
43%American
17%English
4%Ghanaian
4%German
2%Scottish
1%Italian
1%Norwegian
Year of entry for the foreign-born population
312010 or later
672000 to 2009
01990 to 1999
84Before 1990
Facilities with environmental interests located in this zip code:
AMHERST COUNTY SCHOOLS - PLEASANT VIEW ELEMENTARY (229 DANCING CREEK ROAD in MONROE, VA)
AIR MINOR (AIRS/AFS) STATE MASTER (Virginia pollutants databases) - CEDS-30165, AIR PROGRAM (National Center for Education Statistics) - STATE ID-0050240 Business SIC and NAICS classification: ELEMENTARY AND SECONDARY SCHOOLS Organizations: AMHERST COUNTY PUBLIC SCHOOLS (SCHOOL DISTRICT)
AMHERST COUNTY SCHOOLS - MONROE ALTERNATIVE (FRANCES ROAD in MONROE, VA)
AIR MINOR (AIRS/AFS) STATE MASTER (Virginia pollutants databases) - CEDS-30221, AIR PROGRAM Business SIC and NAICS classification: ELEMENTARY AND SECONDARY SCHOOLS Alternative names: MONROE ALTERNATIVE HIGH SCHOOL
Housing units lacking complete plumbing facilities: 2.5%
77.1%Electricity
9.0%Fuel oil, kerosene, etc.
5.1%Bottled, tank, or LP gas
4.7%Utility gas
4.3%Wood
Population in 1990: 5,050.
Place of birth for U.S.-born residents:
This state: 3,325
Northeast: 255
Midwest: 176
South: 225
West: 57
65% of the 24574 zip code residents lived in the same house 5 years ago. Out of people who lived in different houses, 38% lived in this county. Out of people who lived in different counties, 50% lived in Virginia.
93% of the 24574 zip code residents lived in the same house 1 year ago. Out of people who lived in different houses, 31% moved from this county. Out of people who lived in different houses, 62% moved from different county within same state. Out of people who lived in different houses, 10% moved from different state.
Private vs. public school enrollment:
Students in private schools in grades 1 to 8 (elementary and middle school): 59
Here:
17.6%
Virginia:
13.2%
Students in private schools in grades 9 to 12 (high school): 30
Here:
21.3%
Virginia:
10.2%
Students in private undergraduate colleges: 46
Here:
29.7%
Virginia:
18.7%
Occupation by median earnings in the past 12 months ($)
74,267Health diagnosing and treating practitioners and other technical occupations
65,220Management occupations
51,545Business and financial operations occupations
47,605Installation, maintenance, and repair occupations
44,867Building and grounds cleaning and maintenance occupations
37,326Production occupations
Top industries in this zip code by the number of employees in 2005:
Health Care and Social Assistance: Vocational Rehabilitation Services (100-249 employees: 1 establishment)
Other Services (except Public Administration): Commercial and Industrial Machinery and Equipment (except Automotive and Electronic) Repair and Maintenance (20-49: 1, 1-4: 1)
Construction: New Single-Family Housing Construction (except Operative Builders) (10-19: 1, 1-4: 6)
2002 - 2018 National Fire Incident Reporting System (NFIRS) incidents
Based on the data from the years 2002 - 2018 the average number of fire incidents per year is 17. The highest number of fire incidents - 40 took place in 2006, and the least - 3 in 2018. The data has a decreasing trend.
When looking into fire subcategories, the most reports belonged to: Outside Fires (49.5%), and Structure Fires (35.5%).
Fire incident types reported to NFIRS in Zip Code 24574


 Nearest zip codes: 24536, 24503, 24526, 24521, 24595, 24416.


 Based on the data from the years 2002 - 2018 the average number of fire incidents per year is 17. The highest number of fire incidents - 40 took place in 2006, and the least - 3 in 2018. The data has a decreasing trend.
 When looking into fire subcategories, the most reports belonged to: Outside Fires (49.5%), and Structure Fires (35.5%).