Estimated zip code population in 2022: 1,011 Zip code population in 2010: 1,026 Zip code population in 2000: 1,343
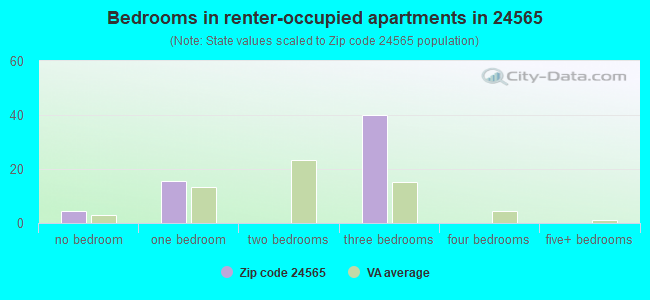
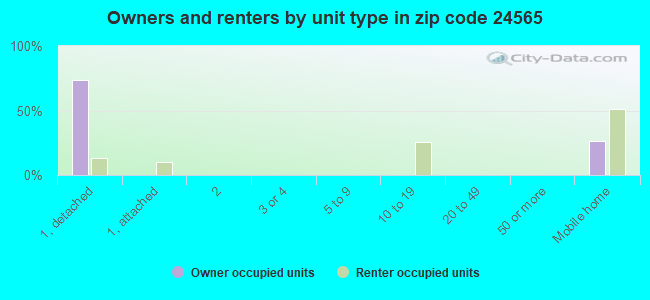
Houses and condos: 558 Renter-occupied apartments: 59
% of renters here:
14%
State:
33%
March 2022 cost of living index in zip code 24565: 82.6 (low, U.S. average is 100)
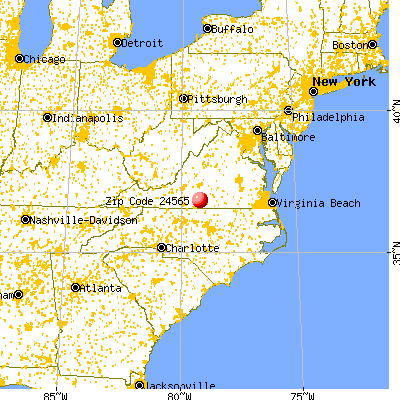
Land area: 57.4 sq. mi. Water area: 0.4 sq. mi.
Population density: 18 people per square mile
(very low).
OSM Map
General Map
Google Map
MSN Map
OSM Map
General Map
Google Map
MSN Map
OSM Map
General Map
Google Map
MSN Map
OSM Map
General Map
Google Map
MSN Map
Please wait while loading the map...
Real estate property taxes paid for housing units in 2022:
This zip code:
0.6% ($767)
Virginia:
0.7% ($2,617)
Median real estate property taxes paid for housing units with mortgages in 2022: $1,014 (0.7%) Median real estate property taxes paid for housing units with no mortgage in 2022: $657 (0.5%)
Business Search- 14 Million verified businesses
Males: 387
(38.3%)
Females: 624
(61.7%)
For population 25 years and over in 24565:
High school or higher: 76.8%
Bachelor's degree or higher: 12.2%
Graduate or professional degree: 3.1%
Unemployed: 8.7%
Mean travel time to work (commute): 33.7 minutes
For population 15 years and over in 24565:
Never married: 27.9%
Now married: 38.5%
Separated: 6.3%
Widowed: 14.8%
Divorced: 12.5%
Zip code 24565 compared to state average:
Median household income below state average.
Median house value significantly below state average.
Unemployed percentage above state average.
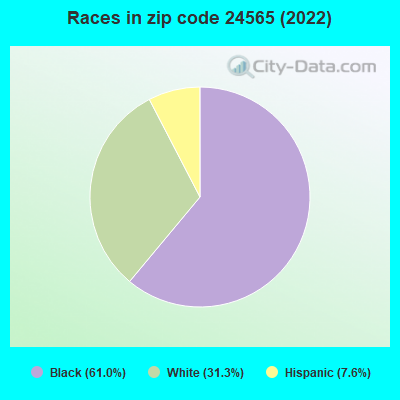
Black race population percentage significantly above state average.
Median age significantly above state average.
Foreign-born population percentage significantly below state average.
Renting percentage significantly below state average.
Length of stay since moving in significantly above state average.
Percentage of population with a bachelor's degree or higher significantly below state average.
Averages for the 2020 tax year for zip code 24565, filed in 2021:
Average Adjusted Gross Income (AGI) in 2020: $44,033 (Individual Income Tax Returns)
Here:
$44,033
State:
$86,446
Salary/wage: $37,463 (reported on 83.3% of returns)
Here:
$37,463
State:
$71,185
(% of AGI for various income ranges: 1230.8% for AGIs below $25k, 3433.0% for AGIs $25k-50k, 4570.0% for AGIs $50k-75k, 21400.0% for AGIs $100k-200k)
Taxable interest for individuals: $429 (reported on 16.7% of returns)
This zip code:
$429
Virginia:
$1,805
(% of AGI for various income ranges: 3.1% for AGIs below $25k, 21.0% for AGIs $25k-50k)
Ordinary dividends: $2,475 (reported on 9.5% of returns)
Here:
$2,475
State:
$8,327
(% of AGI for various income ranges: 99.0% for AGIs $25k-50k)
Net capital gain/loss in AGI: +$3,033 (reported on 7.1% of returns)
Here:
+$3,033
State:
+$24,644
(% of AGI for various income ranges: 70.0% for AGIs below $25k)
Profit/loss from business: +$580 (reported on 11.9% of returns)
Here:
+$580
State:
+$12,836
(% of AGI for various income ranges: 20.0% for AGIs below $25k, 6.0% for AGIs $50k-75k)
Taxable individual retirement arrangement distribution: $7,800 (reported on 7.1% of returns)
24565:
$7,800
Virginia:
$21,535
(% of AGI for various income ranges: 234.0% for AGIs $25k-50k)
Total itemized deductions: $23,667 (reported on 7.1% of returns)
Here:
$23,667
State:
$33,287
(% of AGI for various income ranges: 710.0% for AGIs $25k-50k)
Charity contributions: $12,000 (reported on 4.8% of returns)
Here:
$12,000
State:
$10,381
(% of AGI for various income ranges: 240.0% for AGIs $25k-50k)
Taxes paid: $5,533 (reported on 7.1% of returns)
24565:
$5,533
State:
$8,284
(% of AGI for various income ranges: 166.0% for AGIs $25k-50k)
Earned income credit: $2,322 (reported on 21.4% of returns)
Here:
$2,322
State:
$2,214
(% of AGI for various income ranges: 101.5% for AGIs below $25k, 77.0% for AGIs $25k-50k)
Percentage of individuals using paid preparers for their 2020 taxes: 92.9%
Here:
93%
State:
92%
(% for various income ranges: 94.1% for AGIs below $25k, 84.6% for AGIs $25k-50k, 100.0% for AGIs $50k-75k, 100.0% for AGIs $75k-100k, 100.0% for AGIs $100k-200k)
Averages for the 2012 tax year for zip code 24565, filed in 2013:
Average Adjusted Gross Income (AGI) in 2012: $32,408 (Individual Income Tax Returns)
Here:
$32,408
State:
$71,192
Salary/wage: $27,220 (reported on 90.0% of returns)
Here:
$27,220
State:
$59,229
(% of AGI for various income ranges: 88.1% for AGIs below $25k, 78.7% for AGIs $25k-50k, 76.8% for AGIs $50k-75k, 61.9% for AGIs $75k-100k)
Taxable interest for individuals: $692 (reported on 24.0% of returns)
This zip code:
$692
Virginia:
$1,600
(% of AGI for various income ranges: 0.1% for AGIs below $25k, 0.4% for AGIs $25k-50k, 0.6% for AGIs $50k-75k, 0.9% for AGIs $75k-100k)
Ordinary dividends: $2,450 (reported on 8.0% of returns)
Here:
$2,450
State:
$6,959
Net capital gain/loss in AGI: +$4,925 (reported on 8.0% of returns)
Here:
+$4,925
State:
+$16,672
Profit/loss from business: +$3,750 (reported on 12.0% of returns)
Here:
+$3,750
State:
+$14,116
Taxable individual retirement arrangement distribution: $6,467 (reported on 6.0% of returns)
24565:
$6,467
Virginia:
$16,667
Total itemized deductions: $14,862 (23% of AGI, reported on 16.0% of returns)
Here:
$14,862
State:
$26,596
Here:
23.4% of AGI
State:
20.1% of AGI
(% of AGI for various income ranges: 8.9% for AGIs below $25k, 9.3% for AGIs $50k-75k, 11.3% for AGIs $75k-100k)
Charity contributions: $4,686 (reported on 14.0% of returns)
Here:
$4,686
State:
$4,443
Taxes paid: $3,522 (reported on 18.0% of returns)
24565:
$3,522
State:
$9,951
(% of AGI for various income ranges: 1.5% for AGIs below $25k, 2.6% for AGIs $50k-75k, 3.6% for AGIs $75k-100k)
Earned income credit: $1,800 (reported on 36.0% of returns)
Here:
$1,800
State:
$2,211
(% of AGI for various income ranges: 7.3% for AGIs below $25k, 1.6% for AGIs $25k-50k)
Percentage of individuals using paid preparers for their 2012 taxes: 48.0%
Here:
48%
State:
46%
(% for various income ranges: 33.3% for AGIs below $25k, 58.3% for AGIs $25k-50k, 66.7% for AGIs $50k-75k, 80.0% for AGIs $75k-100k)
Averages for the 2004 tax year for zip code 24565, filed in 2005:
Average Adjusted Gross Income (AGI) in 2004: $29,778 (Individual Income Tax Returns)
Here:
$29,778
State:
$56,704
Salary/wage: $26,073 (reported on 89.2% of returns)
Here:
$26,073
State:
$48,441
(% of AGI for various income ranges: 124.0% for AGIs below $10k, 85.0% for AGIs $10k-25k, 88.0% for AGIs $25k-50k, 74.2% for AGIs $50k-75k, 54.6% for AGIs $75k-100k, 57.9% for AGIs over 100k)
Taxable interest for individuals: $449 (reported on 30.5% of returns)
This zip code:
$449
Virginia:
$1,688
(% of AGI for various income ranges: 0.8% for AGIs below $10k, 0.5% for AGIs $10k-25k, 0.3% for AGIs $25k-50k, 0.6% for AGIs $50k-75k, 0.9% for AGIs $75k-100k)
Taxable dividends: $1,386 (reported on 12.8% of returns)
Here:
$1,386
State:
$4,028
Net capital gain/loss: +$5,372 (reported on 9.6% of returns)
Here:
+$5,372
State:
+$14,375
Profit/loss from business: +$1,282 (reported on 8.7% of returns)
Here:
+$1,282
State:
+$13,342
Total itemized deductions: $14,684 (25% of AGI, reported on 17.7% of returns)
Here:
$14,684
State:
$21,492
Here:
25.5% of AGI
State:
21.0% of AGI
Charity contributions deductions: $4,203 (7% of AGI, reported on 16.6% of returns)
Here:
$4,203
State:
$3,794
Here:
7.3% of AGI
State:
3.5% of AGI
Total tax: $3,399 (reported on 65.2% of returns)
24565:
$3,399
State:
$9,537
(% of AGI for various income ranges: 1.9% for AGIs below $10k, 3.1% for AGIs $10k-25k, 5.7% for AGIs $25k-50k, 8.8% for AGIs $50k-75k, 8.8% for AGIs $75k-100k, 15.7% for AGIs over 100k)
Earned income credit: $1,873 (reported on 30.0% of returns)
Here:
$1,873
State:
$1,734
Percentage of individuals using paid preparers for their 2004 taxes: 69.1%
Here:
69%
State:
52%
(% for various income ranges: 67.8% for AGIs below $10k, 65.4% for AGIs $10k-25k, 73.8% for AGIs $25k-50k, 66.0% for AGIs $50k-75k, 127.8% for AGIs $75k-100k)
Household received Food Stamps/SNAP in the past 12 months: 69 Household did not receive Food Stamps/SNAP in the past 12 months: 351
Women who had a birth in the past 12 months: 72 (0 now married, 67 unmarried) Women who did not have a birth in the past 12 months: 133 (34 now married, 99 unmarried)
Housing units in zip code 24565 with a mortgage: 91 (4 second mortgage, 5 home equity loan) Median monthly owner costs for units with a mortgage: $727 Median monthly owner costs for units without a mortgage: $365
Residents with income below the poverty level in 2022:
This zip code:
13.0%
Whole state:
10.6%
Residents with income below 50% of the poverty level in 2022:
This zip code:
3.2%
Whole state:
5.2%
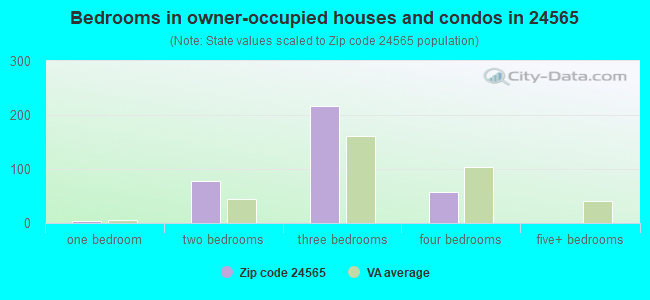
Median number of rooms in houses and condos:
Here:
6.4
State:
7.0
Median number of rooms in apartments:
Here:
3.9
State:
4.3
Notable locations in this zip code not listed on our city pages
Churches in zip code 24565 include: Providence Church (A), Saint Pauls Church (B), County Line Church (C), Womacks Chapel (D), Riceville Baptist Church (E). Display/hide their locations on the map
In group quarters: 13 (-1 institutionalized population)
Size of family households: 104 2-persons, 58 3-persons, 19 4-persons, 16 5-persons, 13 6-persons
Size of nonfamily households: 205 1-person
8 married couples with children.
60 single-parent households (60 women).
93.4% of residents of 24565 zip code speak English at home.
6.3% of residents speak Spanish at home (25% very well, 61% well, 14% not well).
0.6% of residents speak other language at home (100% very well).
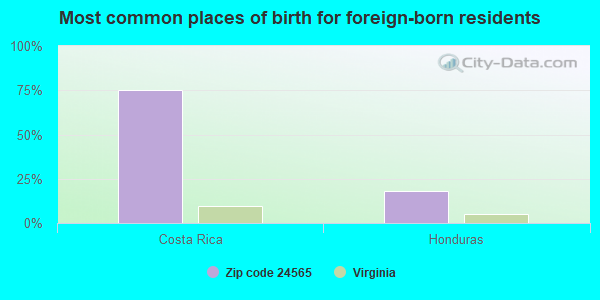
Foreign born population: 41 (4.1%) (0.0% of them are naturalized citizens)
:
4.1%
Whole state:
12.7%
75%Costa Rica
18%Honduras
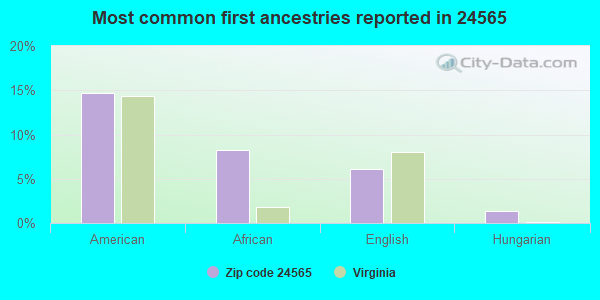
15%American
8%African
6%English
1%Hungarian
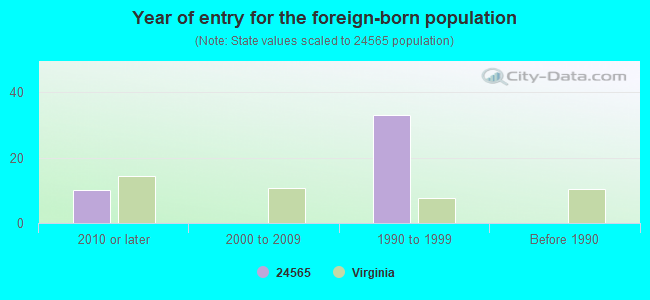
Year of entry for the foreign-born population
102010 or later
02000 to 2009
331990 to 1999
0Before 1990
Housing units lacking complete plumbing facilities: 11.9% Housing units lacking complete kitchen facilities: 10.3%
68.5%Electricity
17.1%Bottled, tank, or LP gas
7.2%Fuel oil, kerosene, etc.
6.5%Wood
1.5%Utility gas
Population in 1990: 1,111. Population change in the 1990s: +232 (+20.9%).
Place of birth for U.S.-born residents:
This state: 879
Northeast: 45
South: 19
West: 14
75% of the 24565 zip code residents lived in the same house 5 years ago. Out of people who lived in different houses, 49% lived in this county. Out of people who lived in different counties, 50% lived in Virginia.
101% of the 24565 zip code residents lived in the same house 1 year ago.
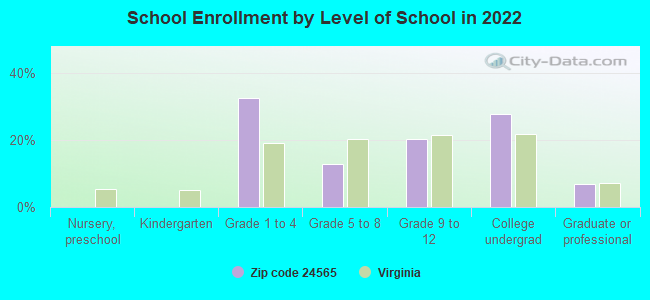
Private vs. public school enrollment:
Students in private schools in grades 1 to 8 (elementary and middle school):
Here:
0.0%
Virginia:
13.2%
Students in private schools in grades 9 to 12 (high school):
Here:
0.0%
Virginia:
10.2%
Students in private undergraduate colleges: 16
Here:
41.0%
Virginia:
18.7%
Occupation by median earnings in the past 12 months ($)
30,621Production occupations
23,289Sales and related occupations
20,486Healthcare support occupations
11,444Building and grounds cleaning and maintenance occupations
2,452Management occupations
Top industries in this zip code by the number of employees in 2005:
Other Services (except Public Administration): Religious Organizations (5-9 employees: 1 establishment, 1-4 employees: 1 establishment)
Construction: New Single-Family Housing Construction (except Operative Builders) (5-9: 1)
Other Services (except Public Administration): All Other Personal Services (5-9: 1)
Accommodation and Food Services: RV (Recreational Vehicle) Parks and Campgrounds (1-4: 1)
Construction: All Other Specialty Trade Contractors (1-4: 1)
Professional, Scientific, and Technical Services: Offices of Lawyers (1-4: 1)
Accommodation and Food Services: Limited-Service Restaurants (1-4: 1)
Home Mortgage Disclosure Act Aggregated Statistics For Year 2009 (Based on 2 partial tracts)
A) FHA, FSA/RHS & VA Home Purchase Loans
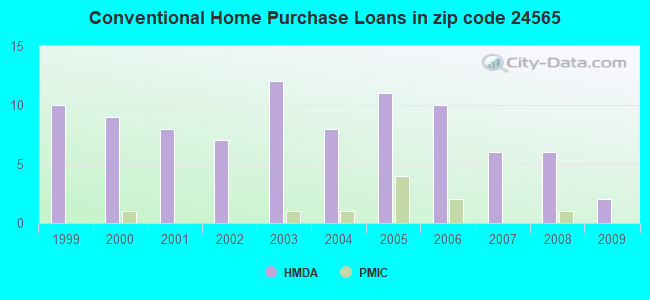
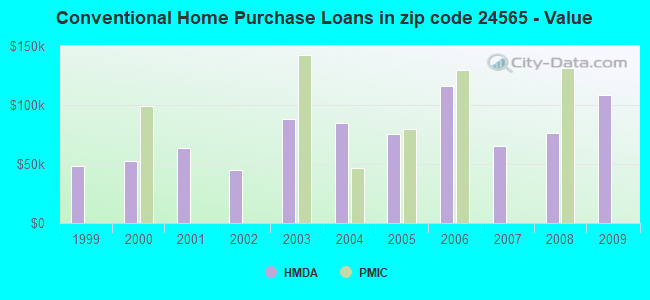
B) Conventional Home Purchase Loans
C) Refinancings
D) Home Improvement Loans
F) Non-occupant Loans on < 5 Family Dwellings (A B C & D)
G) Loans On Manufactured Home Dwelling (A B C & D)
Number
Average Value
Number
Average Value
Number
Average Value
Number
Average Value
Number
Average Value
Number
Average Value
LOANS ORIGINATED
7
$97,461
2
$108,560
8
$112,032
1
$43,220
1
$19,550
6
$61,740
APPLICATIONS APPROVED, NOT ACCEPTED
0
$0
0
$0
1
$20,580
0
$0
0
$0
0
$0
APPLICATIONS DENIED
0
$0
7
$47,921
9
$109,302
0
$0
3
$49,050
1
$22,640
APPLICATIONS WITHDRAWN
0
$0
0
$0
3
$100,500
0
$0
0
$0
0
$0
FILES CLOSED FOR INCOMPLETENESS
0
$0
0
$0
4
$130,167
0
$0
0
$0
0
$0
Aggregated Statistics For Year 2008 (Based on 2 partial tracts)
A) FHA, FSA/RHS & VA Home Purchase Loans
B) Conventional Home Purchase Loans
C) Refinancings
D) Home Improvement Loans
F) Non-occupant Loans on < 5 Family Dwellings (A B C & D)
G) Loans On Manufactured Home Dwelling (A B C & D)
Number
Average Value
Number
Average Value
Number
Average Value
Number
Average Value
Number
Average Value
Number
Average Value
LOANS ORIGINATED
4
$161,552
6
$76,147
11
$304,584
2
$19,550
3
$117,993
2
$62,255
APPLICATIONS APPROVED, NOT ACCEPTED
0
$0
1
$119,360
2
$38,075
1
$10,290
0
$0
0
$0
APPLICATIONS DENIED
1
$184,190
2
$113,190
12
$107,959
2
$20,065
2
$113,190
2
$92,610
APPLICATIONS WITHDRAWN
1
$76,150
0
$0
1
$65,860
2
$3,600
0
$0
0
$0
FILES CLOSED FOR INCOMPLETENESS
1
$60,710
0
$0
0
$0
0
$0
0
$0
0
$0
Aggregated Statistics For Year 2007 (Based on 2 partial tracts)
A) FHA, FSA/RHS & VA Home Purchase Loans
B) Conventional Home Purchase Loans
C) Refinancings
D) Home Improvement Loans
F) Non-occupant Loans on < 5 Family Dwellings (A B C & D)
G) Loans On Manufactured Home Dwelling (A B C & D)
Number
Average Value
Number
Average Value
Number
Average Value
Number
Average Value
Number
Average Value
Number
Average Value
LOANS ORIGINATED
1
$62,770
6
$65,170
9
$104,616
7
$28,519
4
$74,860
4
$60,968
APPLICATIONS APPROVED, NOT ACCEPTED
0
$0
1
$115,250
6
$56,767
1
$25,730
0
$0
2
$75,115
APPLICATIONS DENIED
0
$0
2
$29,325
20
$108,251
6
$51,450
0
$0
6
$62,598
APPLICATIONS WITHDRAWN
0
$0
0
$0
16
$88,108
0
$0
0
$0
1
$24,700
FILES CLOSED FOR INCOMPLETENESS
0
$0
0
$0
2
$165,670
0
$0
0
$0
0
$0
Aggregated Statistics For Year 2006 (Based on 2 partial tracts)
A) FHA, FSA/RHS & VA Home Purchase Loans
B) Conventional Home Purchase Loans
C) Refinancings
D) Home Improvement Loans
F) Non-occupant Loans on < 5 Family Dwellings (A B C & D)
G) Loans On Manufactured Home Dwelling (A B C & D)
Number
Average Value
Number
Average Value
Number
Average Value
Number
Average Value
Number
Average Value
Number
Average Value
LOANS ORIGINATED
0
$0
10
$116,174
14
$108,486
1
$77,180
4
$134,285
4
$57,625
APPLICATIONS APPROVED, NOT ACCEPTED
0
$0
3
$65,857
4
$55,822
3
$47,333
0
$0
1
$66,890
APPLICATIONS DENIED
0
$0
11
$85,595
19
$61,686
5
$39,514
2
$45,275
10
$76,146
APPLICATIONS WITHDRAWN
1
$80,260
3
$72,030
28
$68,281
2
$48,365
0
$0
6
$73,402
FILES CLOSED FOR INCOMPLETENESS
1
$174,930
0
$0
4
$107,272
0
$0
0
$0
0
$0
Aggregated Statistics For Year 2005 (Based on 2 partial tracts)
A) FHA, FSA/RHS & VA Home Purchase Loans
B) Conventional Home Purchase Loans
C) Refinancings
D) Home Improvement Loans
F) Non-occupant Loans on < 5 Family Dwellings (A B C & D)
G) Loans On Manufactured Home Dwelling (A B C & D)
Number
Average Value
Number
Average Value
Number
Average Value
Number
Average Value
Number
Average Value
Number
Average Value
LOANS ORIGINATED
1
$111,130
11
$75,305
17
$85,831
5
$9,262
1
$29,840
7
$62,769
APPLICATIONS APPROVED, NOT ACCEPTED
0
$0
1
$31,900
5
$58,448
1
$10,290
2
$27,785
1
$92,610
APPLICATIONS DENIED
3
$80,947
3
$28,127
27
$61,092
7
$33,076
0
$0
13
$46,305
APPLICATIONS WITHDRAWN
0
$0
1
$41,160
14
$90,699
3
$27,440
1
$45,280
3
$66,200
FILES CLOSED FOR INCOMPLETENESS
0
$0
0
$0
2
$76,145
0
$0
0
$0
0
$0
Aggregated Statistics For Year 2004 (Based on 2 partial tracts)
A) FHA, FSA/RHS & VA Home Purchase Loans
B) Conventional Home Purchase Loans
C) Refinancings
D) Home Improvement Loans
F) Non-occupant Loans on < 5 Family Dwellings (A B C & D)
G) Loans On Manufactured Home Dwelling (A B C & D)
Number
Average Value
Number
Average Value
Number
Average Value
Number
Average Value
Number
Average Value
Number
Average Value
LOANS ORIGINATED
2
$81,805
8
$85,021
26
$80,104
2
$35,500
1
$74,090
9
$62,769
APPLICATIONS APPROVED, NOT ACCEPTED
0
$0
6
$59,510
13
$57,387
0
$0
0
$0
7
$53,801
APPLICATIONS DENIED
0
$0
5
$61,740
39
$81,634
5
$32,310
0
$0
13
$60,869
APPLICATIONS WITHDRAWN
0
$0
2
$117,305
16
$101,421
2
$17,495
0
$0
1
$82,320
FILES CLOSED FOR INCOMPLETENESS
0
$0
1
$54,540
1
$41,160
0
$0
0
$0
0
$0
Aggregated Statistics For Year 2003 (Based on 2 partial tracts)
A) FHA, FSA/RHS & VA Home Purchase Loans
B) Conventional Home Purchase Loans
C) Refinancings
D) Home Improvement Loans
F) Non-occupant Loans on < 5 Family Dwellings (A B C & D)
Number
Average Value
Number
Average Value
Number
Average Value
Number
Average Value
Number
Average Value
LOANS ORIGINATED
2
$91,580
12
$88,408
34
$75,692
1
$6,170
4
$89,780
APPLICATIONS APPROVED, NOT ACCEPTED
0
$0
8
$71,901
5
$55,566
0
$0
2
$54,535
APPLICATIONS DENIED
2
$40,130
4
$42,190
15
$85,819
0
$0
0
$0
APPLICATIONS WITHDRAWN
0
$0
2
$78,205
9
$74,317
0
$0
1
$30,870
FILES CLOSED FOR INCOMPLETENESS
0
$0
0
$0
2
$162,580
0
$0
0
$0
Aggregated Statistics For Year 2002 (Based on 2 partial tracts)
B) Conventional Home Purchase Loans
C) Refinancings
D) Home Improvement Loans
F) Non-occupant Loans on < 5 Family Dwellings (A B C & D)
Number
Average Value
Number
Average Value
Number
Average Value
Number
Average Value
LOANS ORIGINATED
7
$44,981
29
$73,201
5
$19,552
2
$56,080
APPLICATIONS APPROVED, NOT ACCEPTED
0
$0
6
$56,423
1
$20,580
0
$0
APPLICATIONS DENIED
10
$43,012
27
$54,041
0
$0
2
$25,210
APPLICATIONS WITHDRAWN
2
$50,935
16
$73,381
0
$0
0
$0
FILES CLOSED FOR INCOMPLETENESS
0
$0
2
$38,590
0
$0
0
$0
Aggregated Statistics For Year 2001 (Based on 2 partial tracts)
A) FHA, FSA/RHS & VA Home Purchase Loans
B) Conventional Home Purchase Loans
C) Refinancings
D) Home Improvement Loans
F) Non-occupant Loans on < 5 Family Dwellings (A B C & D)
Number
Average Value
Number
Average Value
Number
Average Value
Number
Average Value
Number
Average Value
LOANS ORIGINATED
0
$0
8
$63,284
15
$58,585
5
$44,248
3
$30,183
APPLICATIONS APPROVED, NOT ACCEPTED
0
$0
3
$45,277
3
$53,167
0
$0
0
$0
APPLICATIONS DENIED
1
$73,060
5
$37,868
14
$66,444
2
$9,260
0
$0
APPLICATIONS WITHDRAWN
0
$0
3
$54,193
6
$52,993
0
$0
0
$0
FILES CLOSED FOR INCOMPLETENESS
0
$0
0
$0
5
$62,770
0
$0
0
$0
Aggregated Statistics For Year 2000 (Based on 2 partial tracts)
A) FHA, FSA/RHS & VA Home Purchase Loans
B) Conventional Home Purchase Loans
C) Refinancings
D) Home Improvement Loans
Number
Average Value
Number
Average Value
Number
Average Value
Number
Average Value
LOANS ORIGINATED
0
$0
9
$52,479
16
$61,804
3
$23,323
APPLICATIONS APPROVED, NOT ACCEPTED
0
$0
1
$41,160
3
$33,613
0
$0
APPLICATIONS DENIED
1
$38,070
4
$43,990
7
$54,243
2
$4,630
APPLICATIONS WITHDRAWN
0
$0
1
$73,060
0
$0
0
$0
FILES CLOSED FOR INCOMPLETENESS
0
$0
0
$0
0
$0
0
$0
Aggregated Statistics For Year 1999 (Based on 1 partial tract)
A) FHA, FSA/RHS & VA Home Purchase Loans
B) Conventional Home Purchase Loans
C) Refinancings
D) Home Improvement Loans
F) Non-occupant Loans on < 5 Family Dwellings (A B C & D)
Detailed PMIC statistics for the following Tracts:0107.00
2002 - 2018 National Fire Incident Reporting System (NFIRS) incidents
According to the data from the years 2002 - 2018 the average number of fire incidents per year is 10. The highest number of reported fire incidents - 24 took place in 2006, and the least - 1 in 2002. The data has a rising trend.
When looking into fire subcategories, the most incidents belonged to: Outside Fires (48.3%), and Structure Fires (37.9%).
Fire incident types reported to NFIRS in Zip Code 24565


 Nearest zip codes: 24597, 24566, 24557, 24527, 24594, 24569.


 According to the data from the years 2002 - 2018 the average number of fire incidents per year is 10. The highest number of reported fire incidents - 24 took place in 2006, and the least - 1 in 2002. The data has a rising trend.
 When looking into fire subcategories, the most incidents belonged to: Outside Fires (48.3%), and Structure Fires (37.9%).