Estimated zip code population in 2022: 1,958 Zip code population in 2010: 1,651 Zip code population in 2000: 1,741
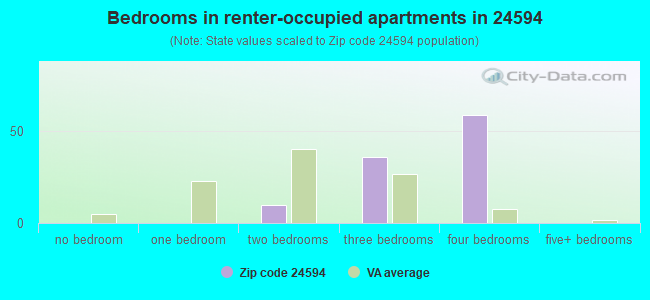
Houses and condos: 802 Renter-occupied apartments: 106
% of renters here:
14%
State:
33%
March 2022 cost of living index in zip code 24594: 85.2 (less than average, U.S. average is 100)
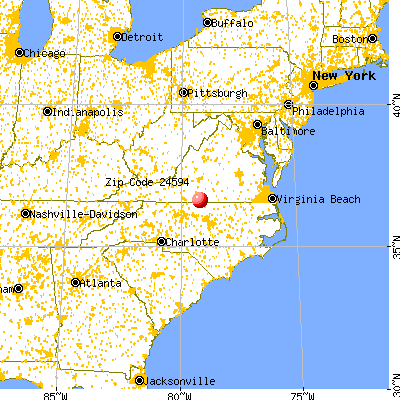
Land area: 54.9 sq. mi. Water area: 0.2 sq. mi.
Population density: 36 people per square mile
(very low).
OSM Map
General Map
Google Map
MSN Map
OSM Map
General Map
Google Map
MSN Map
OSM Map
General Map
Google Map
MSN Map
OSM Map
General Map
Google Map
MSN Map
Please wait while loading the map...
Real estate property taxes paid for housing units in 2022:
This zip code:
0.4% ($713)
Virginia:
0.7% ($2,617)
Median real estate property taxes paid for housing units with mortgages in 2022: $645 (0.7%) Median real estate property taxes paid for housing units with no mortgage in 2022: $974 (0.6%)
Business Search- 14 Million verified businesses
Males: 1,053
(53.8%)
Females: 904
(46.2%)
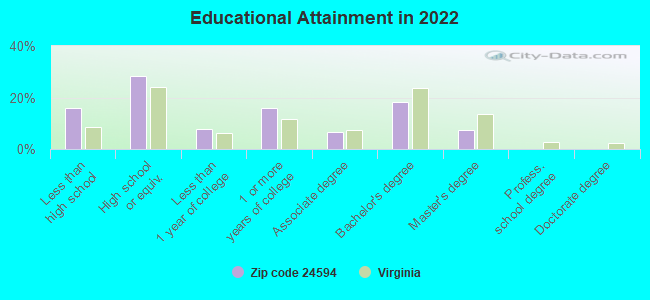
For population 25 years and over in 24594:
High school or higher: 82.1%
Bachelor's degree or higher: 25.0%
Graduate or professional degree: 7.2%
Unemployed: 5.8%
Mean travel time to work (commute): 25.6 minutes
For population 15 years and over in 24594:
Never married: 27.6%
Now married: 43.7%
Separated: 5.8%
Widowed: 14.1%
Divorced: 8.8%
Zip code 24594 compared to state average:
Median household income below state average.
Median house value significantly below state average.
Hispanic race population percentage significantly below state average.
Median age significantly above state average.
Foreign-born population percentage significantly below state average.
Renting percentage significantly below state average.
Length of stay since moving in significantly above state average.
Percentage of population with a bachelor's degree or higher below state average.
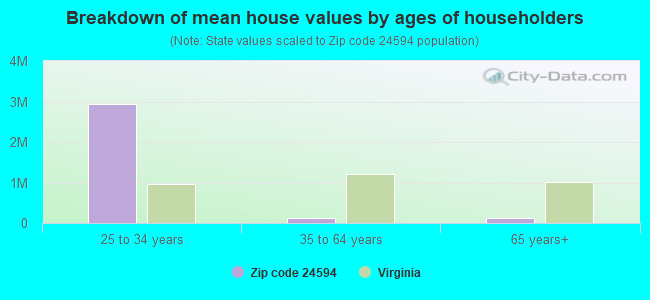
Estimated median house/condo value in 2022: $162,079
24594:
$162,079
Virginia:
$365,700
According to our research of Virginia and other state lists, there were 4 registered sex offenders living in 24594 zip code as of May 28, 2024. The ratio of all residents to sex offenders in zip code 24594 is 403 to 1. The ratio of registered sex offenders to all residents in this zip code is near the state average.
Median resident age:
This zip code:
49.4 years
Virginia median age:
39.0 years
Average household size:
This zip code:
2.7 people
Virginia:
2.5 people
Averages for the 2020 tax year for zip code 24594, filed in 2021:
Average Adjusted Gross Income (AGI) in 2020: $49,163 (Individual Income Tax Returns)
Here:
$49,163
State:
$86,446
Salary/wage: $43,664 (reported on 83.1% of returns)
Here:
$43,664
State:
$71,185
(% of AGI for various income ranges: 1066.4% for AGIs below $25k, 3547.1% for AGIs $25k-50k, 6670.0% for AGIs $50k-75k, 8528.0% for AGIs $75k-100k, 16906.0% for AGIs $100k-200k)
Taxable interest for individuals: $388 (reported on 23.9% of returns)
This zip code:
$388
Virginia:
$1,805
(% of AGI for various income ranges: 7.7% for AGIs below $25k, 3.5% for AGIs $25k-50k, 35.7% for AGIs $50k-75k, 10.0% for AGIs $75k-100k, 26.0% for AGIs $100k-200k)
Ordinary dividends: $3,038 (reported on 11.3% of returns)
Here:
$3,038
State:
$8,327
(% of AGI for various income ranges: 10.0% for AGIs below $25k, 85.7% for AGIs $50k-75k, 322.0% for AGIs $100k-200k)
Net capital gain/loss in AGI: +$6,071 (reported on 9.9% of returns)
Here:
+$6,071
State:
+$24,644
(% of AGI for various income ranges: 61.4% for AGIs $50k-75k, 764.0% for AGIs $100k-200k)
Profit/loss from business: +$1,727 (reported on 15.5% of returns)
Here:
+$1,727
State:
+$12,836
(% of AGI for various income ranges: 100.9% for AGIs below $25k)
Taxable individual retirement arrangement distribution: $6,771 (reported on 9.9% of returns)
24594:
$6,771
Virginia:
$21,535
(% of AGI for various income ranges: 102.7% for AGIs below $25k, 496.0% for AGIs $75k-100k)
Total itemized deductions: $25,125 (reported on 5.6% of returns)
Here:
$25,125
State:
$33,287
(% of AGI for various income ranges: 2010.0% for AGIs $75k-100k)
Charity contributions: $7,433 (reported on 4.2% of returns)
Here:
$7,433
State:
$10,381
(% of AGI for various income ranges: 318.6% for AGIs $50k-75k)
Taxes paid: $6,075 (reported on 5.6% of returns)
24594:
$6,075
State:
$8,284
(% of AGI for various income ranges: 486.0% for AGIs $75k-100k)
Earned income credit: $2,478 (reported on 25.4% of returns)
Here:
$2,478
State:
$2,214
(% of AGI for various income ranges: 139.5% for AGIs below $25k, 81.8% for AGIs $25k-50k)
Percentage of individuals using paid preparers for their 2020 taxes: 91.5%
Here:
92%
State:
92%
(% for various income ranges: 92.6% for AGIs below $25k, 90.0% for AGIs $25k-50k, 88.9% for AGIs $50k-75k, 85.7% for AGIs $75k-100k, 100.0% for AGIs $100k-200k)
Averages for the 2012 tax year for zip code 24594, filed in 2013:
Average Adjusted Gross Income (AGI) in 2012: $42,624 (Individual Income Tax Returns)
Here:
$42,624
State:
$71,192
Salary/wage: $36,269 (reported on 87.3% of returns)
Here:
$36,269
State:
$59,229
(% of AGI for various income ranges: 74.5% for AGIs below $25k, 81.1% for AGIs $25k-50k, 80.5% for AGIs $50k-75k, 72.2% for AGIs $75k-100k, 63.5% for AGIs $100k-200k)
Taxable interest for individuals: $983 (reported on 32.4% of returns)
This zip code:
$983
Virginia:
$1,600
(% of AGI for various income ranges: 1.9% for AGIs below $25k, 0.6% for AGIs $25k-50k, 1.2% for AGIs $50k-75k, 0.3% for AGIs $75k-100k, 0.2% for AGIs $100k-200k)
Ordinary dividends: $1,400 (reported on 14.1% of returns)
Here:
$1,400
State:
$6,959
(% of AGI for various income ranges: 0.8% for AGIs below $25k, 0.7% for AGIs $50k-75k, 1.2% for AGIs $75k-100k)
Net capital gain/loss in AGI: +$2,357 (reported on 9.9% of returns)
Here:
+$2,357
State:
+$16,672
(% of AGI for various income ranges: 0.4% for AGIs below $25k, 1.1% for AGIs $25k-50k, 1.4% for AGIs $75k-100k)
Profit/loss from business: +$4,275 (reported on 11.3% of returns)
Here:
+$4,275
State:
+$14,116
Taxable individual retirement arrangement distribution: $8,533 (reported on 8.5% of returns)
24594:
$8,533
Virginia:
$16,667
Total itemized deductions: $17,322 (22% of AGI, reported on 25.4% of returns)
Here:
$17,322
State:
$26,596
Here:
22.3% of AGI
State:
20.1% of AGI
(% of AGI for various income ranges: 9.9% for AGIs $25k-50k, 10.5% for AGIs $50k-75k, 14.7% for AGIs $75k-100k, 12.8% for AGIs $100k-200k)
Charity contributions: $3,893 (reported on 21.1% of returns)
Here:
$3,893
State:
$4,443
(% of AGI for various income ranges: 2.1% for AGIs $25k-50k, 1.9% for AGIs $50k-75k, 2.7% for AGIs $75k-100k, 2.3% for AGIs $100k-200k)
Taxes paid: $5,044 (reported on 25.4% of returns)
24594:
$5,044
State:
$9,951
(% of AGI for various income ranges: 1.8% for AGIs $25k-50k, 2.4% for AGIs $50k-75k, 4.1% for AGIs $75k-100k, 5.5% for AGIs $100k-200k)
Earned income credit: $2,333 (reported on 25.4% of returns)
Here:
$2,333
State:
$2,211
(% of AGI for various income ranges: 9.1% for AGIs below $25k, 1.0% for AGIs $25k-50k)
Percentage of individuals using paid preparers for their 2012 taxes: 67.6%
Here:
68%
State:
46%
(% for various income ranges: 60.0% for AGIs below $25k, 72.2% for AGIs $25k-50k, 66.7% for AGIs $50k-75k, 83.3% for AGIs $75k-100k, 80.0% for AGIs $100k-200k)
Averages for the 2004 tax year for zip code 24594, filed in 2005:
Average Adjusted Gross Income (AGI) in 2004: $33,359 (Individual Income Tax Returns)
Here:
$33,359
State:
$56,704
Salary/wage: $29,727 (reported on 87.6% of returns)
Here:
$29,727
State:
$48,441
(% of AGI for various income ranges: 100.0% for AGIs below $10k, 80.3% for AGIs $10k-25k, 83.5% for AGIs $25k-50k, 84.9% for AGIs $50k-75k, 75.9% for AGIs $75k-100k, 52.9% for AGIs over 100k)
Taxable interest for individuals: $1,394 (reported on 37.5% of returns)
This zip code:
$1,394
Virginia:
$1,688
(% of AGI for various income ranges: 2.5% for AGIs below $10k, 3.5% for AGIs $10k-25k, 1.5% for AGIs $25k-50k, 0.5% for AGIs $50k-75k, 0.4% for AGIs $75k-100k, 2.3% for AGIs over 100k)
Taxable dividends: $1,567 (reported on 12.8% of returns)
Here:
$1,567
State:
$4,028
(% of AGI for various income ranges: 2.2% for AGIs below $10k, 0.3% for AGIs $10k-25k, 0.1% for AGIs $25k-50k, 0.2% for AGIs $50k-75k, 0.1% for AGIs $75k-100k, 2.6% for AGIs over 100k)
Net capital gain/loss: +$4,819 (reported on 10.9% of returns)
Here:
+$4,819
State:
+$14,375
(% of AGI for various income ranges: -1.2% for AGIs below $10k, 1.5% for AGIs $10k-25k, 1.4% for AGIs $25k-50k, 0.9% for AGIs $50k-75k, 5.1% for AGIs over 100k)
Profit/loss from business: +$4,592 (reported on 10.0% of returns)
Here:
+$4,592
State:
+$13,342
(% of AGI for various income ranges: 9.1% for AGIs below $10k, 3.5% for AGIs $10k-25k, 2.5% for AGIs $25k-50k, -0.5% for AGIs $50k-75k)
IRA payment deduction: $2,100 (reported on 1.3% of returns)
24594:
$2,100
Virginia:
$2,943
Total itemized deductions: $14,807 (26% of AGI, reported on 22.6% of returns)
Here:
$14,807
State:
$21,492
Here:
26.0% of AGI
State:
21.0% of AGI
(% of AGI for various income ranges: 9.4% for AGIs $10k-25k, 9.8% for AGIs $25k-50k, 9.8% for AGIs $50k-75k, 9.8% for AGIs $75k-100k, 13.2% for AGIs over 100k)
Charity contributions deductions: $3,980 (7% of AGI, reported on 19.8% of returns)
Here:
$3,980
State:
$3,794
Here:
6.5% of AGI
State:
3.5% of AGI
(% of AGI for various income ranges: 1.0% for AGIs $10k-25k, 2.3% for AGIs $25k-50k, 2.4% for AGIs $50k-75k, 2.4% for AGIs $75k-100k, 4.3% for AGIs over 100k)
Total tax: $3,908 (reported on 68.7% of returns)
24594:
$3,908
State:
$9,537
(% of AGI for various income ranges: 2.0% for AGIs below $10k, 3.3% for AGIs $10k-25k, 5.4% for AGIs $25k-50k, 8.2% for AGIs $50k-75k, 11.4% for AGIs $75k-100k, 15.8% for AGIs over 100k)
Earned income credit: $1,779 (reported on 23.9% of returns)
Here:
$1,779
State:
$1,734
Percentage of individuals using paid preparers for their 2004 taxes: 72.0%
Here:
72%
State:
52%
(% for various income ranges: 62.4% for AGIs below $10k, 70.8% for AGIs $10k-25k, 74.9% for AGIs $25k-50k, 78.2% for AGIs $50k-75k, 70.0% for AGIs $75k-100k, 92.6% for AGIs over 100k)
Household received Food Stamps/SNAP in the past 12 months: 80 Household did not receive Food Stamps/SNAP in the past 12 months: 658
Women who had a birth in the past 12 months: 8 (8 now married, 0 unmarried) Women who did not have a birth in the past 12 months: 409 (149 now married, 260 unmarried)
Housing units in zip code 24594 with a mortgage: 293 (23 second mortgage, 10 both second mortgage and home equity loan) Median monthly owner costs for units with a mortgage: $991 Median monthly owner costs for units without a mortgage: $373
Residents with income below the poverty level in 2022:
This zip code:
13.3%
Whole state:
10.6%
Residents with income below 50% of the poverty level in 2022:
This zip code:
12.7%
Whole state:
5.2%
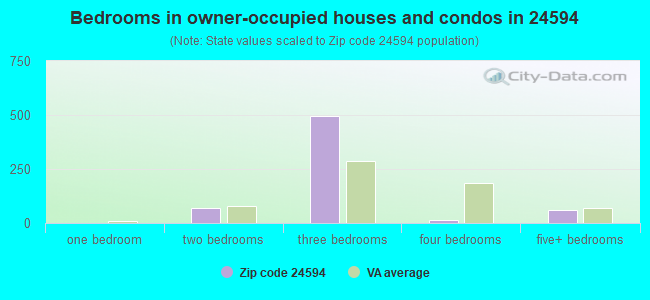
Median number of rooms in houses and condos:
Here:
5.8
State:
7.0
Median number of rooms in apartments:
Here:
6.4
State:
4.3
Notable locations in this zip code not listed on our city pages
Churches in zip code 24594 include: Arbor Church (A), Victory Church (B), White Oak Church (C), White Stone Church (D), Hackberry Church (E), Kerns Memorial Church (F), Laurel Grove Church (G), Mercy Seat Church (H), Old Mill Church (I). Display/hide their locations on the map
Size of family households: 269 2-persons, 75 3-persons, 84 4-persons, 43 5-persons, 16 7-or-more-persons
Size of nonfamily households: 237 1-person, 9 2-persons
191 married couples with children.
116 single-parent households (116 men).
100.5% of residents of 24594 zip code speak English at home.
Foreign born population: 0 (0.0%)
:
0.0%
Whole state:
12.7%
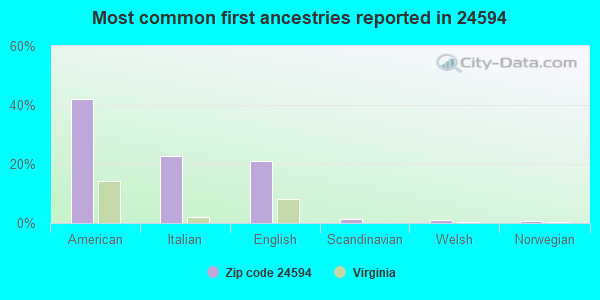
42%American
23%Italian
21%English
1%Scandinavian
1%Welsh
1%Norwegian
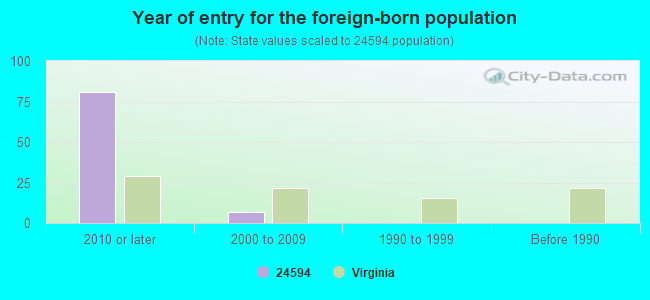
Year of entry for the foreign-born population
812010 or later
72000 to 2009
01990 to 1999
0Before 1990
Housing units lacking complete plumbing facilities: 3.2% Housing units lacking complete kitchen facilities: 4.3%
71.0%Electricity
9.1%Bottled, tank, or LP gas
9.1%Fuel oil, kerosene, etc.
7.8%Wood
2.4%No fuel used
1.1%Utility gas
Population in 1990: 1,018. Population change in the 1990s: +723 (+71.0%).
Place of birth for U.S.-born residents:
This state: 1,509
Northeast: 115
Midwest: 31
South: 207
69% of the 24594 zip code residents lived in the same house 5 years ago. Out of people who lived in different houses, 51% lived in this county. Out of people who lived in different counties, 50% lived in Virginia.
98% of the 24594 zip code residents lived in the same house 1 year ago. Out of people who lived in different houses, 114% moved from this county.
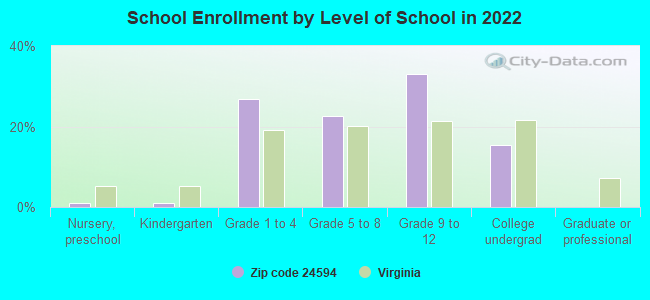
Private vs. public school enrollment:
Students in private schools in grades 1 to 8 (elementary and middle school): 114
Here:
40.4%
Virginia:
13.2%
Students in private schools in grades 9 to 12 (high school): 144
Here:
82.0%
Virginia:
10.2%
Students in private undergraduate colleges:
Here:
0.0%
Virginia:
18.7%
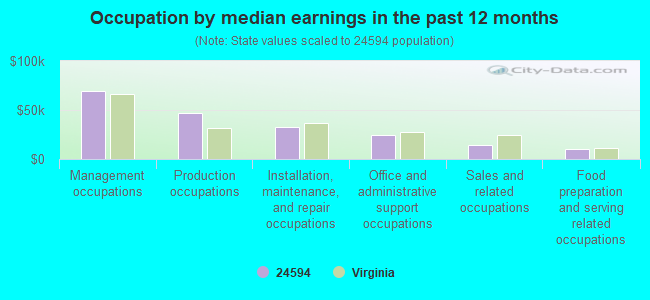
Occupation by median earnings in the past 12 months ($)
68,949Management occupations
46,980Production occupations
32,202Installation, maintenance, and repair occupations
24,900Office and administrative support occupations
14,313Sales and related occupations
10,333Food preparation and serving related occupations
Top industries in this zip code by the number of employees in 2005:
Wholesale Trade: Construction and Mining (except Oil Well) Machinery and Equipment Merchant Wholesalers (20-49 employees: 1 establishment, 1-4 employees: 1 establishment)
Wholesale Trade: Automobile and Other Motor Vehicle Merchant Wholesalers (20-49: 1)
Construction: Highway, Street, and Bridge Construction (10-19: 1)
Construction: Masonry Contractors (5-9: 1)
Other Services (except Public Administration): Religious Organizations (1-4: 3)
Construction: Painting and Wall Covering Contractors (1-4: 1)
Administrative and Support and Waste Management and Remediation Services: Landscaping Services (1-4: 1)
Construction: Plumbing, Heating, and Air-Conditioning Contractors (1-4: 1)
Fatal accident statistics in 2010:
Fatal accident count: 1
Vehicles involved in fatal accidents: 1
Fatal accidents caused by drunken drivers: 1
Fatalities: 1
Persons involved in fatal accidents: 2
Pedestrians involved in fatal accidents: 0
Home Mortgage Disclosure Act Aggregated Statistics For Year 2009 (Based on 2 partial tracts)
A) FHA, FSA/RHS & VA Home Purchase Loans
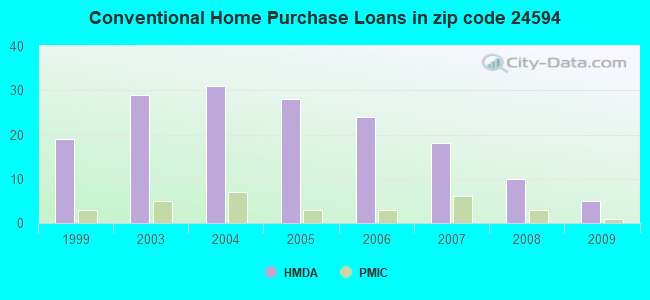
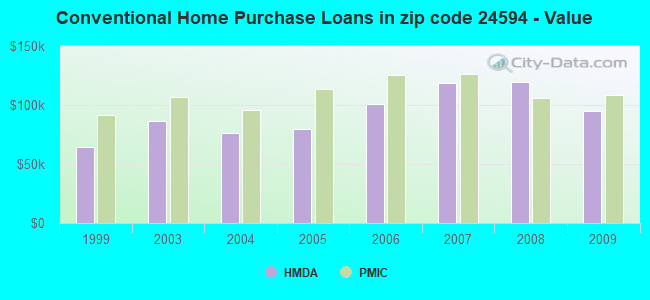
B) Conventional Home Purchase Loans
C) Refinancings
D) Home Improvement Loans
F) Non-occupant Loans on < 5 Family Dwellings (A B C & D)
G) Loans On Manufactured Home Dwelling (A B C & D)
Number
Average Value
Number
Average Value
Number
Average Value
Number
Average Value
Number
Average Value
Number
Average Value
LOANS ORIGINATED
9
$125,780
5
$94,934
39
$119,120
4
$66,615
2
$43,690
5
$62,354
APPLICATIONS APPROVED, NOT ACCEPTED
0
$0
0
$0
4
$103,475
1
$3,960
0
$0
1
$23,730
APPLICATIONS DENIED
4
$115,252
1
$69,400
16
$95,137
2
$37,580
1
$57,900
1
$85,940
APPLICATIONS WITHDRAWN
3
$92,537
1
$89,540
10
$123,487
0
$0
1
$53,220
2
$106,980
FILES CLOSED FOR INCOMPLETENESS
0
$0
0
$0
2
$103,565
0
$0
0
$0
1
$44,950
Aggregated Statistics For Year 2008 (Based on 2 partial tracts)
A) FHA, FSA/RHS & VA Home Purchase Loans
B) Conventional Home Purchase Loans
C) Refinancings
D) Home Improvement Loans
F) Non-occupant Loans on < 5 Family Dwellings (A B C & D)
G) Loans On Manufactured Home Dwelling (A B C & D)
Number
Average Value
Number
Average Value
Number
Average Value
Number
Average Value
Number
Average Value
Number
Average Value
LOANS ORIGINATED
10
$110,865
10
$119,459
28
$103,282
3
$23,493
2
$87,565
10
$66,346
APPLICATIONS APPROVED, NOT ACCEPTED
1
$138,450
1
$90,620
4
$106,352
0
$0
0
$0
1
$107,160
APPLICATIONS DENIED
2
$82,170
2
$61,490
28
$96,013
7
$34,779
1
$79,470
8
$84,056
APPLICATIONS WITHDRAWN
2
$125,500
1
$103,210
7
$143,994
0
$0
0
$0
1
$48,550
FILES CLOSED FOR INCOMPLETENESS
1
$103,560
0
$0
1
$160,020
0
$0
0
$0
0
$0
Aggregated Statistics For Year 2007 (Based on 2 partial tracts)
A) FHA, FSA/RHS & VA Home Purchase Loans
B) Conventional Home Purchase Loans
C) Refinancings
D) Home Improvement Loans
F) Non-occupant Loans on < 5 Family Dwellings (A B C & D)
G) Loans On Manufactured Home Dwelling (A B C & D)
Number
Average Value
Number
Average Value
Number
Average Value
Number
Average Value
Number
Average Value
Number
Average Value
LOANS ORIGINATED
8
$109,858
18
$118,728
38
$89,777
9
$46,069
5
$101,480
10
$70,086
APPLICATIONS APPROVED, NOT ACCEPTED
0
$0
4
$66,345
9
$84,826
0
$0
1
$37,040
3
$50,463
APPLICATIONS DENIED
0
$0
6
$108,718
52
$104,070
6
$28,048
2
$44,410
9
$67,804
APPLICATIONS WITHDRAWN
0
$0
1
$55,020
32
$99,901
1
$65,810
1
$145,280
6
$70,242
FILES CLOSED FOR INCOMPLETENESS
1
$75,160
1
$135,210
4
$145,458
0
$0
0
$0
0
$0
Aggregated Statistics For Year 2006 (Based on 2 partial tracts)
A) FHA, FSA/RHS & VA Home Purchase Loans
B) Conventional Home Purchase Loans
C) Refinancings
D) Home Improvement Loans
F) Non-occupant Loans on < 5 Family Dwellings (A B C & D)
G) Loans On Manufactured Home Dwelling (A B C & D)
Number
Average Value
Number
Average Value
Number
Average Value
Number
Average Value
Number
Average Value
Number
Average Value
LOANS ORIGINATED
8
$97,271
24
$100,568
43
$82,884
7
$43,820
4
$78,212
14
$73,538
APPLICATIONS APPROVED, NOT ACCEPTED
0
$0
6
$72,758
9
$56,937
1
$50,700
1
$52,500
4
$81,270
APPLICATIONS DENIED
3
$61,490
11
$83,231
63
$89,683
7
$40,480
1
$53,940
23
$72,045
APPLICATIONS WITHDRAWN
1
$69,040
2
$125,320
49
$89,643
1
$28,770
0
$0
8
$65,493
FILES CLOSED FOR INCOMPLETENESS
0
$0
1
$135,930
7
$95,807
0
$0
0
$0
1
$119,390
Aggregated Statistics For Year 2005 (Based on 2 partial tracts)
A) FHA, FSA/RHS & VA Home Purchase Loans
B) Conventional Home Purchase Loans
C) Refinancings
D) Home Improvement Loans
F) Non-occupant Loans on < 5 Family Dwellings (A B C & D)
G) Loans On Manufactured Home Dwelling (A B C & D)
Number
Average Value
Number
Average Value
Number
Average Value
Number
Average Value
Number
Average Value
Number
Average Value
LOANS ORIGINATED
11
$109,122
28
$79,767
50
$81,636
7
$38,117
5
$57,752
14
$62,673
APPLICATIONS APPROVED, NOT ACCEPTED
1
$52,860
8
$64,009
15
$65,663
2
$70,840
2
$49,805
5
$61,996
APPLICATIONS DENIED
1
$75,880
9
$68,763
76
$81,979
11
$41,681
3
$53,100
17
$55,632
APPLICATIONS WITHDRAWN
1
$81,630
4
$86,662
37
$87,179
4
$76,505
1
$113,270
7
$68,786
FILES CLOSED FOR INCOMPLETENESS
0
$0
1
$180,520
5
$111,044
0
$0
0
$0
1
$119,750
Aggregated Statistics For Year 2004 (Based on 2 partial tracts)
A) FHA, FSA/RHS & VA Home Purchase Loans
B) Conventional Home Purchase Loans
C) Refinancings
D) Home Improvement Loans
F) Non-occupant Loans on < 5 Family Dwellings (A B C & D)
G) Loans On Manufactured Home Dwelling (A B C & D)
Number
Average Value
Number
Average Value
Number
Average Value
Number
Average Value
Number
Average Value
Number
Average Value
LOANS ORIGINATED
10
$96,553
31
$76,537
62
$84,877
9
$32,364
5
$49,984
17
$62,042
APPLICATIONS APPROVED, NOT ACCEPTED
1
$135,570
7
$57,484
17
$77,145
1
$24,450
0
$0
7
$48,237
APPLICATIONS DENIED
1
$87,020
11
$65,415
68
$76,198
5
$25,892
3
$60,653
14
$63,264
APPLICATIONS WITHDRAWN
1
$147,440
2
$127,120
22
$83,117
0
$0
0
$0
3
$78,873
FILES CLOSED FOR INCOMPLETENESS
0
$0
1
$80,550
2
$83,605
1
$35,240
0
$0
0
$0
Aggregated Statistics For Year 2003 (Based on 2 partial tracts)
A) FHA, FSA/RHS & VA Home Purchase Loans
B) Conventional Home Purchase Loans
C) Refinancings
D) Home Improvement Loans
F) Non-occupant Loans on < 5 Family Dwellings (A B C & D)
Number
Average Value
Number
Average Value
Number
Average Value
Number
Average Value
Number
Average Value
LOANS ORIGINATED
8
$99,385
29
$86,155
101
$85,816
6
$24,453
5
$79,760
APPLICATIONS APPROVED, NOT ACCEPTED
1
$79,110
7
$54,249
20
$79,778
1
$20,860
1
$130,530
APPLICATIONS DENIED
1
$71,560
14
$67,219
48
$77,164
2
$51,960
2
$86,485
APPLICATIONS WITHDRAWN
1
$121,190
4
$119,208
23
$80,175
1
$25,170
0
$0
FILES CLOSED FOR INCOMPLETENESS
0
$0
0
$0
5
$85,154
0
$0
0
$0
Aggregated Statistics For Year 1999 (Based on 1 partial tract)
A) FHA, FSA/RHS & VA Home Purchase Loans
B) Conventional Home Purchase Loans
C) Refinancings
D) Home Improvement Loans
F) Non-occupant Loans on < 5 Family Dwellings (A B C & D)
Detailed PMIC statistics for the following Tracts:0108.00
2003 - 2018 National Fire Incident Reporting System (NFIRS) incidents
According to the data from the years 2003 - 2018 the average number of fire incidents per year is 15. The highest number of fires - 36 took place in 2008, and the least - 1 in 2003. The data has an increasing trend.
When looking into fire subcategories, the most incidents belonged to: Outside Fires (46.7%), and Structure Fires (44.3%).
Fire incident types reported to NFIRS in Zip Code 24594


 Nearest zip codes: 24586, 24566, 27305, 24597, 24520, 27343.
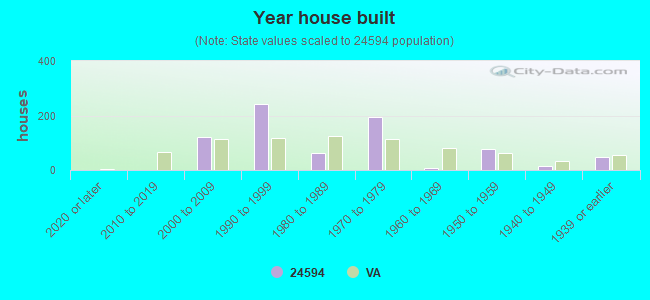


 According to the data from the years 2003 - 2018 the average number of fire incidents per year is 15. The highest number of fires - 36 took place in 2008, and the least - 1 in 2003. The data has an increasing trend.
 When looking into fire subcategories, the most incidents belonged to: Outside Fires (46.7%), and Structure Fires (44.3%).