Estimated zip code population in 2022: 4,549 Zip code population in 2010: 5,562 Zip code population in 2000: 5,229
Houses and condos: 2,304 Renter-occupied apartments: 517
% of renters here:
27%
State:
33%
March 2022 cost of living index in zip code 24586: 84.6 (less than average, U.S. average is 100)
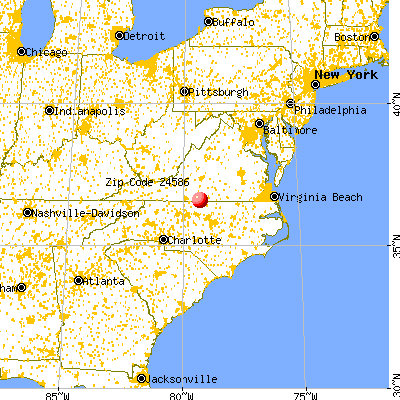
Land area: 53.1 sq. mi. Water area: 0.2 sq. mi.
Population density: 86 people per square mile
(very low).
OSM Map
General Map
Google Map
MSN Map
OSM Map
General Map
Google Map
MSN Map
OSM Map
General Map
Google Map
MSN Map
OSM Map
General Map
Google Map
MSN Map
Please wait while loading the map...
Real estate property taxes paid for housing units in 2022:
This zip code:
0.5% ($842)
Virginia:
0.7% ($2,617)
Median real estate property taxes paid for housing units with mortgages in 2022: $807 (0.5%) Median real estate property taxes paid for housing units with no mortgage in 2022: $882 (0.6%)
Business Search- 14 Million verified businesses
Males: 2,278
(50.1%)
Females: 2,271
(49.9%)
For population 25 years and over in 24586:
High school or higher: 88.8%
Bachelor's degree or higher: 15.2%
Graduate or professional degree: 2.1%
Unemployed: 2.2%
Mean travel time to work (commute): 21.8 minutes
For population 15 years and over in 24586:
Never married: 21.5%
Now married: 59.0%
Separated: 2.8%
Widowed: 8.3%
Divorced: 8.4%
Zip code 24586 compared to state average:
Median household income below state average.
Median house value significantly below state average.
Hispanic race population percentage significantly below state average.
Median age above state average.
Foreign-born population percentage significantly below state average.
Length of stay since moving in significantly above state average.
Percentage of population with a bachelor's degree or higher significantly below state average.
Estimated median house/condo value in 2022: $160,680
24586:
$160,680
Virginia:
$365,700
According to our research of Virginia and other state lists, there were 16 registered sex offenders living in 24586 zip code as of May 28, 2024. The ratio of all residents to sex offenders in zip code 24586 is 363 to 1. The ratio of registered sex offenders to all residents in this zip code is near the state average.
Median resident age:
This zip code:
45.0 years
Virginia median age:
39.0 years
Average household size:
This zip code:
2.4 people
Virginia:
2.5 people
Averages for the 2020 tax year for zip code 24586, filed in 2021:
Average Adjusted Gross Income (AGI) in 2020: $49,321 (Individual Income Tax Returns)
Here:
$49,321
State:
$86,446
Salary/wage: $43,120 (reported on 84.9% of returns)
Here:
$43,120
State:
$71,185
(% of AGI for various income ranges: 1079.6% for AGIs below $25k, 3604.9% for AGIs $25k-50k, 6261.7% for AGIs $50k-75k, 8721.2% for AGIs $75k-100k, 14227.4% for AGIs $100k-200k)
Taxable interest for individuals: $753 (reported on 25.4% of returns)
This zip code:
$753
Virginia:
$1,805
(% of AGI for various income ranges: 12.5% for AGIs below $25k, 11.6% for AGIs $25k-50k, 30.7% for AGIs $50k-75k, 40.0% for AGIs $75k-100k, 89.5% for AGIs $100k-200k)
Ordinary dividends: $3,116 (reported on 12.3% of returns)
Here:
$3,116
State:
$8,327
(% of AGI for various income ranges: 16.2% for AGIs below $25k, 17.1% for AGIs $25k-50k, 46.6% for AGIs $50k-75k, 97.1% for AGIs $75k-100k, 238.9% for AGIs $100k-200k)
Net capital gain/loss in AGI: +$5,088 (reported on 10.3% of returns)
Here:
+$5,088
State:
+$24,644
(% of AGI for various income ranges: 5.3% for AGIs below $25k, 18.4% for AGIs $25k-50k, 40.7% for AGIs $50k-75k, 114.7% for AGIs $75k-100k, 457.9% for AGIs $100k-200k)
Profit/loss from business: +$4,777 (reported on 12.3% of returns)
Here:
+$4,777
State:
+$12,836
(% of AGI for various income ranges: 86.3% for AGIs below $25k, 24.4% for AGIs $25k-50k, 55.9% for AGIs $50k-75k, 98.8% for AGIs $75k-100k, 203.7% for AGIs $100k-200k)
Taxable individual retirement arrangement distribution: $15,310 (reported on 8.3% of returns)
24586:
$15,310
Virginia:
$21,535
(% of AGI for various income ranges: 43.3% for AGIs below $25k, 93.3% for AGIs $25k-50k, 109.7% for AGIs $50k-75k, 430.6% for AGIs $75k-100k, 703.2% for AGIs $100k-200k)
Total itemized deductions: $27,200 (reported on 5.2% of returns)
Here:
$27,200
State:
$33,287
(% of AGI for various income ranges: 427.6% for AGIs $50k-75k, 406.5% for AGIs $75k-100k, 844.7% for AGIs $100k-200k)
Charity contributions: $12,900 (reported on 4.8% of returns)
Here:
$12,900
State:
$10,381
(% of AGI for various income ranges: 169.0% for AGIs $50k-75k, 185.3% for AGIs $75k-100k, 391.1% for AGIs $100k-200k)
Taxes paid: $6,238 (reported on 5.2% of returns)
24586:
$6,238
State:
$8,284
(% of AGI for various income ranges: 8.5% for AGIs below $25k, 46.6% for AGIs $50k-75k, 104.7% for AGIs $75k-100k, 229.5% for AGIs $100k-200k)
Earned income credit: $2,288 (reported on 19.4% of returns)
Here:
$2,288
State:
$2,214
(% of AGI for various income ranges: 99.3% for AGIs below $25k, 72.0% for AGIs $25k-50k)
Percentage of individuals using paid preparers for their 2020 taxes: 95.2%
Here:
95%
State:
92%
(% for various income ranges: 95.7% for AGIs below $25k, 95.6% for AGIs $25k-50k, 94.7% for AGIs $50k-75k, 91.3% for AGIs $75k-100k, 96.4% for AGIs $100k-200k, 100.0% for AGIs over 200k)
Averages for the 2012 tax year for zip code 24586, filed in 2013:
Average Adjusted Gross Income (AGI) in 2012: $42,306 (Individual Income Tax Returns)
Here:
$42,306
State:
$71,192
Salary/wage: $38,400 (reported on 87.6% of returns)
Here:
$38,400
State:
$59,229
(% of AGI for various income ranges: 80.4% for AGIs below $25k, 81.8% for AGIs $25k-50k, 83.0% for AGIs $50k-75k, 80.1% for AGIs $75k-100k, 72.5% for AGIs $100k-200k)
Taxable interest for individuals: $774 (reported on 30.9% of returns)
This zip code:
$774
Virginia:
$1,600
(% of AGI for various income ranges: 1.5% for AGIs below $25k, 0.4% for AGIs $25k-50k, 0.5% for AGIs $50k-75k, 0.5% for AGIs $75k-100k, 0.3% for AGIs $100k-200k)
Ordinary dividends: $1,819 (reported on 13.3% of returns)
Here:
$1,819
State:
$6,959
(% of AGI for various income ranges: 1.0% for AGIs below $25k, 0.5% for AGIs $25k-50k, 0.5% for AGIs $50k-75k, 0.5% for AGIs $75k-100k, 0.7% for AGIs $100k-200k)
Net capital gain/loss in AGI: +$3,033 (reported on 9.0% of returns)
Here:
+$3,033
State:
+$16,672
(% of AGI for various income ranges: 0.1% for AGIs below $25k, 0.1% for AGIs $25k-50k, 0.3% for AGIs $50k-75k, 0.1% for AGIs $75k-100k, 2.2% for AGIs $100k-200k)
Profit/loss from business: +$6,495 (reported on 9.4% of returns)
Here:
+$6,495
State:
+$14,116
(% of AGI for various income ranges: 2.6% for AGIs below $25k, 1.8% for AGIs $25k-50k, 1.5% for AGIs $50k-75k, 1.9% for AGIs $75k-100k)
Taxable individual retirement arrangement distribution: $10,618 (reported on 9.4% of returns)
24586:
$10,618
Virginia:
$16,667
(% of AGI for various income ranges: 3.6% for AGIs below $25k, 2.3% for AGIs $25k-50k, 1.6% for AGIs $50k-75k, 5.5% for AGIs $75k-100k)
Total itemized deductions: $17,402 (22% of AGI, reported on 22.3% of returns)
Here:
$17,402
State:
$26,596
Here:
22.4% of AGI
State:
20.1% of AGI
(% of AGI for various income ranges: 5.2% for AGIs below $25k, 7.2% for AGIs $25k-50k, 8.2% for AGIs $50k-75k, 11.9% for AGIs $75k-100k, 12.2% for AGIs $100k-200k)
Charity contributions: $5,402 (reported on 18.9% of returns)
Here:
$5,402
State:
$4,443
(% of AGI for various income ranges: 0.9% for AGIs below $25k, 1.7% for AGIs $25k-50k, 1.9% for AGIs $50k-75k, 3.4% for AGIs $75k-100k, 3.7% for AGIs $100k-200k)
Taxes paid: $5,061 (reported on 21.9% of returns)
24586:
$5,061
State:
$9,951
(% of AGI for various income ranges: 0.5% for AGIs below $25k, 1.4% for AGIs $25k-50k, 2.0% for AGIs $50k-75k, 3.4% for AGIs $75k-100k, 5.0% for AGIs $100k-200k)
Earned income credit: $2,091 (reported on 24.0% of returns)
Here:
$2,091
State:
$2,211
(% of AGI for various income ranges: 6.9% for AGIs below $25k, 1.3% for AGIs $25k-50k)
Percentage of individuals using paid preparers for their 2012 taxes: 63.5%
Here:
64%
State:
46%
(% for various income ranges: 56.2% for AGIs below $25k, 64.1% for AGIs $25k-50k, 72.2% for AGIs $50k-75k, 66.7% for AGIs $75k-100k, 81.2% for AGIs $100k-200k)
Averages for the 2004 tax year for zip code 24586, filed in 2005:
Average Adjusted Gross Income (AGI) in 2004: $35,353 (Individual Income Tax Returns)
Here:
$35,353
State:
$56,704
Salary/wage: $32,765 (reported on 89.5% of returns)
Here:
$32,765
State:
$48,441
(% of AGI for various income ranges: 107.8% for AGIs below $10k, 81.8% for AGIs $10k-25k, 87.3% for AGIs $25k-50k, 85.7% for AGIs $50k-75k, 86.7% for AGIs $75k-100k, 58.8% for AGIs over 100k)
Taxable interest for individuals: $979 (reported on 37.7% of returns)
This zip code:
$979
Virginia:
$1,688
(% of AGI for various income ranges: 3.1% for AGIs below $10k, 1.9% for AGIs $10k-25k, 1.1% for AGIs $25k-50k, 0.8% for AGIs $50k-75k, 0.6% for AGIs $75k-100k, 0.6% for AGIs over 100k)
Taxable dividends: $1,092 (reported on 14.6% of returns)
Here:
$1,092
State:
$4,028
(% of AGI for various income ranges: 1.6% for AGIs below $10k, 0.8% for AGIs $10k-25k, 0.2% for AGIs $25k-50k, 0.5% for AGIs $50k-75k, 0.5% for AGIs $75k-100k, 0.3% for AGIs over 100k)
Net capital gain/loss: +$3,026 (reported on 9.8% of returns)
Here:
+$3,026
State:
+$14,375
(% of AGI for various income ranges: -1.4% for AGIs below $10k, 0.2% for AGIs $10k-25k, 0.5% for AGIs $25k-50k, 0.4% for AGIs $50k-75k, 0.7% for AGIs $75k-100k, 4.2% for AGIs over 100k)
Profit/loss from business: +$5,050 (reported on 10.9% of returns)
Here:
+$5,050
State:
+$13,342
(% of AGI for various income ranges: 4.1% for AGIs below $10k, 3.7% for AGIs $10k-25k, 0.3% for AGIs $25k-50k, 2.6% for AGIs $50k-75k, 0.9% for AGIs $75k-100k)
Profit/loss from farming: +$891 (reported on 2.3% of returns)
Here:
+$891
State:
-$5,267
IRA payment deduction: $3,209 (reported on 1.8% of returns)
24586:
$3,209
Virginia:
$2,943
Total itemized deductions: $14,506 (23% of AGI, reported on 25.3% of returns)
Here:
$14,506
State:
$21,492
Here:
22.5% of AGI
State:
21.0% of AGI
(% of AGI for various income ranges: 5.5% for AGIs $10k-25k, 8.8% for AGIs $25k-50k, 12.3% for AGIs $50k-75k, 14.1% for AGIs $75k-100k, 12.6% for AGIs over 100k)
Charity contributions deductions: $3,914 (6% of AGI, reported on 23.2% of returns)
Here:
$3,914
State:
$3,794
Here:
5.9% of AGI
State:
3.5% of AGI
(% of AGI for various income ranges: 0.9% for AGIs $10k-25k, 1.7% for AGIs $25k-50k, 2.7% for AGIs $50k-75k, 4.1% for AGIs $75k-100k, 4.6% for AGIs over 100k)
Total tax: $3,969 (reported on 72.5% of returns)
24586:
$3,969
State:
$9,537
(% of AGI for various income ranges: 2.1% for AGIs below $10k, 3.4% for AGIs $10k-25k, 6.0% for AGIs $25k-50k, 8.5% for AGIs $50k-75k, 10.1% for AGIs $75k-100k, 16.5% for AGIs over 100k)
Earned income credit: $1,737 (reported on 20.5% of returns)
Here:
$1,737
State:
$1,734
Percentage of individuals using paid preparers for their 2004 taxes: 69.3%
Here:
69%
State:
52%
(% for various income ranges: 58.0% for AGIs below $10k, 66.6% for AGIs $10k-25k, 72.3% for AGIs $25k-50k, 76.3% for AGIs $50k-75k, 76.3% for AGIs $75k-100k, 84.8% for AGIs over 100k)
Likely homosexual households (counted as self-reported same-sex unmarried-partner households)
Lesbian couples: 0.0% of all households
Gay men: 2.2% of all households
Household received Food Stamps/SNAP in the past 12 months: 135 Household did not receive Food Stamps/SNAP in the past 12 months: 1,782
Women who had a birth in the past 12 months: 57 (20 now married, 35 unmarried) Women who did not have a birth in the past 12 months: 1,012 (532 now married, 476 unmarried)
Housing units in zip code 24586 with a mortgage: 745 (6 second mortgage) Median monthly owner costs for units with a mortgage: $1,038 Median monthly owner costs for units without a mortgage: $380
Residents with income below the poverty level in 2022:
This zip code:
12.2%
Whole state:
10.6%
Residents with income below 50% of the poverty level in 2022:
This zip code:
11.6%
Whole state:
5.2%
Median number of rooms in houses and condos:
Here:
5.8
State:
7.0
Median number of rooms in apartments:
Here:
5.9
State:
4.3
Notable locations in this zip code not listed on our city pages
Notable locations in zip code 24586: Ringgold Golf Club (A), Ringgold Volunteer Fire Department (B), Kentuck Volunteer Fire Department (C). Display/hide their locations on the map
Churches in zip code 24586 include: Rock Springs Church (A), Bethel Church (B), Sandy Creek Church (C), Cane Creek Church (D), Sunny Church (E), Glen Hill Church (F), White Rock Church (G), Williamson Memorial Church (H), Mount Zion Church (I). Display/hide their locations on the map
Streams, rivers, and creeks: Turkeyfoot Branch (A), Tom Fork (B), Oliver Creek (C), Hances Branch (D), Grassy Branch (E), Golden Branch (F). Display/hide their locations on the map
In group quarters: 8 (-1 institutionalized population)
Size of family households: 692 2-persons, 240 3-persons, 163 4-persons, 97 5-persons, 97 6-persons
Size of nonfamily households: 621 1-person, 18 2-persons
682 married couples with children.
209 single-parent households (75 men, 134 women).
96.3% of residents of 24586 zip code speak English at home.
2.7% of residents speak Spanish at home (41% very well, 39% well, 17% not well, 2% not at all).
0.5% of residents speak other Indo-European language at home (100% very well).
Foreign born population: 75 (1.7%) (5.6% of them are naturalized citizens)
This zip code:
1.7%
Whole state:
12.7%
88%Honduras
5%Chile
33%American
18%Irish
16%English
2%African
1%German
1%European
1%Welsh
Year of entry for the foreign-born population
62010 or later
392000 to 2009
341990 to 1999
3Before 1990
Public high school in in zip code 24586 not listed on the city page:
DAN RIVER HIGH(Students: 656, Location: 100 DAN RIVER WILDCAT CIR, Grades: 9-12)
Public elementary/middle schools in in zip code 24586 not listed on the city page:
DAN RIVER MIDDLE(Students: 478, Location: 5875 KENTUCK RD., Grades: 6-8)
Facilities with environmental interests located in this zip code:
DAN RIVER MIDDLE SCHOOL (100 DAN RIVER MIDDLE SCH LN in RINGGOLD, VA)
AIR MINOR (AIRS/AFS) (National Center for Education Statistics) - STATE ID-0711090 Business SIC classification: ELEMENTARY AND SECONDARY SCHOOLS Organizations: PITTSYLVANIA COUNTY PUBLIC SCHOOLS (SCHOOL DISTRICT)
DANVILLE CITY - DEPARTMENT OF UTILITIES (1865 KENTUCK CHURCH ROAD in RINGGOLD, VA)
AIR SYNTHETIC MINOR (AIRS/AFS) Business SIC classification: ELECTRIC SERVICES
Housing units lacking complete plumbing facilities: 9.0% Housing units lacking complete kitchen facilities: 6.7%
67.7%Electricity
19.4%Bottled, tank, or LP gas
5.4%Wood
5.2%Fuel oil, kerosene, etc.
2.5%Utility gas
Population in 1990: 4,728. Population change in the 1990s: +501 (+10.6%).
Place of birth for U.S.-born residents:
This state: 3,619
Northeast: 236
Midwest: 112
South: 458
68% of the 24586 zip code residents lived in the same house 5 years ago. Out of people who lived in different houses, 49% lived in this county. Out of people who lived in different counties, 50% lived in Virginia.
96% of the 24586 zip code residents lived in the same house 1 year ago. Out of people who lived in different houses, 14% moved from this county. Out of people who lived in different houses, 100% moved from different state.
Private vs. public school enrollment:
Students in private schools in grades 1 to 8 (elementary and middle school): 168
Here:
37.0%
Virginia:
13.2%
Students in private schools in grades 9 to 12 (high school): 54
Here:
17.1%
Virginia:
10.2%
Students in private undergraduate colleges: 40
Here:
18.3%
Virginia:
18.7%
Occupation by median earnings in the past 12 months ($)
147,889Architecture and engineering occupations
62,035Health diagnosing and treating practitioners and other technical occupations
61,472Transportation occupations
54,908Construction and extraction occupations
52,546Healthcare support occupations
48,890Education, training, and library occupations
Top industries in this zip code by the number of employees in 2005:
Administrative and Support and Waste Management and Remediation Services: Solid Waste Landfill (50-99 employees: 1 establishment)
Other Services (except Public Administration): Religious Organizations (10-19: 1, 5-9: 3, 1-4: 4)
Construction: New Single-Family Housing Construction (except Operative Builders) (20-49: 1, 1-4: 3)
Other Services (except Public Administration): Commercial and Industrial Machinery and Equipment (except Automotive and Electronic) Repair and Maintenance (10-19: 1, 5-9: 1)
Accommodation and Food Services: Full-Service Restaurants (10-19: 1, 1-4: 1)
Arts, Entertainment, and Recreation: Golf Courses and Country Clubs (10-19: 1)
People in group quarters in 2010:
2 people in workers' group living quarters and job corps centers
Fatal accident statistics in 2014:
Fatal accident count: 1
Vehicles involved in fatal accidents: 2
Fatal accidents caused by drunken drivers: 0
Fatalities: 1
Persons involved in fatal accidents: 4
Pedestrians involved in fatal accidents: 0
Fatal accident statistics in 2012:
Fatal accident count: 1
Vehicles involved in fatal accidents: 1
Fatal accidents caused by drunken drivers: 0
Fatalities: 1
Persons involved in fatal accidents: 1
Pedestrians involved in fatal accidents: 0
Home Mortgage Disclosure Act Aggregated Statistics For Year 2009 (Based on 6 partial tracts)
A) FHA, FSA/RHS & VA Home Purchase Loans
B) Conventional Home Purchase Loans
C) Refinancings
D) Home Improvement Loans
F) Non-occupant Loans on < 5 Family Dwellings (A B C & D)
G) Loans On Manufactured Home Dwelling (A B C & D)
Number
Average Value
Number
Average Value
Number
Average Value
Number
Average Value
Number
Average Value
Number
Average Value
LOANS ORIGINATED
32
$126,332
26
$97,747
127
$116,168
16
$53,378
8
$48,150
15
$61,755
APPLICATIONS APPROVED, NOT ACCEPTED
1
$171,800
1
$69,210
10
$127,420
2
$4,480
0
$0
2
$26,870
APPLICATIONS DENIED
10
$124,218
6
$112,825
59
$102,234
7
$31,394
4
$83,282
3
$64,863
APPLICATIONS WITHDRAWN
7
$108,163
3
$84,723
31
$119,463
0
$0
3
$57,310
5
$96,890
FILES CLOSED FOR INCOMPLETENESS
2
$105,430
1
$162,840
6
$101,888
2
$72,805
0
$0
2
$50,885
Aggregated Statistics For Year 2008 (Based on 6 partial tracts)
A) FHA, FSA/RHS & VA Home Purchase Loans
B) Conventional Home Purchase Loans
C) Refinancings
D) Home Improvement Loans
F) Non-occupant Loans on < 5 Family Dwellings (A B C & D)
G) Loans On Manufactured Home Dwelling (A B C & D)
Number
Average Value
Number
Average Value
Number
Average Value
Number
Average Value
Number
Average Value
Number
Average Value
LOANS ORIGINATED
34
$117,291
38
$112,482
98
$101,282
11
$40,724
8
$70,572
26
$65,654
APPLICATIONS APPROVED, NOT ACCEPTED
5
$112,654
2
$102,590
15
$127,215
1
$1,630
0
$0
3
$117,000
APPLICATIONS DENIED
4
$93,022
4
$69,615
99
$99,640
18
$43,634
4
$93,200
21
$80,856
APPLICATIONS WITHDRAWN
5
$129,092
3
$132,383
31
$119,451
1
$37,450
2
$189,475
3
$73,680
FILES CLOSED FOR INCOMPLETENESS
2
$117,245
1
$157,140
4
$114,688
0
$0
0
$0
1
$74,090
Aggregated Statistics For Year 2007 (Based on 6 partial tracts)
A) FHA, FSA/RHS & VA Home Purchase Loans
B) Conventional Home Purchase Loans
C) Refinancings
D) Home Improvement Loans
F) Non-occupant Loans on < 5 Family Dwellings (A B C & D)
G) Loans On Manufactured Home Dwelling (A B C & D)
Number
Average Value
Number
Average Value
Number
Average Value
Number
Average Value
Number
Average Value
Number
Average Value
LOANS ORIGINATED
28
$111,740
61
$116,361
116
$92,043
28
$46,746
18
$89,080
24
$68,913
APPLICATIONS APPROVED, NOT ACCEPTED
0
$0
11
$74,163
31
$94,214
3
$67,197
3
$27,953
7
$50,149
APPLICATIONS DENIED
3
$78,033
21
$92,373
165
$109,332
17
$31,382
8
$75,880
26
$65,258
APPLICATIONS WITHDRAWN
1
$122,130
3
$79,180
105
$103,362
4
$79,268
3
$109,647
17
$68,828
FILES CLOSED FOR INCOMPLETENESS
2
$85,085
2
$153,070
10
$137,156
1
$26,870
1
$89,560
0
$0
Aggregated Statistics For Year 2006 (Based on 6 partial tracts)
A) FHA, FSA/RHS & VA Home Purchase Loans
B) Conventional Home Purchase Loans
C) Refinancings
D) Home Improvement Loans
F) Non-occupant Loans on < 5 Family Dwellings (A B C & D)
G) Loans On Manufactured Home Dwelling (A B C & D)
Number
Average Value
Number
Average Value
Number
Average Value
Number
Average Value
Number
Average Value
Number
Average Value
LOANS ORIGINATED
23
$104,118
84
$102,669
141
$87,544
28
$53,045
12
$77,780
36
$77,073
APPLICATIONS APPROVED, NOT ACCEPTED
0
$0
15
$75,141
24
$69,237
2
$57,400
2
$59,435
10
$73,604
APPLICATIONS DENIED
7
$79,349
30
$81,436
193
$88,463
18
$39,419
3
$94,283
57
$69,769
APPLICATIONS WITHDRAWN
4
$109,798
9
$96,016
154
$90,815
6
$39,327
2
$41,020
19
$69,058
FILES CLOSED FOR INCOMPLETENESS
1
$90,380
4
$89,340
25
$94,316
0
$0
0
$0
3
$108,473
Aggregated Statistics For Year 2005 (Based on 6 partial tracts)
A) FHA, FSA/RHS & VA Home Purchase Loans
B) Conventional Home Purchase Loans
C) Refinancings
D) Home Improvement Loans
F) Non-occupant Loans on < 5 Family Dwellings (A B C & D)
G) Loans On Manufactured Home Dwelling (A B C & D)
Number
Average Value
Number
Average Value
Number
Average Value
Number
Average Value
Number
Average Value
Number
Average Value
LOANS ORIGINATED
31
$107,609
86
$85,724
153
$80,460
23
$41,280
16
$70,539
38
$58,588
APPLICATIONS APPROVED, NOT ACCEPTED
2
$59,845
21
$68,243
42
$64,840
6
$54,385
6
$66,365
12
$62,313
APPLICATIONS DENIED
3
$89,410
23
$66,633
229
$87,088
34
$41,986
7
$51,527
45
$53,320
APPLICATIONS WITHDRAWN
2
$92,410
9
$87,210
110
$88,895
12
$73,736
2
$128,235
17
$73,908
FILES CLOSED FOR INCOMPLETENESS
1
$70,720
4
$139,838
19
$91,832
0
$0
2
$130,265
2
$135,565
Aggregated Statistics For Year 2004 (Based on 6 partial tracts)
A) FHA, FSA/RHS & VA Home Purchase Loans
B) Conventional Home Purchase Loans
C) Refinancings
D) Home Improvement Loans
F) Non-occupant Loans on < 5 Family Dwellings (A B C & D)
G) Loans On Manufactured Home Dwelling (A B C & D)
Number
Average Value
Number
Average Value
Number
Average Value
Number
Average Value
Number
Average Value
Number
Average Value
LOANS ORIGINATED
25
$94,204
87
$82,544
190
$83,597
25
$35,234
17
$58,191
42
$60,357
APPLICATIONS APPROVED, NOT ACCEPTED
3
$130,177
18
$62,811
47
$74,531
3
$29,170
1
$13,030
18
$47,474
APPLICATIONS DENIED
3
$92,313
28
$73,045
202
$78,438
18
$19,498
7
$77,223
40
$62,372
APPLICATIONS WITHDRAWN
4
$103,890
5
$115,128
74
$90,873
5
$33,388
1
$49,670
9
$79,018
FILES CLOSED FOR INCOMPLETENESS
0
$0
3
$110,693
7
$97,120
2
$39,895
1
$55,370
0
$0
Aggregated Statistics For Year 2003 (Based on 6 partial tracts)
A) FHA, FSA/RHS & VA Home Purchase Loans
B) Conventional Home Purchase Loans
C) Refinancings
D) Home Improvement Loans
F) Non-occupant Loans on < 5 Family Dwellings (A B C & D)
Number
Average Value
Number
Average Value
Number
Average Value
Number
Average Value
Number
Average Value
LOANS ORIGINATED
21
$103,130
87
$98,361
321
$87,744
18
$20,139
15
$83,157
APPLICATIONS APPROVED, NOT ACCEPTED
3
$85,117
20
$48,914
59
$84,284
3
$16,353
3
$109,540
APPLICATIONS DENIED
3
$88,907
35
$65,733
145
$80,676
9
$35,329
5
$82,918
APPLICATIONS WITHDRAWN
3
$91,463
12
$117,904
74
$81,368
2
$28,495
2
$24,880
FILES CLOSED FOR INCOMPLETENESS
2
$85,010
4
$99,578
21
$107,570
1
$13,780
0
$0
Aggregated Statistics For Year 2002 (Based on 2 partial tracts)
A) FHA, FSA/RHS & VA Home Purchase Loans
B) Conventional Home Purchase Loans
C) Refinancings
D) Home Improvement Loans
F) Non-occupant Loans on < 5 Family Dwellings (A B C & D)
Number
Average Value
Number
Average Value
Number
Average Value
Number
Average Value
Number
Average Value
LOANS ORIGINATED
6
$91,840
27
$88,099
65
$82,755
5
$12,674
5
$51,798
APPLICATIONS APPROVED, NOT ACCEPTED
1
$81,740
2
$42,245
23
$82,896
3
$16,837
0
$0
APPLICATIONS DENIED
0
$0
6
$77,452
50
$81,793
3
$6,733
0
$0
APPLICATIONS WITHDRAWN
0
$0
1
$85,410
32
$78,150
1
$10,100
1
$33,060
FILES CLOSED FOR INCOMPLETENESS
0
$0
0
$0
5
$70,166
0
$0
0
$0
Aggregated Statistics For Year 2001 (Based on 2 partial tracts)
A) FHA, FSA/RHS & VA Home Purchase Loans
B) Conventional Home Purchase Loans
C) Refinancings
D) Home Improvement Loans
E) Loans on Dwellings For 5+ Families
F) Non-occupant Loans on < 5 Family Dwellings (A B C & D)
Number
Average Value
Number
Average Value
Number
Average Value
Number
Average Value
Number
Average Value
Number
Average Value
LOANS ORIGINATED
5
$115,168
24
$89,123
57
$96,706
6
$21,735
1
$482,160
2
$37,195
APPLICATIONS APPROVED, NOT ACCEPTED
0
$0
2
$54,185
9
$75,614
1
$22,960
0
$0
0
$0
APPLICATIONS DENIED
0
$0
9
$29,389
33
$69,019
1
$7,350
0
$0
1
$91,840
APPLICATIONS WITHDRAWN
1
$48,680
0
$0
16
$70,774
0
$0
0
$0
0
$0
FILES CLOSED FOR INCOMPLETENESS
0
$0
0
$0
4
$62,450
0
$0
0
$0
1
$13,780
Aggregated Statistics For Year 2000 (Based on 2 partial tracts)
A) FHA, FSA/RHS & VA Home Purchase Loans
B) Conventional Home Purchase Loans
C) Refinancings
D) Home Improvement Loans
F) Non-occupant Loans on < 5 Family Dwellings (A B C & D)
Number
Average Value
Number
Average Value
Number
Average Value
Number
Average Value
Number
Average Value
LOANS ORIGINATED
5
$75,308
26
$74,991
20
$50,053
2
$26,635
5
$56,940
APPLICATIONS APPROVED, NOT ACCEPTED
0
$0
6
$130,872
5
$77,512
5
$23,694
2
$74,390
APPLICATIONS DENIED
1
$85,410
21
$84,537
26
$86,259
5
$8,816
1
$9,180
APPLICATIONS WITHDRAWN
1
$55,100
1
$73,470
8
$123,869
0
$0
1
$45,000
FILES CLOSED FOR INCOMPLETENESS
0
$0
0
$0
1
$71,640
0
$0
0
$0
Aggregated Statistics For Year 1999 (Based on 1 full and 3 partial tracts)
A) FHA, FSA/RHS & VA Home Purchase Loans
B) Conventional Home Purchase Loans
C) Refinancings
D) Home Improvement Loans
F) Non-occupant Loans on < 5 Family Dwellings (A B C & D)
Detailed PMIC statistics for the following Tracts:0108.00
, 0114.00
2003 - 2018 National Fire Incident Reporting System (NFIRS) incidents
Based on the data from the years 2003 - 2018 the average number of fires per year is 62. The highest number of reported fires - 115 took place in 2006, and the least - 35 in 2003. The data has a rising trend.
When looking into fire subcategories, the most incidents belonged to: Outside Fires (46.2%), and Structure Fires (39.4%).
Fire incident types reported to NFIRS in Zip Code 24586


+$891
-$5,267
 Nearest zip codes: 27305, 24594, 27212, 24566, 24527, 24540.


 (Students: 656, Location: 100 DAN RIVER WILDCAT CIR, Grades: 9-12)


 Based on the data from the years 2003 - 2018 the average number of fires per year is 62. The highest number of reported fires - 115 took place in 2006, and the least - 35 in 2003. The data has a rising trend.
 When looking into fire subcategories, the most incidents belonged to: Outside Fires (46.2%), and Structure Fires (39.4%).