Estimated zip code population in 2022: 1,250 Zip code population in 2010: 1,415 Zip code population in 2000: 1,344
Houses and condos: 580 Renter-occupied apartments: 34
% of renters here:
7%
State:
26%
March 2022 cost of living index in zip code 26133: 81.9 (low, U.S. average is 100)
Land area: 39.2 sq. mi. Water area: 0.9 sq. mi.
Population density: 32 people per square mile
(very low).
OSM Map
General Map
Google Map
MSN Map
OSM Map
General Map
Google Map
MSN Map
OSM Map
General Map
Google Map
MSN Map
OSM Map
General Map
Google Map
MSN Map
Please wait while loading the map...
Real estate property taxes paid for housing units in 2022:
This zip code:
0.5% ($920)
West Virginia:
0.5% ($821)
Median real estate property taxes paid for housing units with mortgages in 2022: $1,019 (0.5%) Median real estate property taxes paid for housing units with no mortgage in 2022: $849 (0.4%)
Business Search- 14 Million verified businesses
Males: 718
(57.5%)
Females: 530
(42.5%)
For population 25 years and over in 26133:
High school or higher: 98.7%
Bachelor's degree or higher: 21.1%
Graduate or professional degree: 8.5%
Mean travel time to work (commute): 33.6 minutes
For population 15 years and over in 26133:
Never married: 15.2%
Now married: 73.3%
Separated: 0.0%
Widowed: 3.9%
Divorced: 7.7%
Zip code 26133 compared to state average:
Unemployed percentage significantly below state average.
Black race population percentage significantly below state average.
Median age above state average.
Foreign-born population percentage below state average.
Renting percentage significantly below state average.
Length of stay since moving in significantly above state average.
House age below state average.
Number of college students significantly below state average.
Averages for the 2020 tax year for zip code 26133, filed in 2021:
Average Adjusted Gross Income (AGI) in 2020: $52,120 (Individual Income Tax Returns)
Here:
$52,120
State:
$56,292
Salary/wage: $49,293 (reported on 78.0% of returns)
Here:
$49,293
State:
$49,093
(% of AGI for various income ranges: 929.4% for AGIs below $25k, 3268.2% for AGIs $25k-50k, 6294.3% for AGIs $50k-75k, 10120.0% for AGIs $75k-100k, 15231.7% for AGIs $100k-200k)
Taxable interest for individuals: $216 (reported on 32.2% of returns)
This zip code:
$216
West Virginia:
$1,141
(% of AGI for various income ranges: 3.8% for AGIs below $25k, 8.2% for AGIs $25k-50k, 7.1% for AGIs $50k-75k, 15.0% for AGIs $75k-100k, 25.0% for AGIs $100k-200k)
Ordinary dividends: $1,383 (reported on 10.2% of returns)
Here:
$1,383
State:
$5,456
(% of AGI for various income ranges: 34.5% for AGIs $25k-50k, 75.0% for AGIs $100k-200k)
Net capital gain/loss in AGI: +$4,040 (reported on 8.5% of returns)
Here:
+$4,040
State:
+$11,656
(% of AGI for various income ranges: 19.4% for AGIs below $25k, 427.5% for AGIs $75k-100k)
Profit/loss from business: +$3,083 (reported on 10.2% of returns)
Here:
+$3,083
State:
+$12,084
(% of AGI for various income ranges: 112.5% for AGIs below $25k, 12.5% for AGIs $75k-100k)
Taxable individual retirement arrangement distribution: $12,483 (reported on 10.2% of returns)
26133:
$12,483
West Virginia:
$15,311
(% of AGI for various income ranges: 125.6% for AGIs below $25k, 782.9% for AGIs $50k-75k)
Earned income credit: $2,400 (reported on 16.9% of returns)
Here:
$2,400
State:
$2,258
(% of AGI for various income ranges: 100.6% for AGIs below $25k, 71.8% for AGIs $25k-50k)
Percentage of individuals using paid preparers for their 2020 taxes: 91.5%
Here:
92%
State:
93%
(% for various income ranges: 95.2% for AGIs below $25k, 92.3% for AGIs $25k-50k, 80.0% for AGIs $50k-75k, 100.0% for AGIs $75k-100k, 88.9% for AGIs $100k-200k)
Averages for the 2012 tax year for zip code 26133, filed in 2013:
Average Adjusted Gross Income (AGI) in 2012: $43,769 (Individual Income Tax Returns)
Here:
$43,769
State:
$48,628
Salary/wage: $39,456 (reported on 85.2% of returns)
Here:
$39,456
State:
$42,328
(% of AGI for various income ranges: 70.0% for AGIs below $25k, 77.9% for AGIs $25k-50k, 84.0% for AGIs $50k-75k, 72.7% for AGIs $75k-100k, 75.6% for AGIs $100k-200k)
Taxable interest for individuals: $572 (reported on 29.5% of returns)
This zip code:
$572
West Virginia:
$1,211
(% of AGI for various income ranges: 0.4% for AGIs below $25k, 0.6% for AGIs $25k-50k, 0.1% for AGIs $50k-75k, 0.2% for AGIs $75k-100k, 0.6% for AGIs $100k-200k)
Ordinary dividends: $443 (reported on 11.5% of returns)
Here:
$443
State:
$4,262
(% of AGI for various income ranges: 0.3% for AGIs below $25k, 0.2% for AGIs $25k-50k, 0.1% for AGIs $75k-100k)
Net capital gain/loss in AGI: +$825 (reported on 6.6% of returns)
Here:
+$825
State:
+$8,875
Profit/loss from business: +$4,257 (reported on 11.5% of returns)
Here:
+$4,257
State:
+$13,636
Taxable individual retirement arrangement distribution: $8,625 (reported on 6.6% of returns)
26133:
$8,625
West Virginia:
$11,787
Total itemized deductions: $15,840 (21% of AGI, reported on 16.4% of returns)
Here:
$15,840
State:
$21,148
Here:
20.6% of AGI
State:
18.1% of AGI
(% of AGI for various income ranges: 11.3% for AGIs below $25k, 6.1% for AGIs $50k-75k, 7.7% for AGIs $75k-100k, 6.6% for AGIs $100k-200k)
Charity contributions: $2,933 (reported on 9.8% of returns)
Here:
$2,933
State:
$4,508
Taxes paid: $4,990 (reported on 16.4% of returns)
26133:
$4,990
State:
$8,103
(% of AGI for various income ranges: 1.9% for AGIs below $25k, 1.6% for AGIs $50k-75k, 2.3% for AGIs $75k-100k, 3.5% for AGIs $100k-200k)
Earned income credit: $2,190 (reported on 16.4% of returns)
Here:
$2,190
State:
$2,140
(% of AGI for various income ranges: 5.4% for AGIs below $25k, 0.9% for AGIs $25k-50k)
Percentage of individuals using paid preparers for their 2012 taxes: 49.2%
Here:
49%
State:
49%
(% for various income ranges: 45.8% for AGIs below $25k, 53.3% for AGIs $25k-50k, 45.5% for AGIs $50k-75k, 50.0% for AGIs $75k-100k, 60.0% for AGIs $100k-200k)
Averages for the 2004 tax year for zip code 26133, filed in 2005:
Average Adjusted Gross Income (AGI) in 2004: $35,159 (Individual Income Tax Returns)
Here:
$35,159
State:
$37,498
Salary/wage: $34,016 (reported on 87.2% of returns)
Here:
$34,016
State:
$33,645
(% of AGI for various income ranges: 80.2% for AGIs below $10k, 72.1% for AGIs $10k-25k, 84.9% for AGIs $25k-50k, 87.8% for AGIs $50k-75k, 89.1% for AGIs $75k-100k, 76.9% for AGIs over 100k)
Taxable interest for individuals: $621 (reported on 41.0% of returns)
This zip code:
$621
West Virginia:
$1,465
(% of AGI for various income ranges: 0.7% for AGIs below $10k, 1.4% for AGIs $10k-25k, 0.5% for AGIs $25k-50k, 1.0% for AGIs $50k-75k, 0.4% for AGIs $75k-100k)
Taxable dividends: $508 (reported on 11.1% of returns)
Here:
$508
State:
$2,913
(% of AGI for various income ranges: 0.4% for AGIs $10k-25k, 0.1% for AGIs $25k-50k, 0.1% for AGIs $50k-75k, 0.2% for AGIs $75k-100k)
Profit/loss from business: +$4,305 (reported on 14.0% of returns)
Here:
+$4,305
State:
+$11,074
(% of AGI for various income ranges: 6.4% for AGIs below $10k, 4.6% for AGIs $10k-25k, 2.9% for AGIs $25k-50k, -0.0% for AGIs $50k-75k, 0.7% for AGIs $75k-100k)
Total itemized deductions: $14,032 (20% of AGI, reported on 16.0% of returns)
Here:
$14,032
State:
$16,976
Here:
19.7% of AGI
State:
19.0% of AGI
(% of AGI for various income ranges: 5.1% for AGIs $25k-50k, 7.8% for AGIs $50k-75k, 8.6% for AGIs $75k-100k, 14.5% for AGIs over 100k)
Charity contributions deductions: $1,973 (3% of AGI, reported on 12.5% of returns)
Here:
$1,973
State:
$3,529
Here:
2.7% of AGI
State:
3.7% of AGI
Total tax: $3,747 (reported on 73.4% of returns)
26133:
$3,747
State:
$5,372
(% of AGI for various income ranges: 1.9% for AGIs below $10k, 3.3% for AGIs $10k-25k, 5.7% for AGIs $25k-50k, 8.3% for AGIs $50k-75k, 11.3% for AGIs $75k-100k, 14.9% for AGIs over 100k)
Earned income credit: $1,719 (reported on 20.6% of returns)
Here:
$1,719
State:
$1,662
Percentage of individuals using paid preparers for their 2004 taxes: 52.2%
Here:
52%
State:
55%
(% for various income ranges: 39.3% for AGIs below $10k, 51.2% for AGIs $10k-25k, 54.5% for AGIs $25k-50k, 57.4% for AGIs $50k-75k, 75.9% for AGIs $75k-100k)
Household received Food Stamps/SNAP in the past 12 months: 57 Household did not receive Food Stamps/SNAP in the past 12 months: 425
Women who did not have a birth in the past 12 months: 187 (122 now married, 64 unmarried)
Housing units in zip code 26133 with a mortgage: 201 (14 second mortgage) Median monthly owner costs for units with a mortgage: $1,081 Median monthly owner costs for units without a mortgage: $432
Residents with income below the poverty level in 2022:
This zip code:
6.4%
Whole state:
17.9%
Residents with income below 50% of the poverty level in 2022:
This zip code:
1.9%
Whole state:
9.7%
Median number of rooms in houses and condos:
Here:
6.4
State:
6.5
Median number of rooms in apartments:
Here:
4.2
State:
4.7
Notable locations in this zip code not listed on our city pages
Churches in zip code 26133 include: Lee Creek Church (A), Buckley Chapel (B), Mount Olive Church (C), Pond Creek Baptist Church (D), Pleasant Home Church (E), Ford Church (F). Display/hide their locations on the map
Cemeteries: Buckley Cemetery (1), Pond Creek Baptist Church Cemetery (2), Pleasant Home Cemetery (3), Mount Olive Church Cemetery (4), Flinn Cemetery (5), Crooks Cemetery (6), White Cemetery (7). Display/hide their locations on the map
Streams, rivers, and creeks: Thomas Run (A), The Slough (B), Tagger Run (C), Sugarcamp Run (D), Slate Run (E), Short Run (F), Ruble Run (G), Right Fork Wolf Run (H), Mud Lick (I). Display/hide their locations on the map
Size of family households: 168 2-persons, 175 3-persons, 24 4-persons, 1 5-persons
Size of nonfamily households: 89 1-person, 35 2-persons
168 married couples with children.
26 single-parent households (26 men).
99.2% of residents of 26133 zip code speak English at home.
0.6% of residents speak other Indo-European language at home (100% very well).
Foreign born population: 11 (0.9%) (100.0% of them are naturalized citizens)
This zip code:
0.9%
Whole state:
1.8%
90%France
49%German
22%American
7%English
6%European
2%Norwegian
2%Irish
2%Italian
Year of entry for the foreign-born population
02010 or later
02000 to 2009
01990 to 1999
9Before 1990
Facilities with environmental interests located in this zip code:
FOXS SERVICE CENTER (15 M N RAVENSWOOD ON RT 68 in BELLEVILLE, WV)
(Resource Conservation and Recovery Act (tracking hazardous waste)) Organizations: GARY FOX (CONTACT/OWNER)
Housing units lacking complete plumbing facilities: 2.9% Housing units lacking complete kitchen facilities: 2.8%
44.9%Electricity
32.8%Bottled, tank, or LP gas
12.6%Wood
5.5%Fuel oil, kerosene, etc.
4.9%Utility gas
Population in 1990: 1,240. Population change in the 1990s: +104 (+8.4%).
Place of birth for U.S.-born residents:
This state: 896
Northeast: 25
Midwest: 282
South: 30
71% of the 26133 zip code residents lived in the same house 5 years ago. Out of people who lived in different houses, 82% lived in this county. Out of people who lived in different counties, 50% lived in West Virginia.
100% of the 26133 zip code residents lived in the same house 1 year ago.
Private vs. public school enrollment:
Students in private schools in grades 1 to 8 (elementary and middle school):
Here:
0.0%
West Virginia:
12.2%
Students in private schools in grades 9 to 12 (high school):
Here:
0.0%
West Virginia:
8.8%
Students in private undergraduate colleges:
Here:
0.0%
West Virginia:
17.3%
Occupation by median earnings in the past 12 months ($)
63,257Transportation occupations
54,249Business and financial operations occupations
49,448Construction and extraction occupations
Companies with federal contracts located in this zip code:
FOX, ROY (ROUTE 1 BOX 32A in BELLEVILLE, WV; small business) : $859,653 in 6 contractsfrom 2003 to 2005
Contracts for Services -- Basic Research (R&D) by Army Signed by year:2000: $0; 2001: $0; 2002: $0; 2003: $69,996; 2004: $488,254; 2005: $301,403; 2006: $0.
Biggest contracts:
$368,326 with Army for Services -- Basic Research (R&D). Signed on 2004-11-08. Completion date: 2006-11-27.
$301,403, same as above.Signed on 2005-11-15. Completion date: 2006-11-27.
$69,996, same as above.Signed on 2003-12-11. Completion date: 2004-06-11.
$69,941, same as above.Signed on 2004-12-13. Completion date: 2005-06-13.
Top industries in this zip code by the number of employees in 2005:
Construction: Poured Concrete Foundation and Structure Contractors (1-4 employees: 1 establishment)
Construction: Electrical Contractors (1-4: 1)
Professional, Scientific, and Technical Services: Testing Laboratories (1-4: 1)
Other Services (except Public Administration): General Automotive Repair (1-4: 1)
Construction: New Single-Family Housing Construction (except Operative Builders) (1-4: 1)
Construction: Masonry Contractors (1-4: 1)
Fatal accident statistics in 2014:
Fatal accident count: 1
Vehicles involved in fatal accidents: 1
Fatal accidents caused by drunken drivers: 0
Fatalities: 2
Persons involved in fatal accidents: 3
Pedestrians involved in fatal accidents: 0
Fatal accident statistics in 2010:
Fatal accident count: 1
Vehicles involved in fatal accidents: 2
Fatal accidents caused by drunken drivers: 0
Fatalities: 1
Persons involved in fatal accidents: 2
Pedestrians involved in fatal accidents: 0
Home Mortgage Disclosure Act Aggregated Statistics For Year 2009 (Based on 2 partial tracts)
A) FHA, FSA/RHS & VA Home Purchase Loans
B) Conventional Home Purchase Loans
C) Refinancings
D) Home Improvement Loans
F) Non-occupant Loans on < 5 Family Dwellings (A B C & D)
G) Loans On Manufactured Home Dwelling (A B C & D)
Number
Average Value
Number
Average Value
Number
Average Value
Number
Average Value
Number
Average Value
Number
Average Value
LOANS ORIGINATED
6
$118,283
6
$131,068
49
$115,771
4
$43,398
2
$58,940
8
$65,904
APPLICATIONS APPROVED, NOT ACCEPTED
0
$0
1
$54,100
2
$140,085
0
$0
0
$0
0
$0
APPLICATIONS DENIED
1
$186,510
5
$55,388
19
$83,842
2
$35,930
0
$0
5
$49,252
APPLICATIONS WITHDRAWN
1
$106,580
3
$108,460
12
$123,802
0
$0
0
$0
3
$88,277
FILES CLOSED FOR INCOMPLETENESS
0
$0
0
$0
2
$102,540
0
$0
0
$0
0
$0
Aggregated Statistics For Year 2008 (Based on 2 partial tracts)
A) FHA, FSA/RHS & VA Home Purchase Loans
B) Conventional Home Purchase Loans
C) Refinancings
D) Home Improvement Loans
F) Non-occupant Loans on < 5 Family Dwellings (A B C & D)
G) Loans On Manufactured Home Dwelling (A B C & D)
Number
Average Value
Number
Average Value
Number
Average Value
Number
Average Value
Number
Average Value
Number
Average Value
LOANS ORIGINATED
2
$173,995
13
$111,173
23
$110,719
6
$66,342
2
$73,475
6
$85,450
APPLICATIONS APPROVED, NOT ACCEPTED
0
$0
2
$136,855
2
$124,745
0
$0
0
$0
1
$52,480
APPLICATIONS DENIED
1
$129,180
2
$73,070
19
$107,597
2
$24,625
0
$0
9
$84,508
APPLICATIONS WITHDRAWN
0
$0
2
$100,520
9
$111,601
1
$49,250
1
$33,910
1
$49,250
FILES CLOSED FOR INCOMPLETENESS
0
$0
0
$0
0
$0
0
$0
0
$0
0
$0
Aggregated Statistics For Year 2007 (Based on 2 partial tracts)
A) FHA, FSA/RHS & VA Home Purchase Loans
B) Conventional Home Purchase Loans
C) Refinancings
D) Home Improvement Loans
F) Non-occupant Loans on < 5 Family Dwellings (A B C & D)
G) Loans On Manufactured Home Dwelling (A B C & D)
Number
Average Value
Number
Average Value
Number
Average Value
Number
Average Value
Number
Average Value
Number
Average Value
LOANS ORIGINATED
6
$88,275
22
$109,660
34
$100,141
7
$33,334
2
$225,670
10
$68,710
APPLICATIONS APPROVED, NOT ACCEPTED
0
$0
5
$75,412
3
$65,130
0
$0
0
$0
4
$70,648
APPLICATIONS DENIED
1
$75,090
2
$121,515
28
$81,057
3
$45,483
0
$0
7
$60,786
APPLICATIONS WITHDRAWN
0
$0
0
$0
5
$94,788
0
$0
0
$0
0
$0
FILES CLOSED FOR INCOMPLETENESS
0
$0
2
$111,825
2
$105,770
0
$0
0
$0
0
$0
Aggregated Statistics For Year 2006 (Based on 2 partial tracts)
A) FHA, FSA/RHS & VA Home Purchase Loans
B) Conventional Home Purchase Loans
C) Refinancings
D) Home Improvement Loans
F) Non-occupant Loans on < 5 Family Dwellings (A B C & D)
G) Loans On Manufactured Home Dwelling (A B C & D)
Number
Average Value
Number
Average Value
Number
Average Value
Number
Average Value
Number
Average Value
Number
Average Value
LOANS ORIGINATED
3
$129,453
17
$116,028
34
$81,096
19
$24,987
1
$91,240
10
$86,553
APPLICATIONS APPROVED, NOT ACCEPTED
1
$36,330
4
$87,200
2
$56,520
0
$0
0
$0
2
$41,175
APPLICATIONS DENIED
0
$0
3
$53,557
31
$83,501
13
$37,575
1
$75,090
7
$71,629
APPLICATIONS WITHDRAWN
1
$102,540
1
$4,040
12
$108,662
1
$75,090
0
$0
4
$60,958
FILES CLOSED FOR INCOMPLETENESS
0
$0
1
$43,600
0
$0
0
$0
0
$0
0
$0
Aggregated Statistics For Year 2005 (Based on 2 partial tracts)
A) FHA, FSA/RHS & VA Home Purchase Loans
B) Conventional Home Purchase Loans
C) Refinancings
D) Home Improvement Loans
F) Non-occupant Loans on < 5 Family Dwellings (A B C & D)
G) Loans On Manufactured Home Dwelling (A B C & D)
Number
Average Value
Number
Average Value
Number
Average Value
Number
Average Value
Number
Average Value
Number
Average Value
LOANS ORIGINATED
3
$120,840
21
$106,961
27
$77,331
9
$33,013
2
$42,790
10
$56,437
APPLICATIONS APPROVED, NOT ACCEPTED
0
$0
1
$27,450
5
$66,206
1
$5,650
0
$0
1
$29,870
APPLICATIONS DENIED
3
$35,527
2
$16,150
23
$89,937
13
$39,252
2
$21,800
10
$30,116
APPLICATIONS WITHDRAWN
0
$0
3
$86,930
15
$102,001
3
$55,710
1
$54,900
2
$112,230
FILES CLOSED FOR INCOMPLETENESS
0
$0
1
$62,170
3
$69,437
0
$0
0
$0
0
$0
Aggregated Statistics For Year 2004 (Based on 2 partial tracts)
A) FHA, FSA/RHS & VA Home Purchase Loans
B) Conventional Home Purchase Loans
C) Refinancings
D) Home Improvement Loans
F) Non-occupant Loans on < 5 Family Dwellings (A B C & D)
G) Loans On Manufactured Home Dwelling (A B C & D)
Number
Average Value
Number
Average Value
Number
Average Value
Number
Average Value
Number
Average Value
Number
Average Value
LOANS ORIGINATED
3
$116,803
17
$85,299
48
$77,258
11
$25,984
4
$42,590
17
$42,650
APPLICATIONS APPROVED, NOT ACCEPTED
0
$0
2
$87,605
4
$73,070
2
$25,835
1
$100,920
1
$50,060
APPLICATIONS DENIED
0
$0
5
$108,514
20
$80,619
9
$30,950
0
$0
7
$35,871
APPLICATIONS WITHDRAWN
0
$0
1
$109,000
13
$87,137
0
$0
0
$0
1
$48,440
FILES CLOSED FOR INCOMPLETENESS
0
$0
1
$68,630
4
$104,962
1
$23,410
0
$0
0
$0
Aggregated Statistics For Year 2003 (Based on 2 partial tracts)
A) FHA, FSA/RHS & VA Home Purchase Loans
B) Conventional Home Purchase Loans
C) Refinancings
D) Home Improvement Loans
F) Non-occupant Loans on < 5 Family Dwellings (A B C & D)
Number
Average Value
Number
Average Value
Number
Average Value
Number
Average Value
Number
Average Value
LOANS ORIGINATED
2
$56,520
20
$79,730
44
$77,492
6
$20,992
2
$58,535
APPLICATIONS APPROVED, NOT ACCEPTED
0
$0
6
$83,567
11
$83,823
1
$20,180
0
$0
APPLICATIONS DENIED
0
$0
5
$53,772
21
$71,320
2
$12,920
0
$0
APPLICATIONS WITHDRAWN
0
$0
2
$88,005
11
$89,988
1
$24,220
1
$61,360
FILES CLOSED FOR INCOMPLETENESS
0
$0
0
$0
2
$51,675
1
$20,180
1
$43,600
Aggregated Statistics For Year 2002 (Based on 2 partial tracts)
A) FHA, FSA/RHS & VA Home Purchase Loans
B) Conventional Home Purchase Loans
C) Refinancings
D) Home Improvement Loans
F) Non-occupant Loans on < 5 Family Dwellings (A B C & D)
Number
Average Value
Number
Average Value
Number
Average Value
Number
Average Value
Number
Average Value
LOANS ORIGINATED
0
$0
22
$71,749
52
$72,293
6
$16,417
2
$22,605
APPLICATIONS APPROVED, NOT ACCEPTED
0
$0
2
$64,590
3
$94,733
2
$5,250
0
$0
APPLICATIONS DENIED
2
$66,610
6
$37,543
20
$58,334
1
$12,110
0
$0
APPLICATIONS WITHDRAWN
0
$0
1
$96,080
10
$74,765
0
$0
0
$0
FILES CLOSED FOR INCOMPLETENESS
0
$0
0
$0
6
$73,070
1
$29,070
0
$0
Aggregated Statistics For Year 2001 (Based on 2 partial tracts)
A) FHA, FSA/RHS & VA Home Purchase Loans
B) Conventional Home Purchase Loans
C) Refinancings
D) Home Improvement Loans
F) Non-occupant Loans on < 5 Family Dwellings (A B C & D)
Number
Average Value
Number
Average Value
Number
Average Value
Number
Average Value
Number
Average Value
LOANS ORIGINATED
2
$60,555
19
$78,615
40
$70,204
6
$29,740
1
$3,230
APPLICATIONS APPROVED, NOT ACCEPTED
1
$102,540
4
$42,995
4
$51,068
1
$63,780
0
$0
APPLICATIONS DENIED
1
$62,170
8
$38,049
18
$59,478
3
$14,263
1
$24,220
APPLICATIONS WITHDRAWN
0
$0
2
$91,235
10
$62,008
2
$56,520
1
$8,070
FILES CLOSED FOR INCOMPLETENESS
0
$0
0
$0
2
$48,850
0
$0
0
$0
Aggregated Statistics For Year 2000 (Based on 2 partial tracts)
A) FHA, FSA/RHS & VA Home Purchase Loans
B) Conventional Home Purchase Loans
C) Refinancings
D) Home Improvement Loans
F) Non-occupant Loans on < 5 Family Dwellings (A B C & D)
Number
Average Value
Number
Average Value
Number
Average Value
Number
Average Value
Number
Average Value
LOANS ORIGINATED
0
$0
19
$53,841
24
$64,255
4
$15,745
4
$31,892
APPLICATIONS APPROVED, NOT ACCEPTED
0
$0
6
$53,558
6
$43,197
0
$0
0
$0
APPLICATIONS DENIED
1
$72,670
23
$42,547
14
$41,293
2
$4,845
1
$6,460
APPLICATIONS WITHDRAWN
0
$0
4
$50,665
5
$49,574
0
$0
0
$0
FILES CLOSED FOR INCOMPLETENESS
0
$0
0
$0
0
$0
0
$0
0
$0
Aggregated Statistics For Year 1999 (Based on 1 partial tract)
B) Conventional Home Purchase Loans
C) Refinancings
D) Home Improvement Loans
F) Non-occupant Loans on < 5 Family Dwellings (A B C & D)
Detailed PMIC statistics for the following Tracts:0108.00
2003 - 2018 National Fire Incident Reporting System (NFIRS) incidents
According to the data from the years 2003 - 2018 the average number of fires per year is 9. The highest number of fires - 23 took place in 2015, and the least - 4 in 2004. The data has an increasing trend.
When looking into fire subcategories, the most reports belonged to: Structure Fires (56.0%), and Outside Fires (28.7%).
Fire incident types reported to NFIRS in Zip Code 26133

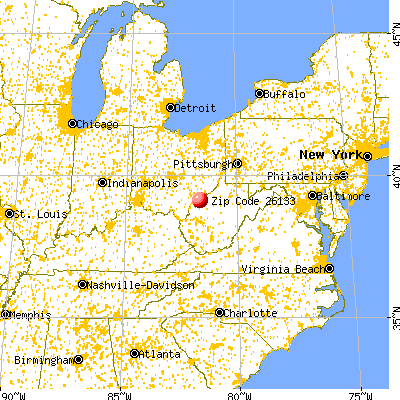


 Nearest zip codes: 26181, 26169, 26164, 26150, 45772, 26101.


 According to the data from the years 2003 - 2018 the average number of fires per year is 9. The highest number of fires - 23 took place in 2015, and the least - 4 in 2004. The data has an increasing trend.
 When looking into fire subcategories, the most reports belonged to: Structure Fires (56.0%), and Outside Fires (28.7%).