Estimated zip code population in 2022: 828 Zip code population in 2010: 842 Zip code population in 2000: 762
Houses and condos: 324 Renter-occupied apartments: 104
% of renters here:
31%
State:
26%
March 2022 cost of living index in zip code 26169: 81.9 (low, U.S. average is 100)
Land area: 26.6 sq. mi. Water area: 0.0 sq. mi.
Population density: 31 people per square mile
(very low).
OSM Map
General Map
Google Map
MSN Map
OSM Map
General Map
Google Map
MSN Map
OSM Map
General Map
Google Map
MSN Map
OSM Map
General Map
Google Map
MSN Map
Please wait while loading the map...
Real estate property taxes paid for housing units in 2022:
This zip code:
0.7% ($952)
West Virginia:
0.5% ($821)
Median real estate property taxes paid for housing units with mortgages in 2022: $1,006 Median real estate property taxes paid for housing units with no mortgage in 2022: $907
Business Search- 14 Million verified businesses
Males: 384
(46.4%)
Females: 444
(53.6%)
For population 25 years and over in 26169:
High school or higher: 92.6%
Bachelor's degree or higher: 15.3%
Graduate or professional degree: 9.5%
Unemployed: 1.4%
Mean travel time to work (commute): 24.3 minutes
For population 15 years and over in 26169:
Never married: 31.0%
Now married: 59.0%
Separated: 0.0%
Widowed: 5.7%
Divorced: 4.4%
Zip code 26169 compared to state average:
Unemployed percentage significantly below state average.
Black race population percentage significantly below state average.
Hispanic race population percentage significantly below state average.
Foreign-born population percentage significantly below state average.
Percentage of population with a bachelor's degree or higher below state average.
Estimated median house/condo value in 2022: $144,037
26169:
$144,037
West Virginia:
$155,100
According to our research of West Virginia and other state lists, there were 2 registered sex offenders living in 26169 zip code as of May 28, 2024. The ratio of all residents to sex offenders in zip code 26169 is 312 to 1. The ratio of registered sex offenders to all residents in this zip code is near the state average.
Median resident age:
This zip code:
40.4 years
West Virginia median age:
42.9 years
Average household size:
This zip code:
2.5 people
West Virginia:
2.3 people
Averages for the 2020 tax year for zip code 26169, filed in 2021:
Average Adjusted Gross Income (AGI) in 2020: $50,129 (Individual Income Tax Returns)
Here:
$50,129
State:
$56,292
Salary/wage: $47,304 (reported on 79.4% of returns)
Here:
$47,304
State:
$49,093
(% of AGI for various income ranges: 1231.2% for AGIs below $25k, 3228.3% for AGIs $25k-50k, 5341.7% for AGIs $50k-75k, 9770.0% for AGIs $75k-100k, 15636.7% for AGIs $100k-200k)
Taxable interest for individuals: $212 (reported on 23.5% of returns)
This zip code:
$212
West Virginia:
$1,141
(% of AGI for various income ranges: 21.7% for AGIs $25k-50k, 20.0% for AGIs $75k-100k)
Ordinary dividends: $433 (reported on 8.8% of returns)
Here:
$433
State:
$5,456
(% of AGI for various income ranges: 21.7% for AGIs $25k-50k)
Net capital gain/loss in AGI: +$550 (reported on 5.9% of returns)
Here:
+$550
State:
+$11,656
(% of AGI for various income ranges: 18.3% for AGIs $25k-50k)
Taxable individual retirement arrangement distribution: $5,800 (reported on 8.8% of returns)
26169:
$5,800
West Virginia:
$15,311
(% of AGI for various income ranges: 217.5% for AGIs below $25k)
Earned income credit: $2,300 (reported on 14.7% of returns)
Here:
$2,300
State:
$2,258
(% of AGI for various income ranges: 143.8% for AGIs below $25k)
Percentage of individuals using paid preparers for their 2020 taxes: 91.2%
Here:
91%
State:
93%
(% for various income ranges: 91.7% for AGIs below $25k, 87.5% for AGIs $25k-50k, 85.7% for AGIs $50k-75k, 100.0% for AGIs $75k-100k, 100.0% for AGIs $100k-200k)
Averages for the 2012 tax year for zip code 26169, filed in 2013:
Average Adjusted Gross Income (AGI) in 2012: $40,676 (Individual Income Tax Returns)
Here:
$40,676
State:
$48,628
Salary/wage: $39,162 (reported on 85.3% of returns)
Here:
$39,162
State:
$42,328
(% of AGI for various income ranges: 74.4% for AGIs below $25k, 75.1% for AGIs $25k-50k, 89.3% for AGIs $50k-75k, 81.2% for AGIs $75k-100k, 89.0% for AGIs $100k-200k)
Taxable interest for individuals: $312 (reported on 23.5% of returns)
This zip code:
$312
West Virginia:
$1,211
(% of AGI for various income ranges: 0.2% for AGIs below $25k, 0.5% for AGIs $25k-50k, 0.2% for AGIs $75k-100k)
Ordinary dividends: $800 (reported on 5.9% of returns)
Here:
$800
State:
$4,262
Profit/loss from business: +$2,267 (reported on 8.8% of returns)
Here:
+$2,267
State:
+$13,636
(% of AGI for various income ranges: 2.1% for AGIs $25k-50k)
Total itemized deductions: $18,940 (22% of AGI, reported on 14.7% of returns)
Here:
$18,940
State:
$21,148
Here:
22.4% of AGI
State:
18.1% of AGI
(% of AGI for various income ranges: 13.3% for AGIs $25k-50k, 16.5% for AGIs $75k-100k)
Charity contributions: $2,850 (reported on 5.9% of returns)
Here:
$2,850
State:
$4,508
Taxes paid: $5,780 (reported on 14.7% of returns)
26169:
$5,780
State:
$8,103
(% of AGI for various income ranges: 2.1% for AGIs $25k-50k, 7.1% for AGIs $75k-100k)
Earned income credit: $2,550 (reported on 17.6% of returns)
Here:
$2,550
State:
$2,140
(% of AGI for various income ranges: 8.4% for AGIs below $25k)
Percentage of individuals using paid preparers for their 2012 taxes: 52.9%
Here:
53%
State:
49%
(% for various income ranges: 57.1% for AGIs below $25k, 55.6% for AGIs $25k-50k, 40.0% for AGIs $50k-75k, 75.0% for AGIs $75k-100k)
Averages for the 2004 tax year for zip code 26169, filed in 2005:
Average Adjusted Gross Income (AGI) in 2004: $32,112 (Individual Income Tax Returns)
Here:
$32,112
State:
$37,498
Salary/wage: $31,284 (reported on 89.0% of returns)
Here:
$31,284
State:
$33,645
(% of AGI for various income ranges: 87.5% for AGIs below $10k, 76.3% for AGIs $10k-25k, 86.9% for AGIs $25k-50k, 90.2% for AGIs $50k-75k, 89.7% for AGIs $75k-100k)
Taxable interest for individuals: $758 (reported on 33.7% of returns)
This zip code:
$758
West Virginia:
$1,465
(% of AGI for various income ranges: 1.4% for AGIs below $10k, 1.5% for AGIs $10k-25k, 0.6% for AGIs $25k-50k, 1.1% for AGIs $50k-75k, 0.0% for AGIs $75k-100k)
Taxable dividends: $160 (reported on 7.0% of returns)
Here:
$160
State:
$2,913
Profit/loss from business: +$4,528 (reported on 10.1% of returns)
Here:
+$4,528
State:
+$11,074
Total itemized deductions: $15,103 (22% of AGI, reported on 11.0% of returns)
Here:
$15,103
State:
$16,976
Here:
22.0% of AGI
State:
19.0% of AGI
(% of AGI for various income ranges: 8.3% for AGIs $10k-25k, 4.2% for AGIs $50k-75k, 11.8% for AGIs $75k-100k)
Charity contributions deductions: $1,478 (2% of AGI, reported on 6.5% of returns)
Here:
$1,478
State:
$3,529
Here:
1.9% of AGI
State:
3.7% of AGI
Total tax: $3,358 (reported on 67.4% of returns)
26169:
$3,358
State:
$5,372
(% of AGI for various income ranges: 1.7% for AGIs below $10k, 3.8% for AGIs $10k-25k, 5.0% for AGIs $25k-50k, 8.5% for AGIs $50k-75k, 11.1% for AGIs $75k-100k)
Earned income credit: $1,645 (reported on 17.4% of returns)
Here:
$1,645
State:
$1,662
Percentage of individuals using paid preparers for their 2004 taxes: 46.9%
Here:
47%
State:
55%
(% for various income ranges: 39.7% for AGIs below $10k, 39.6% for AGIs $10k-25k, 54.8% for AGIs $25k-50k, 59.6% for AGIs $50k-75k, 44.4% for AGIs $75k-100k)
Household received Food Stamps/SNAP in the past 12 months: 52 Household did not receive Food Stamps/SNAP in the past 12 months: 279
Women who did not have a birth in the past 12 months: 138 (63 now married, 75 unmarried)
Housing units in zip code 26169 with a mortgage: 111 Median monthly owner costs for units with a mortgage: $1,142 Median monthly owner costs for units without a mortgage: $414
Residents with income below the poverty level in 2022:
This zip code:
14.5%
Whole state:
17.9%
Residents with income below 50% of the poverty level in 2022:
This zip code:
10.4%
Whole state:
9.7%
Median number of rooms in houses and condos:
Here:
8.0
State:
6.5
Median number of rooms in apartments:
Here:
5.4
State:
4.7
Notable locations in this zip code not listed on our city pages
Cemeteries: Limestone Cemetery (1), Gates Ridge Evangelical United Brethren Church Cemetery (2), Central Church of Christ Cemetery (3), Amos Cemetery (4), Lott Cemetery (5), Lowdell Cemetery (6), Anderson Cemetery (7). Display/hide their locations on the map
Streams, rivers, and creeks: Slatecamp Run (A), Rockcamp Run (B), Right Fork Slate Creek (C), Mannon Run (D), Little Indian Run (E), Left Fork Slate Creek (F), Laurel Run (G), Joshus Fork (H), Joes Run (I). Display/hide their locations on the map
Size of family households: 121 2-persons, 19 3-persons, 42 4-persons, 12 5-persons, 7 6-persons, 9 7-or-more-persons
Size of nonfamily households: 75 1-person, 42 2-persons
130 married couples with children.
0 single-parent households ().
96.7% of residents of 26169 zip code speak English at home.
3.9% of residents speak Spanish at home (100% very well).
Foreign born population: 0 (0.0%)
:
0.0%
Whole state:
1.8%
50%German
28%American
22%English
5%Irish
Facilities with environmental interests located in this zip code:
EASTERN AMERICAN ENERGY COMPANY LIMESTONE HILL GAS PLANT (TUCKERS CREEK ROAD in ROCKPORT, WV)
AIR MINOR (AIRS/AFS) CRITERIA AND HAZARDOUS AIR POLLUTANT INVENTORY (Inventory of air pollution sources) Conditionally Exempt Small Quantity Generators, less than 100 kg/month of hazardous waste (Resource Conservation and Recovery Act (tracking hazardous waste)) Business SIC classification: NATURAL GAS LIQUIDS Business NAICS classification: NATURAL GAS LIQUID EXTRACTION. Organizations: EASTERN AMERICAN ENERGY CORP (CONTACT/OWNER)
Alternative names: EASTERN PIPELINE LIMESTONE PLANT
BARTON CONST INC (RTE 1 in ROCKPORT, WV)
(Resource Conservation and Recovery Act (tracking hazardous waste)) Organizations: OPERNAME (CONTACT/OPERATOR)
, LEON SANFORD BARTON (CONTACT/OWNER)
COLUMBIA GAS TRANSMISSION CORPORATION (STATE ROUTE 21 in ROCKPORT, WV)
AIR MAJOR (AIRS/AFS) CRITERIA AND HAZARDOUS AIR POLLUTANT INVENTORY (Inventory of air pollution sources) Conditionally Exempt Small Quantity Generators, less than 100 kg/month of hazardous waste (Resource Conservation and Recovery Act (tracking hazardous waste)) - notification Business SIC classification: NATURAL GAS TRANSMISSION Business NAICS classification: PIPELINE TRANSPORTATION OF NATURAL GAS. Organizations: OPERNAME (CONTACT/OPERATOR)
Alternative names: CGST ROCKPORT COMP STA, COLUMBIA GAS ROCKPORT COMPRESSOR STATION, COLUMBIA GAS - ROCKPORT CS, COLUMBIA GAS TRANS - ROCKPORT COMPRESSOR
47.5%Utility gas
21.1%Electricity
16.5%Wood
15.5%Bottled, tank, or LP gas
Population in 1990: 1,068.
Place of birth for U.S.-born residents:
This state: 777
Midwest: 26
South: 12
72% of the 26169 zip code residents lived in the same house 5 years ago. Out of people who lived in different houses, 74% lived in this county. Out of people who lived in different counties, 50% lived in West Virginia.
101% of the 26169 zip code residents lived in the same house 1 year ago.
Private vs. public school enrollment:
Students in private schools in grades 1 to 8 (elementary and middle school):
Here:
0.0%
West Virginia:
12.2%
Students in private undergraduate colleges:
Here:
0.0%
West Virginia:
17.3%
Occupation by median earnings in the past 12 months ($)
55,061Construction and extraction occupations
45,158Production occupations
42,001Health technologists and technicians
Top industries in this zip code by the number of employees in 2005:
Construction: New Single-Family Housing Construction (except Operative Builders) (5-9 employees: 1 establishment, 1-4 employees: 1 establishment)
Other Services (except Public Administration): Religious Organizations (1-4: 2)
Fatal accident statistics in 2013:
Fatal accident count: 1
Vehicles involved in fatal accidents: 2
Fatal accidents caused by drunken drivers: 0
Fatalities: 1
Persons involved in fatal accidents: 2
Pedestrians involved in fatal accidents: 0
Fatal accident statistics in 2012:
Fatal accident count: 1
Vehicles involved in fatal accidents: 1
Fatal accidents caused by drunken drivers: 1
Fatalities: 1
Persons involved in fatal accidents: 1
Pedestrians involved in fatal accidents: 0
Home Mortgage Disclosure Act Aggregated Statistics For Year 2009 (Based on 2 partial tracts)
A) FHA, FSA/RHS & VA Home Purchase Loans
B) Conventional Home Purchase Loans
C) Refinancings
D) Home Improvement Loans
F) Non-occupant Loans on < 5 Family Dwellings (A B C & D)
G) Loans On Manufactured Home Dwelling (A B C & D)
Number
Average Value
Number
Average Value
Number
Average Value
Number
Average Value
Number
Average Value
Number
Average Value
LOANS ORIGINATED
3
$130,033
4
$108,065
27
$115,487
2
$47,710
1
$64,790
4
$72,450
APPLICATIONS APPROVED, NOT ACCEPTED
0
$0
0
$0
1
$154,000
0
$0
0
$0
0
$0
APPLICATIONS DENIED
0
$0
3
$50,740
10
$87,562
1
$39,500
0
$0
3
$45,120
APPLICATIONS WITHDRAWN
0
$0
2
$89,425
7
$116,656
0
$0
0
$0
2
$72,785
FILES CLOSED FOR INCOMPLETENESS
0
$0
0
$0
1
$112,730
0
$0
0
$0
0
$0
Aggregated Statistics For Year 2008 (Based on 2 partial tracts)
A) FHA, FSA/RHS & VA Home Purchase Loans
B) Conventional Home Purchase Loans
C) Refinancings
D) Home Improvement Loans
F) Non-occupant Loans on < 5 Family Dwellings (A B C & D)
G) Loans On Manufactured Home Dwelling (A B C & D)
Number
Average Value
Number
Average Value
Number
Average Value
Number
Average Value
Number
Average Value
Number
Average Value
LOANS ORIGINATED
1
$191,280
7
$113,486
12
$116,646
4
$54,698
1
$80,770
4
$70,452
APPLICATIONS APPROVED, NOT ACCEPTED
0
$0
1
$150,450
1
$137,130
0
$0
0
$0
0
$0
APPLICATIONS DENIED
0
$0
1
$80,330
10
$112,370
1
$27,070
0
$0
5
$83,612
APPLICATIONS WITHDRAWN
0
$0
1
$110,510
5
$110,418
0
$0
0
$0
0
$0
FILES CLOSED FOR INCOMPLETENESS
0
$0
0
$0
0
$0
0
$0
0
$0
0
$0
Aggregated Statistics For Year 2007 (Based on 2 partial tracts)
A) FHA, FSA/RHS & VA Home Purchase Loans
B) Conventional Home Purchase Loans
C) Refinancings
D) Home Improvement Loans
F) Non-occupant Loans on < 5 Family Dwellings (A B C & D)
G) Loans On Manufactured Home Dwelling (A B C & D)
Number
Average Value
Number
Average Value
Number
Average Value
Number
Average Value
Number
Average Value
Number
Average Value
LOANS ORIGINATED
3
$97,043
12
$110,506
19
$98,500
4
$32,065
1
$248,080
6
$62,945
APPLICATIONS APPROVED, NOT ACCEPTED
0
$0
3
$69,083
2
$53,700
0
$0
0
$0
2
$77,665
APPLICATIONS DENIED
0
$0
1
$133,580
16
$77,970
2
$37,500
0
$0
4
$58,470
APPLICATIONS WITHDRAWN
0
$0
0
$0
3
$86,837
0
$0
0
$0
0
$0
FILES CLOSED FOR INCOMPLETENESS
0
$0
1
$122,930
1
$116,280
0
$0
0
$0
0
$0
Aggregated Statistics For Year 2006 (Based on 2 partial tracts)
A) FHA, FSA/RHS & VA Home Purchase Loans
B) Conventional Home Purchase Loans
C) Refinancings
D) Home Improvement Loans
G) Loans On Manufactured Home Dwelling (A B C & D)
Number
Average Value
Number
Average Value
Number
Average Value
Number
Average Value
Number
Average Value
LOANS ORIGINATED
2
$106,735
9
$120,467
19
$79,767
10
$26,095
6
$79,292
APPLICATIONS APPROVED, NOT ACCEPTED
0
$0
2
$95,860
1
$62,130
0
$0
1
$45,270
APPLICATIONS DENIED
0
$0
2
$44,160
17
$83,695
7
$38,357
4
$68,900
APPLICATIONS WITHDRAWN
0
$0
0
$0
7
$102,391
0
$0
2
$67,015
FILES CLOSED FOR INCOMPLETENESS
0
$0
0
$0
0
$0
0
$0
0
$0
Aggregated Statistics For Year 2005 (Based on 2 partial tracts)
A) FHA, FSA/RHS & VA Home Purchase Loans
B) Conventional Home Purchase Loans
C) Refinancings
D) Home Improvement Loans
F) Non-occupant Loans on < 5 Family Dwellings (A B C & D)
G) Loans On Manufactured Home Dwelling (A B C & D)
Number
Average Value
Number
Average Value
Number
Average Value
Number
Average Value
Number
Average Value
Number
Average Value
LOANS ORIGINATED
2
$99,635
12
$102,888
15
$76,511
5
$32,664
1
$47,040
5
$62,044
APPLICATIONS APPROVED, NOT ACCEPTED
0
$0
0
$0
3
$60,653
0
$0
0
$0
0
$0
APPLICATIONS DENIED
2
$29,290
1
$17,750
12
$94,752
7
$40,069
1
$23,970
5
$33,108
APPLICATIONS WITHDRAWN
0
$0
2
$71,675
8
$105,125
2
$45,935
0
$0
1
$123,380
FILES CLOSED FOR INCOMPLETENESS
0
$0
0
$0
2
$57,250
0
$0
0
$0
0
$0
Aggregated Statistics For Year 2004 (Based on 2 partial tracts)
A) FHA, FSA/RHS & VA Home Purchase Loans
B) Conventional Home Purchase Loans
C) Refinancings
D) Home Improvement Loans
F) Non-occupant Loans on < 5 Family Dwellings (A B C & D)
G) Loans On Manufactured Home Dwelling (A B C & D)
Number
Average Value
Number
Average Value
Number
Average Value
Number
Average Value
Number
Average Value
Number
Average Value
LOANS ORIGINATED
2
$96,305
9
$88,562
27
$75,495
6
$26,185
2
$46,820
9
$44,281
APPLICATIONS APPROVED, NOT ACCEPTED
0
$0
1
$96,300
2
$80,330
1
$28,400
0
$0
0
$0
APPLICATIONS DENIED
0
$0
3
$99,410
11
$80,570
5
$30,622
0
$0
4
$34,505
APPLICATIONS WITHDRAWN
0
$0
0
$0
7
$88,950
0
$0
0
$0
0
$0
FILES CLOSED FOR INCOMPLETENESS
0
$0
0
$0
2
$115,390
0
$0
0
$0
0
$0
Aggregated Statistics For Year 2003 (Based on 2 partial tracts)
A) FHA, FSA/RHS & VA Home Purchase Loans
B) Conventional Home Purchase Loans
C) Refinancings
D) Home Improvement Loans
F) Non-occupant Loans on < 5 Family Dwellings (A B C & D)
Number
Average Value
Number
Average Value
Number
Average Value
Number
Average Value
Number
Average Value
LOANS ORIGINATED
1
$62,130
11
$79,683
24
$78,090
4
$17,308
1
$64,350
APPLICATIONS APPROVED, NOT ACCEPTED
0
$0
3
$91,867
6
$84,470
0
$0
0
$0
APPLICATIONS DENIED
0
$0
3
$49,263
12
$68,604
1
$14,200
0
$0
APPLICATIONS WITHDRAWN
0
$0
1
$96,750
6
$90,683
0
$0
0
$0
FILES CLOSED FOR INCOMPLETENESS
0
$0
0
$0
1
$56,810
0
$0
0
$0
Aggregated Statistics For Year 2002 (Based on 2 partial tracts)
A) FHA, FSA/RHS & VA Home Purchase Loans
B) Conventional Home Purchase Loans
C) Refinancings
D) Home Improvement Loans
F) Non-occupant Loans on < 5 Family Dwellings (A B C & D)
Number
Average Value
Number
Average Value
Number
Average Value
Number
Average Value
Number
Average Value
LOANS ORIGINATED
0
$0
12
$72,302
28
$73,798
3
$18,047
1
$24,850
APPLICATIONS APPROVED, NOT ACCEPTED
0
$0
1
$71,010
2
$78,110
1
$5,770
0
$0
APPLICATIONS DENIED
1
$73,230
3
$41,273
11
$58,299
0
$0
0
$0
APPLICATIONS WITHDRAWN
0
$0
0
$0
6
$68,493
0
$0
0
$0
FILES CLOSED FOR INCOMPLETENESS
0
$0
0
$0
4
$60,245
0
$0
0
$0
Aggregated Statistics For Year 2001 (Based on 2 partial tracts)
A) FHA, FSA/RHS & VA Home Purchase Loans
B) Conventional Home Purchase Loans
C) Refinancings
D) Home Improvement Loans
Number
Average Value
Number
Average Value
Number
Average Value
Number
Average Value
LOANS ORIGINATED
1
$66,570
10
$82,103
22
$70,161
3
$32,693
APPLICATIONS APPROVED, NOT ACCEPTED
0
$0
2
$47,265
2
$56,140
0
$0
APPLICATIONS DENIED
0
$0
4
$41,828
10
$58,848
2
$11,760
APPLICATIONS WITHDRAWN
0
$0
1
$100,300
5
$68,168
1
$62,130
FILES CLOSED FOR INCOMPLETENESS
0
$0
0
$0
1
$53,700
0
$0
Aggregated Statistics For Year 2000 (Based on 2 partial tracts)
B) Conventional Home Purchase Loans
C) Refinancings
D) Home Improvement Loans
F) Non-occupant Loans on < 5 Family Dwellings (A B C & D)
Number
Average Value
Number
Average Value
Number
Average Value
Number
Average Value
LOANS ORIGINATED
11
$51,117
13
$65,205
2
$17,310
2
$35,060
APPLICATIONS APPROVED, NOT ACCEPTED
4
$44,158
3
$47,487
0
$0
0
$0
APPLICATIONS DENIED
12
$44,824
8
$39,720
1
$5,330
0
$0
APPLICATIONS WITHDRAWN
2
$55,695
3
$45,417
0
$0
0
$0
FILES CLOSED FOR INCOMPLETENESS
0
$0
0
$0
0
$0
0
$0
Aggregated Statistics For Year 1999 (Based on 1 partial tract)
Detailed PMIC statistics for the following Tracts:0108.00
2003 - 2018 National Fire Incident Reporting System (NFIRS) incidents
According to the data from the years 2003 - 2018 the average number of fire incidents per year is 7. The highest number of reported fires - 13 took place in 2018, and the least - 2 in 2003. The data has a growing trend.
When looking into fire subcategories, the most incidents belonged to: Structure Fires (40.0%), and Mobile Property/Vehicle Fires (34.8%).
Fire incident types reported to NFIRS in Zip Code 26169

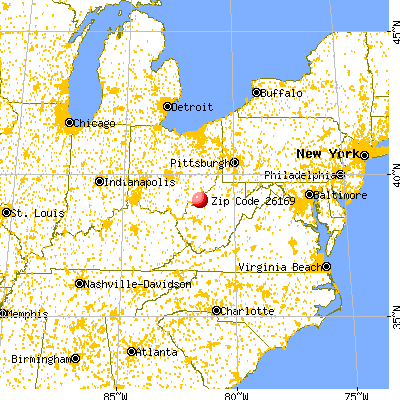


 Nearest zip codes: 26150, 26133, 25252, 26164, 25275, 26181.


 According to the data from the years 2003 - 2018 the average number of fire incidents per year is 7. The highest number of reported fires - 13 took place in 2018, and the least - 2 in 2003. The data has a growing trend.
 When looking into fire subcategories, the most incidents belonged to: Structure Fires (40.0%), and Mobile Property/Vehicle Fires (34.8%).