Estimated zip code population in 2022: 1,797 Zip code population in 2010: 1,936 Zip code population in 2000: 1,824
Houses and condos: 1,054 Renter-occupied apartments: 67
% of renters here:
8%
State:
33%
March 2022 cost of living index in zip code 27016: 81.1 (low, U.S. average is 100)
Land area: 40.0 sq. mi. Water area: 0.3 sq. mi.
Population density: 45 people per square mile
(very low).
OSM Map
General Map
Google Map
MSN Map
OSM Map
General Map
Google Map
MSN Map
OSM Map
General Map
Google Map
MSN Map
OSM Map
General Map
Google Map
MSN Map
Please wait while loading the map...
Real estate property taxes paid for housing units in 2022:
This zip code:
0.4% ($766)
North Carolina:
0.6% ($1,769)
Median real estate property taxes paid for housing units with mortgages in 2022: $547 (0.3%) Median real estate property taxes paid for housing units with no mortgage in 2022: $1,161 (0.6%)
Business Search- 14 Million verified businesses
Males: 953
(53.1%)
Females: 843
(46.9%)
For population 25 years and over in 27016:
High school or higher: 87.0%
Bachelor's degree or higher: 9.2%
Graduate or professional degree: 3.3%
Unemployed: 0.8%
Mean travel time to work (commute): 27.8 minutes
For population 15 years and over in 27016:
Never married: 13.8%
Now married: 63.4%
Separated: 6.1%
Widowed: 7.1%
Divorced: 9.6%
Zip code 27016 compared to state average:
Median house value below state average.
Unemployed percentage significantly below state average.
Black race population percentage significantly below state average.
Hispanic race population percentage significantly below state average.
Median age significantly above state average.
Foreign-born population percentage significantly below state average.
Renting percentage significantly below state average.
Length of stay since moving in significantly above state average.
Number of college students below state average.
Percentage of population with a bachelor's degree or higher significantly below state average.
Estimated median house/condo value in 2022: $182,288
27016:
$182,288
North Carolina:
$280,600
According to our research of North Carolina and other state lists, there were 7 registered sex offenders living in 27016 zip code as of May 28, 2024. The ratio of all residents to sex offenders in zip code 27016 is 241 to 1.
Median resident age:
This zip code:
47.5 years
North Carolina median age:
39.2 years
Average household size:
This zip code:
1.9 people
North Carolina:
2.4 people
Averages for the 2020 tax year for zip code 27016, filed in 2021:
Average Adjusted Gross Income (AGI) in 2020: $51,177 (Individual Income Tax Returns)
Here:
$51,177
State:
$70,020
Salary/wage: $43,974 (reported on 77.0% of returns)
Here:
$43,974
State:
$58,387
(% of AGI for various income ranges: 1356.9% for AGIs below $25k, 3354.3% for AGIs $25k-50k, 6781.2% for AGIs $50k-75k, 9312.0% for AGIs $75k-100k, 16234.0% for AGIs $100k-200k)
Taxable interest for individuals: $670 (reported on 31.1% of returns)
This zip code:
$670
North Carolina:
$1,479
(% of AGI for various income ranges: 25.0% for AGIs below $25k, 21.4% for AGIs $25k-50k, 40.0% for AGIs $50k-75k, 10.0% for AGIs $75k-100k, 94.0% for AGIs $100k-200k)
Ordinary dividends: $3,000 (reported on 16.2% of returns)
Here:
$3,000
State:
$7,888
(% of AGI for various income ranges: 18.1% for AGIs below $25k, 15.7% for AGIs $25k-50k, 138.8% for AGIs $50k-75k, 396.0% for AGIs $100k-200k)
Net capital gain/loss in AGI: +$2,590 (reported on 13.5% of returns)
Here:
+$2,590
State:
+$23,652
(% of AGI for various income ranges: 45.0% for AGIs $50k-75k, 450.0% for AGIs $100k-200k)
Profit/loss from business: +$6,400 (reported on 13.5% of returns)
Here:
+$6,400
State:
+$11,710
(% of AGI for various income ranges: 78.8% for AGIs below $25k, 244.3% for AGIs $25k-50k, 344.0% for AGIs $75k-100k)
Taxable individual retirement arrangement distribution: $15,500 (reported on 10.8% of returns)
27016:
$15,500
North Carolina:
$20,247
(% of AGI for various income ranges: 195.0% for AGIs $25k-50k, 421.3% for AGIs $50k-75k, 1260.0% for AGIs $75k-100k)
Earned income credit: $1,925 (reported on 16.2% of returns)
Here:
$1,925
State:
$2,337
(% of AGI for various income ranges: 83.8% for AGIs below $25k, 69.3% for AGIs $25k-50k)
Percentage of individuals using paid preparers for their 2020 taxes: 90.5%
Here:
91%
State:
93%
(% for various income ranges: 92.0% for AGIs below $25k, 89.5% for AGIs $25k-50k, 84.6% for AGIs $50k-75k, 100.0% for AGIs $75k-100k, 90.0% for AGIs $100k-200k)
Averages for the 2012 tax year for zip code 27016, filed in 2013:
Average Adjusted Gross Income (AGI) in 2012: $41,103 (Individual Income Tax Returns)
Here:
$41,103
State:
$54,937
Salary/wage: $37,184 (reported on 82.4% of returns)
Here:
$37,184
State:
$46,336
(% of AGI for various income ranges: 66.7% for AGIs below $25k, 77.4% for AGIs $25k-50k, 77.2% for AGIs $50k-75k, 78.9% for AGIs $75k-100k, 66.7% for AGIs $100k-200k)
Taxable interest for individuals: $654 (reported on 38.2% of returns)
This zip code:
$654
North Carolina:
$1,298
(% of AGI for various income ranges: 2.4% for AGIs below $25k, 0.6% for AGIs $25k-50k, 0.4% for AGIs $50k-75k, 0.3% for AGIs $75k-100k, 0.2% for AGIs $100k-200k)
Ordinary dividends: $1,091 (reported on 16.2% of returns)
Here:
$1,091
State:
$6,213
(% of AGI for various income ranges: 0.6% for AGIs below $25k, 0.4% for AGIs $25k-50k, 0.7% for AGIs $50k-75k, 0.5% for AGIs $75k-100k)
Net capital gain/loss in AGI: +$1,991 (reported on 16.2% of returns)
Here:
+$1,991
State:
+$12,740
(% of AGI for various income ranges: 2.5% for AGIs below $25k, 0.4% for AGIs $25k-50k, 1.1% for AGIs $50k-75k, 0.7% for AGIs $75k-100k)
Profit/loss from business: +$4,127 (reported on 16.2% of returns)
Here:
+$4,127
State:
+$10,311
(% of AGI for various income ranges: 4.9% for AGIs below $25k, 3.4% for AGIs $25k-50k, 0.7% for AGIs $50k-75k)
Taxable individual retirement arrangement distribution: $7,657 (reported on 10.3% of returns)
27016:
$7,657
North Carolina:
$15,575
Total itemized deductions: $16,893 (24% of AGI, reported on 22.1% of returns)
Here:
$16,893
State:
$23,438
Here:
24.2% of AGI
State:
21.5% of AGI
(% of AGI for various income ranges: 9.1% for AGIs below $25k, 7.4% for AGIs $25k-50k, 6.8% for AGIs $50k-75k, 11.0% for AGIs $75k-100k, 12.2% for AGIs $100k-200k)
Charity contributions: $2,850 (reported on 17.6% of returns)
Here:
$2,850
State:
$4,687
(% of AGI for various income ranges: 1.4% for AGIs $25k-50k, 1.1% for AGIs $50k-75k, 1.5% for AGIs $75k-100k, 1.5% for AGIs $100k-200k)
Taxes paid: $5,367 (reported on 22.1% of returns)
27016:
$5,367
State:
$8,823
(% of AGI for various income ranges: 1.1% for AGIs below $25k, 1.8% for AGIs $25k-50k, 2.1% for AGIs $50k-75k, 3.9% for AGIs $75k-100k, 5.4% for AGIs $100k-200k)
Earned income credit: $1,893 (reported on 22.1% of returns)
Here:
$1,893
State:
$2,376
(% of AGI for various income ranges: 6.3% for AGIs below $25k, 1.2% for AGIs $25k-50k)
Percentage of individuals using paid preparers for their 2012 taxes: 70.6%
Here:
71%
State:
53%
(% for various income ranges: 65.4% for AGIs below $25k, 71.4% for AGIs $25k-50k, 72.7% for AGIs $50k-75k, 83.3% for AGIs $75k-100k, 75.0% for AGIs $100k-200k)
Averages for the 2004 tax year for zip code 27016, filed in 2005:
Average Adjusted Gross Income (AGI) in 2004: $33,303 (Individual Income Tax Returns)
Here:
$33,303
State:
$45,376
Salary/wage: $33,407 (reported on 82.7% of returns)
Here:
$33,407
State:
$39,442
(% of AGI for various income ranges: 86.4% for AGIs below $10k, 75.4% for AGIs $10k-25k, 86.0% for AGIs $25k-50k, 91.6% for AGIs $50k-75k, 85.7% for AGIs $75k-100k, 59.2% for AGIs over 100k)
Taxable interest for individuals: $807 (reported on 39.8% of returns)
This zip code:
$807
North Carolina:
$1,515
(% of AGI for various income ranges: 7.0% for AGIs below $10k, 2.4% for AGIs $10k-25k, 0.8% for AGIs $25k-50k, 0.5% for AGIs $50k-75k, 0.2% for AGIs $75k-100k, 0.7% for AGIs over 100k)
Taxable dividends: $638 (reported on 18.6% of returns)
Here:
$638
State:
$4,016
(% of AGI for various income ranges: 1.9% for AGIs below $10k, 0.3% for AGIs $10k-25k, 0.4% for AGIs $25k-50k, 0.1% for AGIs $50k-75k, 0.3% for AGIs $75k-100k, 0.7% for AGIs over 100k)
Net capital gain/loss: +$7,289 (reported on 11.9% of returns)
Here:
+$7,289
State:
+$11,152
(% of AGI for various income ranges: 0.3% for AGIs below $10k, 0.1% for AGIs $10k-25k, 0.9% for AGIs $25k-50k, 1.2% for AGIs $50k-75k, 17.4% for AGIs over 100k)
Profit/loss from business: +$3,669 (reported on 17.6% of returns)
Here:
+$3,669
State:
+$9,490
(% of AGI for various income ranges: 4.6% for AGIs below $10k, 5.0% for AGIs $10k-25k, 1.2% for AGIs $25k-50k, -0.4% for AGIs $50k-75k, 5.9% for AGIs $75k-100k)
Total itemized deductions: $13,804 (22% of AGI, reported on 20.9% of returns)
Here:
$13,804
State:
$19,464
Here:
22.1% of AGI
State:
22.7% of AGI
(% of AGI for various income ranges: 4.6% for AGIs $10k-25k, 7.4% for AGIs $25k-50k, 9.4% for AGIs $50k-75k, 12.3% for AGIs $75k-100k, 12.1% for AGIs over 100k)
Charity contributions deductions: $2,630 (4% of AGI, reported on 16.8% of returns)
Here:
$2,630
State:
$4,035
Here:
4.0% of AGI
State:
4.5% of AGI
(% of AGI for various income ranges: 2.2% for AGIs below $10k, 1.3% for AGIs $25k-50k, 1.3% for AGIs $50k-75k, 2.0% for AGIs $75k-100k, 2.0% for AGIs over 100k)
Total tax: $3,838 (reported on 72.4% of returns)
27016:
$3,838
State:
$7,257
(% of AGI for various income ranges: 4.0% for AGIs below $10k, 4.3% for AGIs $10k-25k, 6.9% for AGIs $25k-50k, 8.5% for AGIs $50k-75k, 10.6% for AGIs $75k-100k, 14.8% for AGIs over 100k)
Earned income credit: $1,731 (reported on 17.2% of returns)
Here:
$1,731
State:
$1,851
Percentage of individuals using paid preparers for their 2004 taxes: 70.7%
Here:
71%
State:
62%
(% for various income ranges: 63.1% for AGIs below $10k, 69.5% for AGIs $10k-25k, 73.3% for AGIs $25k-50k, 75.9% for AGIs $50k-75k, 68.2% for AGIs $75k-100k, 95.0% for AGIs over 100k)
Household received Food Stamps/SNAP in the past 12 months: 38 Household did not receive Food Stamps/SNAP in the past 12 months: 817
Women who had a birth in the past 12 months: 13 (7 now married, 5 unmarried) Women who did not have a birth in the past 12 months: 366 (322 now married, 47 unmarried)
Housing units in zip code 27016 with a mortgage: 450 (50 second mortgage, 52 both second mortgage and home equity loan) Median monthly owner costs for units with a mortgage: $772 Median monthly owner costs for units without a mortgage: $404
Residents with income below the poverty level in 2022:
This zip code:
13.5%
Whole state:
12.8%
Residents with income below 50% of the poverty level in 2022:
This zip code:
7.0%
Whole state:
6.8%
Median number of rooms in houses and condos:
Here:
5.5
State:
6.4
Median number of rooms in apartments:
Here:
4.5
State:
4.4
Notable locations in this zip code not listed on our city pages
Notable locations in zip code 27016: Hoover Whitts Store Site (A), Davis Ford (B), Hanging Rock State Park Site (C), Danbury Courthouse Square (D), Stokes County Courthouse (E). Display/hide their locations on the map
Churches in zip code 27016 include: Lawsonville Church (A), Snow Hill United Methodist Church (B), North View Church (C), Piney Grove Primitive Baptist Church (D), Pleasant View Primitive Baptist Church (E), Spencer-Hill Memorial Church (F). Display/hide their locations on the map
Streams, rivers, and creeks: Buck Island Creek (A), Bonds Branch (B), Snow Creek (C), Seven Island Creek (D), Scott Branch (E), Sandy Run (F), Newman Branch (G). Display/hide their locations on the map
In group quarters: 119 (-1 institutionalized population)
Size of family households: 400 2-persons, 59 3-persons, 89 4-persons, 31 5-persons
Size of nonfamily households: 266 1-person, 18 2-persons
244 married couples with children.
0 single-parent households ().
98.6% of residents of 27016 zip code speak English at home.
1.1% of residents speak Spanish at home (100% well).
Foreign born population: 1 (0.1%) (0.0% of them are naturalized citizens)
:
0.1%
Whole state:
8.6%
34%English
21%American
12%European
10%Scottish
6%German
1%Scotch-Irish
1%Swedish
Year of entry for the foreign-born population
12010 or later
02000 to 2009
01990 to 1999
3Before 1990
Facilities with environmental interests located in this zip code:
BILL HANKS LUMBER CO (PINEY GROVE ROAD in DANBURY, NC)
STATE MASTER (North Carolina facility info) - -115DA4YG00M69W84AY3VG2889Q, WASTEWATER FACILITY National Pollutant Discharge Elimination System NON-MAJOR (Tracking pollutant discharge elimination systems) - permit National Pollutant Discharge Elimination System NON-MAJOR (Tracking pollutant discharge elimination systems) - permit Business SIC classification: SAWMILLS AND PLANING MILLS, GENERAL
Housing units lacking complete plumbing facilities: 5.8% Housing units lacking complete kitchen facilities: 5.7%
74.6%Electricity
10.4%Fuel oil, kerosene, etc.
6.6%Bottled, tank, or LP gas
6.3%Wood
2.3%Utility gas
Population in 1990: 1,560. Population change in the 1990s: +264 (+16.9%).
Place of birth for U.S.-born residents:
This state: 1,272
Northeast: 42
Midwest: 28
South: 382
West: 48
69% of the 27016 zip code residents lived in the same house 5 years ago. Out of people who lived in different houses, 71% lived in this county. Out of people who lived in different counties, 50% lived in North Carolina.
98% of the 27016 zip code residents lived in the same house 1 year ago. Out of people who lived in different houses, 62% moved from this county. Out of people who lived in different houses, 26% moved from different county within same state. Out of people who lived in different houses, 35% moved from different state.
Private vs. public school enrollment:
Students in private schools in grades 1 to 8 (elementary and middle school):
Here:
0.0%
North Carolina:
13.8%
Students in private schools in grades 9 to 12 (high school): 3
Here:
3.1%
North Carolina:
11.9%
Students in private undergraduate colleges:
Here:
0.0%
North Carolina:
19.3%
Occupation by median earnings in the past 12 months ($)
58,159Management occupations
47,778Sales and related occupations
40,294Business and financial operations occupations
36,391Office and administrative support occupations
32,273Community and social service occupations
28,950Construction and extraction occupations
Top industries in this zip code by the number of employees in 2005:
Health Care and Social Assistance: General Medical and Surgical Hospitals (250-499 employees: 1 establishment)
Health Care and Social Assistance: Outpatient Mental Health and Substance Abuse Centers (10-19: 1, 1-4: 1)
Finance and Insurance: Commercial Banking (5-9: 1, 1-4: 1)
Other Services (except Public Administration): Professional Organizations (5-9: 1)
Construction: Water and Sewer Line and Related Structures Construction (5-9: 1)
Professional, Scientific, and Technical Services: Engineering Services (5-9: 1)
People in group quarters in 2010:
79 people in local jails and other municipal confinement facilities
46 people in nursing facilities/skilled-nursing facilities
3 people in workers' group living quarters and job corps centers
People in group quarters in 2000:
39 people in nursing homes
35 people in hospitals/wards and hospices for chronically ill
35 people in other hospitals or wards for chronically ill
33 people in local jails and other confinement facilities (including police lockups)
12 people in unknown juvenile institutions
Fatal accident statistics in 2014:
Fatal accident count: 1
Vehicles involved in fatal accidents: 2
Fatal accidents caused by drunken drivers: 0
Fatalities: 1
Persons involved in fatal accidents: 2
Pedestrians involved in fatal accidents: 0
Fatal accident statistics in 2013:
Fatal accident count: 1
Vehicles involved in fatal accidents: 2
Fatal accidents caused by drunken drivers: 1
Fatalities: 2
Persons involved in fatal accidents: 4
Pedestrians involved in fatal accidents: 0
Home Mortgage Disclosure Act Aggregated Statistics For Year 2009 (Based on 2 partial tracts)
A) FHA, FSA/RHS & VA Home Purchase Loans
B) Conventional Home Purchase Loans
C) Refinancings
D) Home Improvement Loans
F) Non-occupant Loans on < 5 Family Dwellings (A B C & D)
G) Loans On Manufactured Home Dwelling (A B C & D)
Number
Average Value
Number
Average Value
Number
Average Value
Number
Average Value
Number
Average Value
Number
Average Value
LOANS ORIGINATED
7
$88,451
8
$154,075
38
$128,346
4
$41,565
3
$105,377
7
$43,407
APPLICATIONS APPROVED, NOT ACCEPTED
0
$0
1
$54,050
2
$128,175
0
$0
0
$0
1
$54,050
APPLICATIONS DENIED
2
$160,935
1
$28,670
25
$118,493
4
$12,695
1
$28,670
5
$56,838
APPLICATIONS WITHDRAWN
2
$101,965
1
$113,020
7
$97,579
0
$0
1
$29,480
1
$66,340
FILES CLOSED FOR INCOMPLETENESS
0
$0
0
$0
2
$106,880
0
$0
0
$0
0
$0
Aggregated Statistics For Year 2008 (Based on 2 partial tracts)
A) FHA, FSA/RHS & VA Home Purchase Loans
B) Conventional Home Purchase Loans
C) Refinancings
D) Home Improvement Loans
F) Non-occupant Loans on < 5 Family Dwellings (A B C & D)
G) Loans On Manufactured Home Dwelling (A B C & D)
Number
Average Value
Number
Average Value
Number
Average Value
Number
Average Value
Number
Average Value
Number
Average Value
LOANS ORIGINATED
7
$91,611
10
$143,325
30
$116,899
3
$7,370
2
$87,225
7
$68,094
APPLICATIONS APPROVED, NOT ACCEPTED
0
$0
0
$0
6
$74,393
1
$12,290
0
$0
2
$38,495
APPLICATIONS DENIED
3
$71,527
5
$75,184
22
$113,730
8
$27,744
2
$42,180
7
$68,094
APPLICATIONS WITHDRAWN
2
$80,670
4
$239,148
11
$104,535
3
$28,120
3
$110,837
3
$101,830
FILES CLOSED FOR INCOMPLETENESS
0
$0
0
$0
2
$128,175
0
$0
0
$0
0
$0
Aggregated Statistics For Year 2007 (Based on 2 partial tracts)
A) FHA, FSA/RHS & VA Home Purchase Loans
B) Conventional Home Purchase Loans
C) Refinancings
D) Home Improvement Loans
F) Non-occupant Loans on < 5 Family Dwellings (A B C & D)
G) Loans On Manufactured Home Dwelling (A B C & D)
Number
Average Value
Number
Average Value
Number
Average Value
Number
Average Value
Number
Average Value
Number
Average Value
LOANS ORIGINATED
1
$122,850
11
$160,375
37
$90,444
16
$43,919
3
$104,013
9
$61,334
APPLICATIONS APPROVED, NOT ACCEPTED
0
$0
4
$101,555
7
$70,083
0
$0
2
$40,950
2
$69,615
APPLICATIONS DENIED
2
$75,350
6
$139,367
36
$103,012
9
$43,407
1
$22,930
11
$79,517
APPLICATIONS WITHDRAWN
0
$0
3
$125,307
19
$103,065
2
$56,100
1
$98,280
3
$64,427
FILES CLOSED FOR INCOMPLETENESS
1
$122,850
1
$113,840
3
$177,177
0
$0
0
$0
0
$0
Aggregated Statistics For Year 2006 (Based on 2 partial tracts)
A) FHA, FSA/RHS & VA Home Purchase Loans
B) Conventional Home Purchase Loans
C) Refinancings
D) Home Improvement Loans
F) Non-occupant Loans on < 5 Family Dwellings (A B C & D)
G) Loans On Manufactured Home Dwelling (A B C & D)
Number
Average Value
Number
Average Value
Number
Average Value
Number
Average Value
Number
Average Value
Number
Average Value
LOANS ORIGINATED
0
$0
23
$86,137
29
$96,924
10
$26,454
5
$63,226
10
$62,162
APPLICATIONS APPROVED, NOT ACCEPTED
0
$0
5
$136,774
11
$88,303
3
$47,777
0
$0
6
$62,380
APPLICATIONS DENIED
1
$81,080
17
$92,306
34
$89,102
8
$38,186
2
$54,055
17
$75,830
APPLICATIONS WITHDRAWN
1
$166,260
4
$73,505
20
$86,610
2
$31,940
2
$58,150
4
$94,800
FILES CLOSED FOR INCOMPLETENESS
0
$0
2
$75,350
4
$101,965
0
$0
1
$56,510
0
$0
Aggregated Statistics For Year 2005 (Based on 2 partial tracts)
A) FHA, FSA/RHS & VA Home Purchase Loans
B) Conventional Home Purchase Loans
C) Refinancings
D) Home Improvement Loans
F) Non-occupant Loans on < 5 Family Dwellings (A B C & D)
G) Loans On Manufactured Home Dwelling (A B C & D)
Number
Average Value
Number
Average Value
Number
Average Value
Number
Average Value
Number
Average Value
Number
Average Value
LOANS ORIGINATED
7
$76,519
14
$147,771
37
$99,475
6
$43,270
6
$87,360
13
$74,781
APPLICATIONS APPROVED, NOT ACCEPTED
0
$0
6
$72,208
7
$82,369
0
$0
1
$65,520
5
$82,064
APPLICATIONS DENIED
2
$90,910
13
$84,483
43
$105,099
8
$48,526
6
$71,253
21
$100,035
APPLICATIONS WITHDRAWN
3
$92,820
4
$161,958
20
$95,496
4
$135,545
0
$0
7
$70,551
FILES CLOSED FOR INCOMPLETENESS
0
$0
2
$153,155
8
$105,549
0
$0
0
$0
1
$49,140
Aggregated Statistics For Year 2004 (Based on 2 partial tracts)
A) FHA, FSA/RHS & VA Home Purchase Loans
B) Conventional Home Purchase Loans
C) Refinancings
D) Home Improvement Loans
F) Non-occupant Loans on < 5 Family Dwellings (A B C & D)
G) Loans On Manufactured Home Dwelling (A B C & D)
Number
Average Value
Number
Average Value
Number
Average Value
Number
Average Value
Number
Average Value
Number
Average Value
LOANS ORIGINATED
4
$105,038
16
$91,062
38
$99,918
6
$56,375
2
$33,170
11
$64,404
APPLICATIONS APPROVED, NOT ACCEPTED
1
$48,320
5
$83,046
8
$93,775
2
$53,645
0
$0
4
$69,000
APPLICATIONS DENIED
2
$84,355
12
$99,713
38
$95,478
5
$65,848
0
$0
21
$76,245
APPLICATIONS WITHDRAWN
1
$62,240
2
$75,350
13
$100,422
1
$8,190
1
$49,140
1
$49,140
FILES CLOSED FOR INCOMPLETENESS
0
$0
0
$0
2
$135,545
0
$0
0
$0
0
$0
Aggregated Statistics For Year 2003 (Based on 2 partial tracts)
A) FHA, FSA/RHS & VA Home Purchase Loans
B) Conventional Home Purchase Loans
C) Refinancings
D) Home Improvement Loans
F) Non-occupant Loans on < 5 Family Dwellings (A B C & D)
Number
Average Value
Number
Average Value
Number
Average Value
Number
Average Value
Number
Average Value
LOANS ORIGINATED
4
$96,438
16
$90,295
61
$93,380
7
$16,614
6
$43,680
APPLICATIONS APPROVED, NOT ACCEPTED
0
$0
4
$86,610
10
$107,371
1
$2,460
1
$40,950
APPLICATIONS DENIED
0
$0
9
$53,872
42
$97,208
4
$12,695
0
$0
APPLICATIONS WITHDRAWN
1
$85,180
1
$40,950
21
$107,016
0
$0
0
$0
FILES CLOSED FOR INCOMPLETENESS
0
$0
0
$0
1
$36,040
0
$0
0
$0
Aggregated Statistics For Year 2002 (Based on 2 partial tracts)
A) FHA, FSA/RHS & VA Home Purchase Loans
B) Conventional Home Purchase Loans
C) Refinancings
D) Home Improvement Loans
F) Non-occupant Loans on < 5 Family Dwellings (A B C & D)
Number
Average Value
Number
Average Value
Number
Average Value
Number
Average Value
Number
Average Value
LOANS ORIGINATED
1
$65,520
16
$115,786
59
$91,089
8
$14,435
6
$32,213
APPLICATIONS APPROVED, NOT ACCEPTED
0
$0
2
$69,615
12
$92,683
0
$0
0
$0
APPLICATIONS DENIED
1
$67,980
11
$48,991
26
$86,877
2
$14,740
0
$0
APPLICATIONS WITHDRAWN
0
$0
2
$81,490
22
$83,724
1
$4,100
0
$0
FILES CLOSED FOR INCOMPLETENESS
0
$0
0
$0
2
$53,235
0
$0
0
$0
Aggregated Statistics For Year 2001 (Based on 2 partial tracts)
A) FHA, FSA/RHS & VA Home Purchase Loans
B) Conventional Home Purchase Loans
C) Refinancings
D) Home Improvement Loans
F) Non-occupant Loans on < 5 Family Dwellings (A B C & D)
Number
Average Value
Number
Average Value
Number
Average Value
Number
Average Value
Number
Average Value
LOANS ORIGINATED
2
$74,940
16
$87,275
51
$84,180
7
$10,413
3
$48,593
APPLICATIONS APPROVED, NOT ACCEPTED
0
$0
6
$47,093
9
$71,526
1
$22,110
0
$0
APPLICATIONS DENIED
0
$0
14
$58,149
28
$63,092
5
$15,234
0
$0
APPLICATIONS WITHDRAWN
1
$63,060
2
$49,960
11
$99,545
0
$0
0
$0
FILES CLOSED FOR INCOMPLETENESS
0
$0
0
$0
2
$87,225
0
$0
0
$0
Aggregated Statistics For Year 2000 (Based on 2 partial tracts)
A) FHA, FSA/RHS & VA Home Purchase Loans
B) Conventional Home Purchase Loans
C) Refinancings
D) Home Improvement Loans
F) Non-occupant Loans on < 5 Family Dwellings (A B C & D)
Number
Average Value
Number
Average Value
Number
Average Value
Number
Average Value
Number
Average Value
LOANS ORIGINATED
0
$0
18
$77,623
27
$72,830
5
$16,052
2
$86,815
APPLICATIONS APPROVED, NOT ACCEPTED
2
$79,445
7
$56,629
6
$60,197
1
$4,100
0
$0
APPLICATIONS DENIED
2
$66,340
24
$75,860
23
$54,339
2
$49,960
2
$305,485
APPLICATIONS WITHDRAWN
1
$87,630
2
$64,290
8
$91,728
1
$28,670
1
$28,670
FILES CLOSED FOR INCOMPLETENESS
0
$0
0
$0
2
$74,940
0
$0
0
$0
Aggregated Statistics For Year 1999 (Based on 1 partial tract)
A) FHA, FSA/RHS & VA Home Purchase Loans
B) Conventional Home Purchase Loans
C) Refinancings
D) Home Improvement Loans
F) Non-occupant Loans on < 5 Family Dwellings (A B C & D)
Detailed PMIC statistics for the following Tracts:0702.00
2002 - 2018 National Fire Incident Reporting System (NFIRS) incidents
Based on the data from the years 2002 - 2018 the average number of fire incidents per year is 12. The highest number of reported fires - 22 took place in 2006, and the least - 3 in 2002. The data has a growing trend.
When looking into fire subcategories, the most reports belonged to: Structure Fires (58.9%), and Other (22.8%).
Fire incident types reported to NFIRS in Zip Code 27016

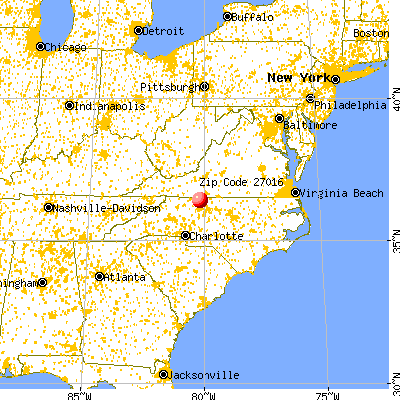


 Nearest zip codes: 27022, 27053, 27052, 27046, 27019, 27021.


 Based on the data from the years 2002 - 2018 the average number of fire incidents per year is 12. The highest number of reported fires - 22 took place in 2006, and the least - 3 in 2002. The data has a growing trend.
 When looking into fire subcategories, the most reports belonged to: Structure Fires (58.9%), and Other (22.8%).