Estimated zip code population in 2022: 3,356 Zip code population in 2010: 3,141 Zip code population in 2000: 2,849
Houses and condos: 1,487 Renter-occupied apartments: 174
% of renters here:
13%
State:
33%
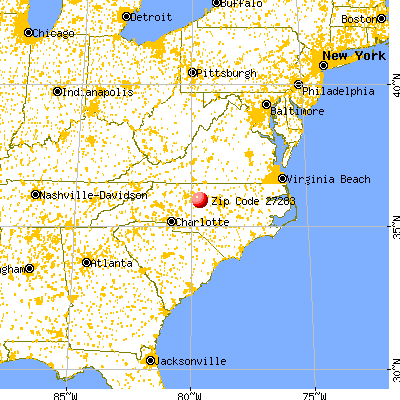
March 2022 cost of living index in zip code 27283: 81.0 (low, U.S. average is 100)
Land area: 26.3 sq. mi. Water area: 0.2 sq. mi.
Population density: 127 people per square mile
(very low).
OSM Map
General Map
Google Map
MSN Map
OSM Map
General Map
Google Map
MSN Map
OSM Map
General Map
Google Map
MSN Map
OSM Map
General Map
Google Map
MSN Map
Please wait while loading the map...
Real estate property taxes paid for housing units in 2022:
This zip code:
0.6% ($1,396)
North Carolina:
0.6% ($1,769)
Median real estate property taxes paid for housing units with mortgages in 2022: $1,411 (0.6%) Median real estate property taxes paid for housing units with no mortgage in 2022: $1,338 (0.7%)
Business Search- 14 Million verified businesses
Males: 1,605
(47.8%)
Females: 1,751
(52.2%)
For population 25 years and over in 27283:
High school or higher: 93.6%
Bachelor's degree or higher: 29.8%
Graduate or professional degree: 8.9%
Unemployed: 1.3%
Mean travel time to work (commute): 24.1 minutes
For population 15 years and over in 27283:
Never married: 22.8%
Now married: 60.2%
Separated: 3.2%
Widowed: 4.9%
Divorced: 8.9%
Zip code 27283 compared to state average:
Unemployed percentage below state average.
Black race population percentage significantly below state average.
Renting percentage significantly below state average.
Length of stay since moving in above state average.
Estimated median house/condo value in 2022: $224,695
27283:
$224,695
North Carolina:
$280,600
According to our research of North Carolina and other state lists, there was 1 registered sex offender living in 27283 zip code as of May 28, 2024. The ratio of all residents to sex offenders in zip code 27283 is 2,912 to 1. The ratio of registered sex offenders to all residents in this zip code is much lower than the state average.
Median resident age:
This zip code:
41.5 years
North Carolina median age:
39.2 years
Average household size:
This zip code:
2.5 people
North Carolina:
2.4 people
Averages for the 2020 tax year for zip code 27283, filed in 2021:
Average Adjusted Gross Income (AGI) in 2020: $60,254 (Individual Income Tax Returns)
Here:
$60,254
State:
$70,020
Salary/wage: $54,563 (reported on 78.8% of returns)
Here:
$54,563
State:
$58,387
(% of AGI for various income ranges: 1251.7% for AGIs below $25k, 3834.6% for AGIs $25k-50k, 7298.7% for AGIs $50k-75k, 9565.0% for AGIs $75k-100k, 16549.3% for AGIs $100k-200k)
Taxable interest for individuals: $704 (reported on 32.1% of returns)
This zip code:
$704
North Carolina:
$1,479
(% of AGI for various income ranges: 18.3% for AGIs below $25k, 24.6% for AGIs $25k-50k, 31.3% for AGIs $50k-75k, 36.7% for AGIs $75k-100k, 49.3% for AGIs $100k-200k)
Ordinary dividends: $3,765 (reported on 19.9% of returns)
Here:
$3,765
State:
$7,888
(% of AGI for various income ranges: 49.0% for AGIs below $25k, 63.2% for AGIs $25k-50k, 78.7% for AGIs $50k-75k, 80.0% for AGIs $75k-100k, 227.9% for AGIs $100k-200k)
Net capital gain/loss in AGI: +$13,012 (reported on 15.4% of returns)
Here:
+$13,012
State:
+$23,652
(% of AGI for various income ranges: 0.3% for AGIs below $25k, 18.2% for AGIs $25k-50k, 90.7% for AGIs $50k-75k, 387.5% for AGIs $75k-100k, 687.1% for AGIs $100k-200k)
Profit/loss from business: +$10,421 (reported on 18.6% of returns)
Here:
+$10,421
State:
+$11,710
(% of AGI for various income ranges: 273.0% for AGIs below $25k, 161.8% for AGIs $25k-50k, 373.3% for AGIs $50k-75k, 275.0% for AGIs $75k-100k, 614.3% for AGIs $100k-200k)
Taxable individual retirement arrangement distribution: $16,432 (reported on 12.2% of returns)
27283:
$16,432
North Carolina:
$20,247
(% of AGI for various income ranges: 113.0% for AGIs below $25k, 125.4% for AGIs $25k-50k, 288.7% for AGIs $50k-75k, 412.5% for AGIs $75k-100k, 1074.3% for AGIs $100k-200k)
Total itemized deductions: $30,644 (reported on 5.8% of returns)
Here:
$30,644
State:
$34,549
(% of AGI for various income ranges: 722.7% for AGIs $50k-75k, 1195.7% for AGIs $100k-200k)
Charity contributions: $10,443 (reported on 4.5% of returns)
Here:
$10,443
State:
$13,360
(% of AGI for various income ranges: 123.3% for AGIs $50k-75k, 390.0% for AGIs $100k-200k)
Taxes paid: $6,722 (reported on 5.8% of returns)
27283:
$6,722
State:
$7,586
(% of AGI for various income ranges: 130.7% for AGIs $50k-75k, 292.1% for AGIs $100k-200k)
Earned income credit: $1,952 (reported on 13.5% of returns)
Here:
$1,952
State:
$2,337
(% of AGI for various income ranges: 92.3% for AGIs below $25k, 47.5% for AGIs $25k-50k)
Percentage of individuals using paid preparers for their 2020 taxes: 92.3%
Here:
92%
State:
93%
(% for various income ranges: 91.5% for AGIs below $25k, 92.1% for AGIs $25k-50k, 91.7% for AGIs $50k-75k, 94.4% for AGIs $75k-100k, 95.8% for AGIs $100k-200k, 80.0% for AGIs over 200k)
Averages for the 2012 tax year for zip code 27283, filed in 2013:
Average Adjusted Gross Income (AGI) in 2012: $49,611 (Individual Income Tax Returns)
Here:
$49,611
State:
$54,937
Salary/wage: $44,568 (reported on 80.5% of returns)
Here:
$44,568
State:
$46,336
(% of AGI for various income ranges: 68.2% for AGIs below $25k, 76.5% for AGIs $25k-50k, 76.8% for AGIs $50k-75k, 76.9% for AGIs $75k-100k, 74.9% for AGIs $100k-200k, 42.6% for AGIs over 200k)
Taxable interest for individuals: $881 (reported on 38.9% of returns)
This zip code:
$881
North Carolina:
$1,298
(% of AGI for various income ranges: 1.4% for AGIs below $25k, 0.8% for AGIs $25k-50k, 0.8% for AGIs $50k-75k, 0.6% for AGIs $75k-100k, 0.6% for AGIs $100k-200k)
Ordinary dividends: $2,267 (reported on 20.1% of returns)
Here:
$2,267
State:
$6,213
(% of AGI for various income ranges: 1.7% for AGIs below $25k, 0.6% for AGIs $25k-50k, 0.7% for AGIs $50k-75k, 0.8% for AGIs $75k-100k, 1.5% for AGIs $100k-200k)
Net capital gain/loss in AGI: +$3,316 (reported on 16.8% of returns)
Here:
+$3,316
State:
+$12,740
(% of AGI for various income ranges: 0.6% for AGIs $25k-50k, 0.7% for AGIs $50k-75k, 0.3% for AGIs $75k-100k, 3.6% for AGIs $100k-200k)
Profit/loss from business: +$9,692 (reported on 16.8% of returns)
Here:
+$9,692
State:
+$10,311
(% of AGI for various income ranges: 8.4% for AGIs below $25k, 4.6% for AGIs $25k-50k, 2.9% for AGIs $50k-75k, 1.5% for AGIs $75k-100k, 3.5% for AGIs $100k-200k)
Taxable individual retirement arrangement distribution: $12,765 (reported on 13.4% of returns)
27283:
$12,765
North Carolina:
$15,575
(% of AGI for various income ranges: 4.9% for AGIs below $25k, 2.8% for AGIs $25k-50k, 3.5% for AGIs $50k-75k, 4.2% for AGIs $75k-100k, 4.0% for AGIs $100k-200k)
Total itemized deductions: $18,509 (23% of AGI, reported on 36.9% of returns)
Here:
$18,509
State:
$23,438
Here:
22.8% of AGI
State:
21.5% of AGI
(% of AGI for various income ranges: 14.9% for AGIs below $25k, 11.3% for AGIs $25k-50k, 12.9% for AGIs $50k-75k, 15.5% for AGIs $75k-100k, 15.0% for AGIs $100k-200k, 12.0% for AGIs over 200k)
Charity contributions: $3,215 (reported on 31.5% of returns)
Here:
$3,215
State:
$4,687
(% of AGI for various income ranges: 1.4% for AGIs below $25k, 1.5% for AGIs $25k-50k, 1.5% for AGIs $50k-75k, 2.8% for AGIs $75k-100k, 3.4% for AGIs $100k-200k)
Taxes paid: $6,207 (reported on 36.9% of returns)
27283:
$6,207
State:
$8,823
(% of AGI for various income ranges: 1.7% for AGIs below $25k, 2.8% for AGIs $25k-50k, 4.1% for AGIs $50k-75k, 5.1% for AGIs $75k-100k, 6.4% for AGIs $100k-200k, 6.1% for AGIs over 200k)
Earned income credit: $2,100 (reported on 16.1% of returns)
Here:
$2,100
State:
$2,376
(% of AGI for various income ranges: 5.1% for AGIs below $25k, 1.3% for AGIs $25k-50k)
Percentage of individuals using paid preparers for their 2012 taxes: 55.0%
Here:
55%
State:
53%
(% for various income ranges: 50.0% for AGIs below $25k, 55.9% for AGIs $25k-50k, 60.0% for AGIs $50k-75k, 55.6% for AGIs $75k-100k, 71.4% for AGIs $100k-200k)
Averages for the 2004 tax year for zip code 27283, filed in 2005:
Average Adjusted Gross Income (AGI) in 2004: $43,442 (Individual Income Tax Returns)
Here:
$43,442
State:
$45,376
Salary/wage: $40,607 (reported on 84.9% of returns)
Here:
$40,607
State:
$39,442
(% of AGI for various income ranges: 81.9% for AGIs below $10k, 70.2% for AGIs $10k-25k, 81.4% for AGIs $25k-50k, 84.6% for AGIs $50k-75k, 81.7% for AGIs $75k-100k, 71.6% for AGIs over 100k)
Taxable interest for individuals: $1,111 (reported on 47.6% of returns)
This zip code:
$1,111
North Carolina:
$1,515
(% of AGI for various income ranges: 6.2% for AGIs below $10k, 4.2% for AGIs $10k-25k, 0.9% for AGIs $25k-50k, 1.1% for AGIs $50k-75k, 0.9% for AGIs $75k-100k, 0.6% for AGIs over 100k)
Taxable dividends: $1,461 (reported on 23.6% of returns)
Here:
$1,461
State:
$4,016
(% of AGI for various income ranges: 2.8% for AGIs below $10k, 1.8% for AGIs $10k-25k, 0.8% for AGIs $25k-50k, 0.6% for AGIs $50k-75k, 0.6% for AGIs $75k-100k, 0.7% for AGIs over 100k)
Net capital gain/loss: +$6,527 (reported on 15.4% of returns)
Here:
+$6,527
State:
+$11,152
(% of AGI for various income ranges: -2.2% for AGIs below $10k, 0.0% for AGIs $10k-25k, -0.3% for AGIs $25k-50k, 0.4% for AGIs $50k-75k, 0.7% for AGIs $75k-100k, 10.0% for AGIs over 100k)
Profit/loss from business: +$6,810 (reported on 16.6% of returns)
Here:
+$6,810
State:
+$9,490
(% of AGI for various income ranges: -1.4% for AGIs below $10k, 4.0% for AGIs $10k-25k, 4.8% for AGIs $25k-50k, 1.8% for AGIs $50k-75k, 0.2% for AGIs $75k-100k, 3.3% for AGIs over 100k)
IRA payment deduction: $2,756 (reported on 2.8% of returns)
27283:
$2,756
North Carolina:
$2,967
Total itemized deductions: $16,418 (24% of AGI, reported on 39.2% of returns)
Here:
$16,418
State:
$19,464
Here:
23.7% of AGI
State:
22.7% of AGI
(% of AGI for various income ranges: 18.4% for AGIs below $10k, 14.9% for AGIs $10k-25k, 11.2% for AGIs $25k-50k, 15.6% for AGIs $50k-75k, 16.1% for AGIs $75k-100k, 16.2% for AGIs over 100k)
Charity contributions deductions: $3,050 (4% of AGI, reported on 34.3% of returns)
Here:
$3,050
State:
$4,035
Here:
4.2% of AGI
State:
4.5% of AGI
(% of AGI for various income ranges: 1.1% for AGIs below $10k, 2.0% for AGIs $10k-25k, 1.5% for AGIs $25k-50k, 2.5% for AGIs $50k-75k, 2.9% for AGIs $75k-100k, 3.0% for AGIs over 100k)
Total tax: $5,233 (reported on 76.3% of returns)
27283:
$5,233
State:
$7,257
(% of AGI for various income ranges: 2.3% for AGIs below $10k, 3.5% for AGIs $10k-25k, 6.5% for AGIs $25k-50k, 7.9% for AGIs $50k-75k, 9.8% for AGIs $75k-100k, 15.5% for AGIs over 100k)
Earned income credit: $1,590 (reported on 11.0% of returns)
Here:
$1,590
State:
$1,851
Percentage of individuals using paid preparers for their 2004 taxes: 60.0%
Here:
60%
State:
62%
(% for various income ranges: 45.7% for AGIs below $10k, 63.6% for AGIs $10k-25k, 60.8% for AGIs $25k-50k, 65.5% for AGIs $50k-75k, 60.1% for AGIs $75k-100k, 72.5% for AGIs over 100k)
Household received Food Stamps/SNAP in the past 12 months: 83 Household did not receive Food Stamps/SNAP in the past 12 months: 1,265
Women who had a birth in the past 12 months: 41 (42 now married, 0 unmarried) Women who did not have a birth in the past 12 months: 762 (418 now married, 345 unmarried)
Housing units in zip code 27283 with a mortgage: 793 (90 second mortgage, 73 both second mortgage and home equity loan) Houses without a mortgage: 91
Median monthly owner costs for units with a mortgage: $1,101 Median monthly owner costs for units without a mortgage: $330
Residents with income below the poverty level in 2022:
This zip code:
7.9%
Whole state:
12.8%
Residents with income below 50% of the poverty level in 2022:
This zip code:
3.0%
Whole state:
6.8%
Median number of rooms in houses and condos:
Here:
5.8
State:
6.4
Median number of rooms in apartments:
Here:
5.2
State:
4.4
Notable locations in this zip code not listed on our city pages
Churches in zip code 27283 include: Julian Hill Church (A), Love Church (B), Colbe Church (C), Evangelical Church (D). Display/hide their locations on the map
In group quarters: 10 (-1 institutionalized population)
Size of family households: 520 2-persons, 274 3-persons, 104 4-persons, 29 5-persons, 99 7-or-more-persons
Size of nonfamily households: 278 1-person, 63 2-persons
497 married couples with children.
202 single-parent households (32 men, 170 women).
85.0% of residents of 27283 zip code speak English at home.
14.3% of residents speak Spanish at home (61% very well, 18% well, 22% not well).
Foreign born population: 235 (7.0%) (27.1% of them are naturalized citizens)
This zip code:
7.0%
Whole state:
8.6%
67%Honduras
12%Dominica
8%Romania
4%Colombia
21%English
9%German
8%American
7%Irish
6%Scotch-Irish
3%Scottish
1%Polish
Year of entry for the foreign-born population
482010 or later
662000 to 2009
1351990 to 1999
0Before 1990
Facilities with environmental interests located in this zip code:
ACE SPEEDWAY/ACE SHORE TRACK (6750 HOLT STORE RD in JULIAN, NC)
(Integrated Compliance Information System) - ICIS-04-1999-0445, FORMAL ENFORCEMENT ACTION
Housing units lacking complete plumbing facilities: 4.3% Housing units lacking complete kitchen facilities: 2.7%
60.4%Electricity
24.4%Bottled, tank, or LP gas
6.7%Solar energy
4.6%Wood
2.6%Fuel oil, kerosene, etc.
1.0%Coal or coke
0.7%Other fuel
Population in 1990: 2,894.
Place of birth for U.S.-born residents:
This state: 2,437
Northeast: 161
Midwest: 149
South: 246
West: 65
67% of the 27283 zip code residents lived in the same house 5 years ago. Out of people who lived in different houses, 79% lived in this county. Out of people who lived in different counties, 50% lived in North Carolina.
85% of the 27283 zip code residents lived in the same house 1 year ago. Out of people who lived in different houses, 63% moved from this county. Out of people who lived in different houses, 29% moved from different county within same state.
Private vs. public school enrollment:
Students in private schools in grades 1 to 8 (elementary and middle school): 50
Here:
24.1%
North Carolina:
13.8%
Students in private schools in grades 9 to 12 (high school): 64
Here:
24.1%
North Carolina:
11.9%
Students in private undergraduate colleges: 28
Here:
22.4%
North Carolina:
19.3%
Occupation by median earnings in the past 12 months ($)
148,780Business and financial operations occupations
115,887Computer and mathematical occupations
85,816Management occupations
84,895Health diagnosing and treating practitioners and other technical occupations
60,277Transportation occupations
57,675Education, training, and library occupations
Top industries in this zip code by the number of employees in 2005:
Administrative and Support and Waste Management and Remediation Services: Landscaping Services (20-49 employees: 1 establishment, 5-9 employees: 1 establishment, 1-4 employees: 1 establishment)
Wholesale Trade: Piece Goods, Notions, and Other Dry Goods Merchant Wholesalers (20-49: 1)
Construction: Plumbing, Heating, and Air-Conditioning Contractors (10-19: 1, 1-4: 4)
Construction: Painting and Wall Covering Contractors (10-19: 1)
Accommodation and Food Services: Food Service Contractors (10-19: 1)
Accommodation and Food Services: Full-Service Restaurants (10-19: 1)
Construction: New Housing Operative Builders (5-9: 1, 1-4: 1)
Construction: Masonry Contractors (5-9: 1)
People in group quarters in 2010:
5 people in group homes intended for adults
Fatal accident statistics in 2013:
Fatal accident count: 1
Vehicles involved in fatal accidents: 2
Fatal accidents caused by drunken drivers: 0
Fatalities: 1
Persons involved in fatal accidents: 3
Pedestrians involved in fatal accidents: 0
Home Mortgage Disclosure Act Aggregated Statistics For Year 2009 (Based on 2 partial tracts)
A) FHA, FSA/RHS & VA Home Purchase Loans
B) Conventional Home Purchase Loans
C) Refinancings
D) Home Improvement Loans
F) Non-occupant Loans on < 5 Family Dwellings (A B C & D)
G) Loans On Manufactured Home Dwelling (A B C & D)
Number
Average Value
Number
Average Value
Number
Average Value
Number
Average Value
Number
Average Value
Number
Average Value
LOANS ORIGINATED
11
$161,139
22
$143,446
99
$150,571
2
$21,835
7
$96,296
4
$92,568
APPLICATIONS APPROVED, NOT ACCEPTED
1
$165,200
2
$137,190
5
$138,042
0
$0
1
$189,880
0
$0
APPLICATIONS DENIED
1
$142,410
3
$129,433
21
$174,870
2
$13,290
1
$56,960
1
$119,620
APPLICATIONS WITHDRAWN
1
$112,030
1
$163,300
24
$178,131
0
$0
1
$129,120
3
$95,257
FILES CLOSED FOR INCOMPLETENESS
0
$0
0
$0
8
$199,374
0
$0
0
$0
1
$112,980
Aggregated Statistics For Year 2008 (Based on 2 partial tracts)
A) FHA, FSA/RHS & VA Home Purchase Loans
B) Conventional Home Purchase Loans
C) Refinancings
D) Home Improvement Loans
F) Non-occupant Loans on < 5 Family Dwellings (A B C & D)
G) Loans On Manufactured Home Dwelling (A B C & D)
Number
Average Value
Number
Average Value
Number
Average Value
Number
Average Value
Number
Average Value
Number
Average Value
LOANS ORIGINATED
11
$121,092
26
$209,489
66
$133,304
9
$47,892
6
$174,690
8
$82,479
APPLICATIONS APPROVED, NOT ACCEPTED
1
$97,790
1
$74,050
9
$159,078
4
$37,975
1
$68,360
1
$97,790
APPLICATIONS DENIED
3
$149,690
7
$80,291
47
$124,089
4
$11,630
2
$169,945
11
$79,318
APPLICATIONS WITHDRAWN
1
$152,850
5
$144,498
22
$144,352
2
$73,580
0
$0
2
$80,700
FILES CLOSED FOR INCOMPLETENESS
3
$142,093
1
$284,820
2
$104,910
0
$0
0
$0
0
$0
Aggregated Statistics For Year 2007 (Based on 2 partial tracts)
A) FHA, FSA/RHS & VA Home Purchase Loans
B) Conventional Home Purchase Loans
C) Refinancings
D) Home Improvement Loans
F) Non-occupant Loans on < 5 Family Dwellings (A B C & D)
G) Loans On Manufactured Home Dwelling (A B C & D)
Number
Average Value
Number
Average Value
Number
Average Value
Number
Average Value
Number
Average Value
Number
Average Value
LOANS ORIGINATED
10
$155,891
50
$164,417
80
$127,255
8
$31,686
6
$113,612
7
$79,207
APPLICATIONS APPROVED, NOT ACCEPTED
0
$0
6
$128,485
17
$84,496
3
$126,587
1
$63,610
3
$59,180
APPLICATIONS DENIED
1
$80,700
5
$112,788
61
$104,076
9
$54,432
3
$115,193
16
$82,776
APPLICATIONS WITHDRAWN
1
$143,360
5
$90,952
19
$179,187
1
$128,170
3
$130,383
2
$119,150
FILES CLOSED FOR INCOMPLETENESS
0
$0
2
$27,535
4
$128,170
0
$0
0
$0
0
$0
Aggregated Statistics For Year 2006 (Based on 2 partial tracts)
A) FHA, FSA/RHS & VA Home Purchase Loans
B) Conventional Home Purchase Loans
C) Refinancings
D) Home Improvement Loans
F) Non-occupant Loans on < 5 Family Dwellings (A B C & D)
G) Loans On Manufactured Home Dwelling (A B C & D)
Number
Average Value
Number
Average Value
Number
Average Value
Number
Average Value
Number
Average Value
Number
Average Value
LOANS ORIGINATED
9
$127,431
70
$158,807
81
$117,046
10
$80,699
12
$145,575
9
$87,133
APPLICATIONS APPROVED, NOT ACCEPTED
0
$0
6
$148,740
18
$117,989
0
$0
2
$103,960
3
$50,003
APPLICATIONS DENIED
0
$0
17
$144,867
79
$124,888
13
$63,829
4
$238,062
23
$71,205
APPLICATIONS WITHDRAWN
0
$0
5
$176,968
23
$128,582
1
$28,480
0
$0
1
$100,640
FILES CLOSED FOR INCOMPLETENESS
0
$0
4
$154,515
10
$191,874
0
$0
0
$0
0
$0
Aggregated Statistics For Year 2005 (Based on 2 partial tracts)
A) FHA, FSA/RHS & VA Home Purchase Loans
B) Conventional Home Purchase Loans
C) Refinancings
D) Home Improvement Loans
F) Non-occupant Loans on < 5 Family Dwellings (A B C & D)
G) Loans On Manufactured Home Dwelling (A B C & D)
Number
Average Value
Number
Average Value
Number
Average Value
Number
Average Value
Number
Average Value
Number
Average Value
LOANS ORIGINATED
5
$112,030
52
$124,444
82
$113,650
10
$109,656
9
$77,640
9
$89,771
APPLICATIONS APPROVED, NOT ACCEPTED
0
$0
10
$98,168
24
$121,088
3
$25,950
0
$0
4
$94,702
APPLICATIONS DENIED
2
$95,890
23
$117,313
73
$114,578
12
$71,601
3
$107,283
22
$76,081
APPLICATIONS WITHDRAWN
1
$134,810
5
$130,068
30
$146,967
4
$192,252
2
$134,815
4
$101,110
FILES CLOSED FOR INCOMPLETENESS
0
$0
3
$171,840
17
$142,354
0
$0
0
$0
0
$0
Aggregated Statistics For Year 2004 (Based on 2 partial tracts)
A) FHA, FSA/RHS & VA Home Purchase Loans
B) Conventional Home Purchase Loans
C) Refinancings
D) Home Improvement Loans
F) Non-occupant Loans on < 5 Family Dwellings (A B C & D)
G) Loans On Manufactured Home Dwelling (A B C & D)
Number
Average Value
Number
Average Value
Number
Average Value
Number
Average Value
Number
Average Value
Number
Average Value
LOANS ORIGINATED
5
$124,752
47
$122,210
109
$122,046
12
$39,875
12
$106,887
16
$80,046
APPLICATIONS APPROVED, NOT ACCEPTED
1
$102,540
5
$86,016
12
$119,071
0
$0
0
$0
4
$50,792
APPLICATIONS DENIED
2
$75,475
8
$68,475
72
$131,584
5
$33,230
4
$65,035
21
$75,410
APPLICATIONS WITHDRAWN
1
$93,040
2
$100,160
37
$137,022
1
$23,730
0
$0
7
$98,060
FILES CLOSED FOR INCOMPLETENESS
0
$0
1
$626,600
16
$124,490
0
$0
0
$0
3
$81,333
Aggregated Statistics For Year 2003 (Based on 2 partial tracts)
A) FHA, FSA/RHS & VA Home Purchase Loans
B) Conventional Home Purchase Loans
C) Refinancings
D) Home Improvement Loans
F) Non-occupant Loans on < 5 Family Dwellings (A B C & D)
Number
Average Value
Number
Average Value
Number
Average Value
Number
Average Value
Number
Average Value
LOANS ORIGINATED
6
$131,808
45
$103,442
235
$134,500
3
$62,027
7
$97,246
APPLICATIONS APPROVED, NOT ACCEPTED
0
$0
3
$87,027
21
$106,423
2
$18,990
0
$0
APPLICATIONS DENIED
1
$132,920
10
$101,111
65
$102,039
3
$30,697
1
$33,230
APPLICATIONS WITHDRAWN
2
$101,585
4
$200,798
34
$131,157
1
$265,830
2
$214,090
FILES CLOSED FOR INCOMPLETENESS
1
$125,320
0
$0
2
$159,975
0
$0
0
$0
Aggregated Statistics For Year 2002 (Based on 2 partial tracts)
A) FHA, FSA/RHS & VA Home Purchase Loans
B) Conventional Home Purchase Loans
C) Refinancings
D) Home Improvement Loans
F) Non-occupant Loans on < 5 Family Dwellings (A B C & D)
Number
Average Value
Number
Average Value
Number
Average Value
Number
Average Value
Number
Average Value
LOANS ORIGINATED
3
$88,927
47
$123,887
139
$117,254
9
$17,828
8
$64,677
APPLICATIONS APPROVED, NOT ACCEPTED
2
$116,775
18
$77,218
17
$92,315
4
$29,195
1
$48,420
APPLICATIONS DENIED
1
$50,320
28
$74,223
49
$92,441
8
$17,920
2
$46,045
APPLICATIONS WITHDRAWN
1
$115,830
5
$135,384
31
$119,777
0
$0
0
$0
FILES CLOSED FOR INCOMPLETENESS
0
$0
1
$170,890
5
$80,510
0
$0
0
$0
Aggregated Statistics For Year 2001 (Based on 2 partial tracts)
A) FHA, FSA/RHS & VA Home Purchase Loans
B) Conventional Home Purchase Loans
C) Refinancings
D) Home Improvement Loans
F) Non-occupant Loans on < 5 Family Dwellings (A B C & D)
Number
Average Value
Number
Average Value
Number
Average Value
Number
Average Value
Number
Average Value
LOANS ORIGINATED
6
$87,978
31
$125,596
127
$105,413
9
$25,633
6
$73,262
APPLICATIONS APPROVED, NOT ACCEPTED
0
$0
11
$68,098
12
$145,575
0
$0
2
$48,420
APPLICATIONS DENIED
1
$82,600
18
$55,171
50
$83,661
10
$15,570
4
$98,025
APPLICATIONS WITHDRAWN
0
$0
6
$124,847
16
$93,753
1
$7,600
2
$93,515
FILES CLOSED FOR INCOMPLETENESS
0
$0
0
$0
4
$125,558
0
$0
0
$0
Aggregated Statistics For Year 2000 (Based on 2 partial tracts)
A) FHA, FSA/RHS & VA Home Purchase Loans
B) Conventional Home Purchase Loans
C) Refinancings
D) Home Improvement Loans
F) Non-occupant Loans on < 5 Family Dwellings (A B C & D)
Number
Average Value
Number
Average Value
Number
Average Value
Number
Average Value
Number
Average Value
LOANS ORIGINATED
3
$104,433
47
$109,827
44
$86,266
9
$14,241
6
$98,580
APPLICATIONS APPROVED, NOT ACCEPTED
6
$44,463
9
$46,099
18
$81,807
6
$18,513
0
$0
APPLICATIONS DENIED
0
$0
29
$60,532
40
$71,704
4
$15,190
2
$52,215
APPLICATIONS WITHDRAWN
4
$72,868
8
$106,214
8
$77,614
1
$12,340
1
$112,030
FILES CLOSED FOR INCOMPLETENESS
0
$0
0
$0
5
$67,598
0
$0
0
$0
Aggregated Statistics For Year 1999 (Based on 1 partial tract)
A) FHA, FSA/RHS & VA Home Purchase Loans
B) Conventional Home Purchase Loans
C) Refinancings
D) Home Improvement Loans
F) Non-occupant Loans on < 5 Family Dwellings (A B C & D)
Detailed PMIC statistics for the following Tracts:0170.00
2002 - 2018 National Fire Incident Reporting System (NFIRS) incidents
Based on the data from the years 2002 - 2018 the average number of fires per year is 27. The highest number of fires - 43 took place in 2014, and the least - 11 in 2002. The data has a growing trend.
When looking into fire subcategories, the most incidents belonged to: Structure Fires (46.3%), and Outside Fires (43.2%).
Fire incident types reported to NFIRS in Zip Code 27283


 Nearest zip codes: 27233, 27298, 27377, 27313, 27406, 27215.


 Based on the data from the years 2002 - 2018 the average number of fires per year is 27. The highest number of fires - 43 took place in 2014, and the least - 11 in 2002. The data has a growing trend.
 When looking into fire subcategories, the most incidents belonged to: Structure Fires (46.3%), and Outside Fires (43.2%).