Cities: Liberty, NC (3.26%) ,
Ramseur, NC (0.05%) Counties: Randolph County, NC (43.87%) ,
Alamance County, NC (31.40%) ,
Guilford County, NC (23.76%) ,
Chatham County, NC (0.97%) Estimated zip code population in 2022: 11,397
Zip code population in 2010: 10,336
Zip code population in 2000: 9,527
Houses and condos: 4,481
Renter-occupied apartments: 1,243
% of renters here:
30%State:
33%
March 2022 cost of living index in zip code 27298: 80.4
(low, U.S. average is 100)
Land area: 95.0
sq. mi.
Water area: 0.9
sq. mi.
Population density: 120 people per square mile (very low).
OSM Map
General Map
Google Map
MSN Map
OSM Map
General Map
Google Map
MSN Map
OSM Map
General Map
Google Map
MSN Map
OSM Map
General Map
Google Map
MSN Map
Please wait while loading the map...
Real estate property taxes paid for housing units in 2022:
This zip code:
0.5% ($1,099)North Carolina:
0.6% ($1,769)
Median real estate property taxes paid for housing units with mortgages in 2022: $1,082 (0.5%)
Median real estate property taxes paid for housing units with no mortgage in 2022: $1,119 (0.5%)
Profiles of local businesses
Business Search - 14 Million verified businesses
Males: 5,741 Females: 5,655
For population 25 years and over in 27298:
High school or higher: 83.3%Bachelor's degree or higher: 17.7%Graduate or professional degree: 3.8%Unemployed: 5.9%Mean travel time to work (commute): 27.1 minutes
For population 15 years and over in 27298:
Never married: 30.3%Now married: 52.7%Separated: 2.0%Widowed: 5.8%Divorced: 9.2%
Zip code 27298 compared to state average:
Black race population percentage significantly below state average. Length of stay since moving in significantly above state average. Number of college students below state average. Percentage of population with a bachelor's degree or higher below state average. 9,028 79.2% White 1,556 13.7% Hispanic or Latino 567 5.0% Black 202 1.8% Two or more races 32 0.3% Asian 11 0.10% American Indian
Data:
Median household income ($)
Median household income (% change since 2000)
Household income diversity
Ratio of average income to average house value (%)
Ratio of average income to average rent
Median household income ($) - White
Median household income ($) - Black or African American
Median household income ($) - Asian
Median household income ($) - Hispanic or Latino
Median household income ($) - American Indian and Alaska Native
Median household income ($) - Multirace
Median household income ($) - Other Race
Median household income for houses/condos with a mortgage ($)
Median household income for apartments without a mortgage ($)
Races - White alone (%)
Races - White alone (% change since 2000)
Races - Black alone (%)
Races - Black alone (% change since 2000)
Races - American Indian alone (%)
Races - American Indian alone (% change since 2000)
Races - Asian alone (%)
Races - Asian alone (% change since 2000)
Races - Hispanic (%)
Races - Hispanic (% change since 2000)
Races - Native Hawaiian and Other Pacific Islander alone (%)
Races - Native Hawaiian and Other Pacific Islander alone (% change since 2000)
Races - Two or more races (%)
Races - Two or more races (% change since 2000)
Races - Other race alone (%)
Races - Other race alone (% change since 2000)
Racial diversity
Unemployment (%)
Unemployment (% change since 2000)
Unemployment (%) - White
Unemployment (%) - Black or African American
Unemployment (%) - Asian
Unemployment (%) - Hispanic or Latino
Unemployment (%) - American Indian and Alaska Native
Unemployment (%) - Multirace
Unemployment (%) - Other Race
Population density (people per square mile)
Population - Males (%)
Population - Females (%)
Population - Males (%) - White
Population - Males (%) - Black or African American
Population - Males (%) - Asian
Population - Males (%) - Hispanic or Latino
Population - Males (%) - American Indian and Alaska Native
Population - Males (%) - Multirace
Population - Males (%) - Other Race
Population - Females (%) - White
Population - Females (%) - Black or African American
Population - Females (%) - Asian
Population - Females (%) - Hispanic or Latino
Population - Females (%) - American Indian and Alaska Native
Population - Females (%) - Multirace
Population - Females (%) - Other Race
Coronavirus confirmed cases (Jun 08, 2024)
Deaths caused by coronavirus (Jun 08, 2024)
Coronavirus confirmed cases (per 100k population) (Jun 08, 2024)
Deaths caused by coronavirus (per 100k population) (Jun 08, 2024)
Daily increase in number of cases (Jun 08, 2024)
Weekly increase in number of cases (Jun 08, 2024)
Cases doubled (in days) (Jun 08, 2024)
Hospitalized patients (Apr 18, 2022)
Negative test results (Apr 18, 2022)
Total test results (Apr 18, 2022)
COVID Vaccine doses distributed (per 100k population) (Sep 19, 2023)
COVID Vaccine doses administered (per 100k population) (Sep 19, 2023)
COVID Vaccine doses distributed (Sep 19, 2023)
COVID Vaccine doses administered (Sep 19, 2023)
Likely homosexual households (%)
Likely homosexual households (% change since 2000)
Likely homosexual households - Lesbian couples (%)
Likely homosexual households - Lesbian couples (% change since 2000)
Likely homosexual households - Gay men (%)
Likely homosexual households - Gay men (% change since 2000)
Cost of living index
Median gross rent ($)
Median contract rent ($)
Median monthly housing costs ($)
Median house or condo value ($)
Median house or condo value ($ change since 2000)
Mean house or condo value by units in structure - 1, detached ($)
Mean house or condo value by units in structure - 1, attached ($)
Mean house or condo value by units in structure - 2 ($)
Mean house or condo value by units in structure by units in structure - 3 or 4 ($)
Mean house or condo value by units in structure - 5 or more ($)
Mean house or condo value by units in structure - Boat, RV, van, etc. ($)
Mean house or condo value by units in structure - Mobile home ($)
Median house or condo value ($) - White
Median house or condo value ($) - Black or African American
Median house or condo value ($) - Asian
Median house or condo value ($) - Hispanic or Latino
Median house or condo value ($) - American Indian and Alaska Native
Median house or condo value ($) - Multirace
Median house or condo value ($) - Other Race
Median resident age
Resident age diversity
Median resident age - Males
Median resident age - Females
Median resident age - White
Median resident age - Black or African American
Median resident age - Asian
Median resident age - Hispanic or Latino
Median resident age - American Indian and Alaska Native
Median resident age - Multirace
Median resident age - Other Race
Median resident age - Males - White
Median resident age - Males - Black or African American
Median resident age - Males - Asian
Median resident age - Males - Hispanic or Latino
Median resident age - Males - American Indian and Alaska Native
Median resident age - Males - Multirace
Median resident age - Males - Other Race
Median resident age - Females - White
Median resident age - Females - Black or African American
Median resident age - Females - Asian
Median resident age - Females - Hispanic or Latino
Median resident age - Females - American Indian and Alaska Native
Median resident age - Females - Multirace
Median resident age - Females - Other Race
Commute - mean travel time to work (minutes)
Travel time to work - Less than 5 minutes (%)
Travel time to work - Less than 5 minutes (% change since 2000)
Travel time to work - 5 to 9 minutes (%)
Travel time to work - 5 to 9 minutes (% change since 2000)
Travel time to work - 10 to 19 minutes (%)
Travel time to work - 10 to 19 minutes (% change since 2000)
Travel time to work - 20 to 29 minutes (%)
Travel time to work - 20 to 29 minutes (% change since 2000)
Travel time to work - 30 to 39 minutes (%)
Travel time to work - 30 to 39 minutes (% change since 2000)
Travel time to work - 40 to 59 minutes (%)
Travel time to work - 40 to 59 minutes (% change since 2000)
Travel time to work - 60 to 89 minutes (%)
Travel time to work - 60 to 89 minutes (% change since 2000)
Travel time to work - 90 or more minutes (%)
Travel time to work - 90 or more minutes (% change since 2000)
Marital status - Never married (%)
Marital status - Now married (%)
Marital status - Separated (%)
Marital status - Widowed (%)
Marital status - Divorced (%)
Median family income ($)
Median family income (% change since 2000)
Median non-family income ($)
Median non-family income (% change since 2000)
Median per capita income ($)
Median per capita income (% change since 2000)
Median family income ($) - White
Median family income ($) - Black or African American
Median family income ($) - Asian
Median family income ($) - Hispanic or Latino
Median family income ($) - American Indian and Alaska Native
Median family income ($) - Multirace
Median family income ($) - Other Race
Median year house/condo built
Median year apartment built
Year house built - Built 2005 or later (%)
Year house built - Built 2000 to 2004 (%)
Year house built - Built 1990 to 1999 (%)
Year house built - Built 1980 to 1989 (%)
Year house built - Built 1970 to 1979 (%)
Year house built - Built 1960 to 1969 (%)
Year house built - Built 1950 to 1959 (%)
Year house built - Built 1940 to 1949 (%)
Year house built - Built 1939 or earlier (%)
Average household size
Household density (households per square mile)
Average household size - White
Average household size - Black or African American
Average household size - Asian
Average household size - Hispanic or Latino
Average household size - American Indian and Alaska Native
Average household size - Multirace
Average household size - Other Race
Occupied housing units (%)
Vacant housing units (%)
Owner occupied housing units (%)
Renter occupied housing units (%)
Vacancy status - For rent (%)
Vacancy status - For sale only (%)
Vacancy status - Rented or sold, not occupied (%)
Vacancy status - For seasonal, recreational, or occasional use (%)
Vacancy status - For migrant workers (%)
Vacancy status - Other vacant (%)
Residents with income below the poverty level (%)
Residents with income below 50% of the poverty level (%)
Children below poverty level (%)
Poor families by family type - Married-couple family (%)
Poor families by family type - Male, no wife present (%)
Poor families by family type - Female, no husband present (%)
Poverty status for native-born residents (%)
Poverty status for foreign-born residents (%)
Poverty among high school graduates not in families (%)
Poverty among people who did not graduate high school not in families (%)
Residents with income below the poverty level (%) - White
Residents with income below the poverty level (%) - Black or African American
Residents with income below the poverty level (%) - Asian
Residents with income below the poverty level (%) - Hispanic or Latino
Residents with income below the poverty level (%) - American Indian and Alaska Native
Residents with income below the poverty level (%) - Multirace
Residents with income below the poverty level (%) - Other Race
Air pollution - Air Quality Index (AQI)
Air pollution - CO
Air pollution - NO2
Air pollution - SO2
Air pollution - Ozone
Air pollution - PM10
Air pollution - PM25
Air pollution - Pb
Crime - Murders per 100,000 population
Crime - Rapes per 100,000 population
Crime - Robberies per 100,000 population
Crime - Assaults per 100,000 population
Crime - Burglaries per 100,000 population
Crime - Thefts per 100,000 population
Crime - Auto thefts per 100,000 population
Crime - Arson per 100,000 population
Crime - City-data.com crime index
Crime - Violent crime index
Crime - Property crime index
Crime - Murders per 100,000 population (5 year average)
Crime - Rapes per 100,000 population (5 year average)
Crime - Robberies per 100,000 population (5 year average)
Crime - Assaults per 100,000 population (5 year average)
Crime - Burglaries per 100,000 population (5 year average)
Crime - Thefts per 100,000 population (5 year average)
Crime - Auto thefts per 100,000 population (5 year average)
Crime - Arson per 100,000 population (5 year average)
Crime - City-data.com crime index (5 year average)
Crime - Violent crime index (5 year average)
Crime - Property crime index (5 year average)
1996 Presidential Elections Results (%) - Democratic Party (Clinton)
1996 Presidential Elections Results (%) - Republican Party (Dole)
1996 Presidential Elections Results (%) - Other
2000 Presidential Elections Results (%) - Democratic Party (Gore)
2000 Presidential Elections Results (%) - Republican Party (Bush)
2000 Presidential Elections Results (%) - Other
2004 Presidential Elections Results (%) - Democratic Party (Kerry)
2004 Presidential Elections Results (%) - Republican Party (Bush)
2004 Presidential Elections Results (%) - Other
2008 Presidential Elections Results (%) - Democratic Party (Obama)
2008 Presidential Elections Results (%) - Republican Party (McCain)
2008 Presidential Elections Results (%) - Other
2012 Presidential Elections Results (%) - Democratic Party (Obama)
2012 Presidential Elections Results (%) - Republican Party (Romney)
2012 Presidential Elections Results (%) - Other
2016 Presidential Elections Results (%) - Democratic Party (Clinton)
2016 Presidential Elections Results (%) - Republican Party (Trump)
2016 Presidential Elections Results (%) - Other
2020 Presidential Elections Results (%) - Democratic Party (Biden)
2020 Presidential Elections Results (%) - Republican Party (Trump)
2020 Presidential Elections Results (%) - Other
Ancestries Reported - Arab (%)
Ancestries Reported - Czech (%)
Ancestries Reported - Danish (%)
Ancestries Reported - Dutch (%)
Ancestries Reported - English (%)
Ancestries Reported - French (%)
Ancestries Reported - French Canadian (%)
Ancestries Reported - German (%)
Ancestries Reported - Greek (%)
Ancestries Reported - Hungarian (%)
Ancestries Reported - Irish (%)
Ancestries Reported - Italian (%)
Ancestries Reported - Lithuanian (%)
Ancestries Reported - Norwegian (%)
Ancestries Reported - Polish (%)
Ancestries Reported - Portuguese (%)
Ancestries Reported - Russian (%)
Ancestries Reported - Scotch-Irish (%)
Ancestries Reported - Scottish (%)
Ancestries Reported - Slovak (%)
Ancestries Reported - Subsaharan African (%)
Ancestries Reported - Swedish (%)
Ancestries Reported - Swiss (%)
Ancestries Reported - Ukrainian (%)
Ancestries Reported - United States (%)
Ancestries Reported - Welsh (%)
Ancestries Reported - West Indian (%)
Ancestries Reported - Other (%)
Educational Attainment - No schooling completed (%)
Educational Attainment - Less than high school (%)
Educational Attainment - High school or equivalent (%)
Educational Attainment - Less than 1 year of college (%)
Educational Attainment - 1 or more years of college (%)
Educational Attainment - Associate degree (%)
Educational Attainment - Bachelor's degree (%)
Educational Attainment - Master's degree (%)
Educational Attainment - Professional school degree (%)
Educational Attainment - Doctorate degree (%)
School Enrollment - Nursery, preschool (%)
School Enrollment - Kindergarten (%)
School Enrollment - Grade 1 to 4 (%)
School Enrollment - Grade 5 to 8 (%)
School Enrollment - Grade 9 to 12 (%)
School Enrollment - College undergrad (%)
School Enrollment - Graduate or professional (%)
School Enrollment - Not enrolled in school (%)
School enrollment - Public schools (%)
School enrollment - Private schools (%)
School enrollment - Not enrolled (%)
Median number of rooms in houses and condos
Median number of rooms in apartments
Housing units lacking complete plumbing facilities (%)
Housing units lacking complete kitchen facilities (%)
Density of houses
Urban houses (%)
Rural houses (%)
Households with people 60 years and over (%)
Households with people 65 years and over (%)
Households with people 75 years and over (%)
Households with one or more nonrelatives (%)
Households with no nonrelatives (%)
Population in households (%)
Family households (%)
Nonfamily households (%)
Population in families (%)
Family households with own children (%)
Median number of bedrooms in owner occupied houses
Mean number of bedrooms in owner occupied houses
Median number of bedrooms in renter occupied houses
Mean number of bedrooms in renter occupied houses
Median number of vehichles in owner occupied houses
Mean number of vehichles in owner occupied houses
Median number of vehichles in renter occupied houses
Mean number of vehichles in renter occupied houses
Mortgage status - with mortgage (%)
Mortgage status - with second mortgage (%)
Mortgage status - with home equity loan (%)
Mortgage status - with both second mortgage and home equity loan (%)
Mortgage status - without a mortgage (%)
Average family size
Average family size - White
Average family size - Black or African American
Average family size - Asian
Average family size - Hispanic or Latino
Average family size - American Indian and Alaska Native
Average family size - Multirace
Average family size - Other Race
Geographical mobility - Same house 1 year ago (%)
Geographical mobility - Moved within same county (%)
Geographical mobility - Moved from different county within same state (%)
Geographical mobility - Moved from different state (%)
Geographical mobility - Moved from abroad (%)
Place of birth - Born in state of residence (%)
Place of birth - Born in other state (%)
Place of birth - Native, outside of US (%)
Place of birth - Foreign born (%)
Housing units in structures - 1, detached (%)
Housing units in structures - 1, attached (%)
Housing units in structures - 2 (%)
Housing units in structures - 3 or 4 (%)
Housing units in structures - 5 to 9 (%)
Housing units in structures - 10 to 19 (%)
Housing units in structures - 20 to 49 (%)
Housing units in structures - 50 or more (%)
Housing units in structures - Mobile home (%)
Housing units in structures - Boat, RV, van, etc. (%)
House/condo owner moved in on average (years ago)
Renter moved in on average (years ago)
Year householder moved into unit - Moved in 1999 to March 2000 (%)
Year householder moved into unit - Moved in 1995 to 1998 (%)
Year householder moved into unit - Moved in 1990 to 1994 (%)
Year householder moved into unit - Moved in 1980 to 1989 (%)
Year householder moved into unit - Moved in 1970 to 1979 (%)
Year householder moved into unit - Moved in 1969 or earlier (%)
Means of transportation to work - Drove car alone (%)
Means of transportation to work - Carpooled (%)
Means of transportation to work - Public transportation (%)
Means of transportation to work - Bus or trolley bus (%)
Means of transportation to work - Streetcar or trolley car (%)
Means of transportation to work - Subway or elevated (%)
Means of transportation to work - Railroad (%)
Means of transportation to work - Ferryboat (%)
Means of transportation to work - Taxicab (%)
Means of transportation to work - Motorcycle (%)
Means of transportation to work - Bicycle (%)
Means of transportation to work - Walked (%)
Means of transportation to work - Other means (%)
Working at home (%)
Industry diversity
Most Common Industries - Agriculture, forestry, fishing and hunting, and mining (%)
Most Common Industries - Agriculture, forestry, fishing and hunting (%)
Most Common Industries - Mining, quarrying, and oil and gas extraction (%)
Most Common Industries - Construction (%)
Most Common Industries - Manufacturing (%)
Most Common Industries - Wholesale trade (%)
Most Common Industries - Retail trade (%)
Most Common Industries - Transportation and warehousing, and utilities (%)
Most Common Industries - Transportation and warehousing (%)
Most Common Industries - Utilities (%)
Most Common Industries - Information (%)
Most Common Industries - Finance and insurance, and real estate and rental and leasing (%)
Most Common Industries - Finance and insurance (%)
Most Common Industries - Real estate and rental and leasing (%)
Most Common Industries - Professional, scientific, and management, and administrative and waste management services (%)
Most Common Industries - Professional, scientific, and technical services (%)
Most Common Industries - Management of companies and enterprises (%)
Most Common Industries - Administrative and support and waste management services (%)
Most Common Industries - Educational services, and health care and social assistance (%)
Most Common Industries - Educational services (%)
Most Common Industries - Health care and social assistance (%)
Most Common Industries - Arts, entertainment, and recreation, and accommodation and food services (%)
Most Common Industries - Arts, entertainment, and recreation (%)
Most Common Industries - Accommodation and food services (%)
Most Common Industries - Other services, except public administration (%)
Most Common Industries - Public administration (%)
Occupation diversity
Most Common Occupations - Management, business, science, and arts occupations (%)
Most Common Occupations - Management, business, and financial occupations (%)
Most Common Occupations - Management occupations (%)
Most Common Occupations - Business and financial operations occupations (%)
Most Common Occupations - Computer, engineering, and science occupations (%)
Most Common Occupations - Computer and mathematical occupations (%)
Most Common Occupations - Architecture and engineering occupations (%)
Most Common Occupations - Life, physical, and social science occupations (%)
Most Common Occupations - Education, legal, community service, arts, and media occupations (%)
Most Common Occupations - Community and social service occupations (%)
Most Common Occupations - Legal occupations (%)
Most Common Occupations - Education, training, and library occupations (%)
Most Common Occupations - Arts, design, entertainment, sports, and media occupations (%)
Most Common Occupations - Healthcare practitioners and technical occupations (%)
Most Common Occupations - Health diagnosing and treating practitioners and other technical occupations (%)
Most Common Occupations - Health technologists and technicians (%)
Most Common Occupations - Service occupations (%)
Most Common Occupations - Healthcare support occupations (%)
Most Common Occupations - Protective service occupations (%)
Most Common Occupations - Fire fighting and prevention, and other protective service workers including supervisors (%)
Most Common Occupations - Law enforcement workers including supervisors (%)
Most Common Occupations - Food preparation and serving related occupations (%)
Most Common Occupations - Building and grounds cleaning and maintenance occupations (%)
Most Common Occupations - Personal care and service occupations (%)
Most Common Occupations - Sales and office occupations (%)
Most Common Occupations - Sales and related occupations (%)
Most Common Occupations - Office and administrative support occupations (%)
Most Common Occupations - Natural resources, construction, and maintenance occupations (%)
Most Common Occupations - Farming, fishing, and forestry occupations (%)
Most Common Occupations - Construction and extraction occupations (%)
Most Common Occupations - Installation, maintenance, and repair occupations (%)
Most Common Occupations - Production, transportation, and material moving occupations (%)
Most Common Occupations - Production occupations (%)
Most Common Occupations - Transportation occupations (%)
Most Common Occupations - Material moving occupations (%)
People in Group quarters - Institutionalized population (%)
People in Group quarters - Correctional institutions (%)
People in Group quarters - Federal prisons and detention centers (%)
People in Group quarters - Halfway houses (%)
People in Group quarters - Local jails and other confinement facilities (including police lockups) (%)
People in Group quarters - Military disciplinary barracks (%)
People in Group quarters - State prisons (%)
People in Group quarters - Other types of correctional institutions (%)
People in Group quarters - Nursing homes (%)
People in Group quarters - Hospitals/wards, hospices, and schools for the handicapped (%)
People in Group quarters - Hospitals/wards and hospices for chronically ill (%)
People in Group quarters - Hospices or homes for chronically ill (%)
People in Group quarters - Military hospitals or wards for chronically ill (%)
People in Group quarters - Other hospitals or wards for chronically ill (%)
People in Group quarters - Hospitals or wards for drug/alcohol abuse (%)
People in Group quarters - Mental (Psychiatric) hospitals or wards (%)
People in Group quarters - Schools, hospitals, or wards for the mentally retarded (%)
People in Group quarters - Schools, hospitals, or wards for the physically handicapped (%)
People in Group quarters - Institutions for the deaf (%)
People in Group quarters - Institutions for the blind (%)
People in Group quarters - Orthopedic wards and institutions for the physically handicapped (%)
People in Group quarters - Wards in general hospitals for patients who have no usual home elsewhere (%)
People in Group quarters - Wards in military hospitals for patients who have no usual home elsewhere (%)
People in Group quarters - Juvenile institutions (%)
People in Group quarters - Long-term care (%)
People in Group quarters - Homes for abused, dependent, and neglected children (%)
People in Group quarters - Residential treatment centers for emotionally disturbed children (%)
People in Group quarters - Training schools for juvenile delinquents (%)
People in Group quarters - Short-term care, detention or diagnostic centers for delinquent children (%)
People in Group quarters - Type of juvenile institution unknown (%)
People in Group quarters - Noninstitutionalized population (%)
People in Group quarters - College dormitories (includes college quarters off campus) (%)
People in Group quarters - Military quarters (%)
People in Group quarters - On base (%)
People in Group quarters - Barracks, unaccompanied personnel housing (UPH), (Enlisted/Officer), ;and similar group living quarters for military personnel (%)
People in Group quarters - Transient quarters for temporary residents (%)
People in Group quarters - Military ships (%)
People in Group quarters - Group homes (%)
People in Group quarters - Homes or halfway houses for drug/alcohol abuse (%)
People in Group quarters - Homes for the mentally ill (%)
People in Group quarters - Homes for the mentally retarded (%)
People in Group quarters - Homes for the physically handicapped (%)
People in Group quarters - Other group homes (%)
People in Group quarters - Religious group quarters (%)
People in Group quarters - Dormitories (%)
People in Group quarters - Agriculture workers' dormitories on farms (%)
People in Group quarters - Job Corps and vocational training facilities (%)
People in Group quarters - Other workers' dormitories (%)
People in Group quarters - Crews of maritime vessels (%)
People in Group quarters - Other nonhousehold living situations (%)
People in Group quarters - Other noninstitutional group quarters (%)
Residents speaking English at home (%)
Residents speaking English at home - Born in the United States (%)
Residents speaking English at home - Native, born elsewhere (%)
Residents speaking English at home - Foreign born (%)
Residents speaking Spanish at home (%)
Residents speaking Spanish at home - Born in the United States (%)
Residents speaking Spanish at home - Native, born elsewhere (%)
Residents speaking Spanish at home - Foreign born (%)
Residents speaking other language at home (%)
Residents speaking other language at home - Born in the United States (%)
Residents speaking other language at home - Native, born elsewhere (%)
Residents speaking other language at home - Foreign born (%)
Class of Workers - Employee of private company (%)
Class of Workers - Self-employed in own incorporated business (%)
Class of Workers - Private not-for-profit wage and salary workers (%)
Class of Workers - Local government workers (%)
Class of Workers - State government workers (%)
Class of Workers - Federal government workers (%)
Class of Workers - Self-employed workers in own not incorporated business and Unpaid family workers (%)
House heating fuel used in houses and condos - Utility gas (%)
House heating fuel used in houses and condos - Bottled, tank, or LP gas (%)
House heating fuel used in houses and condos - Electricity (%)
House heating fuel used in houses and condos - Fuel oil, kerosene, etc. (%)
House heating fuel used in houses and condos - Coal or coke (%)
House heating fuel used in houses and condos - Wood (%)
House heating fuel used in houses and condos - Solar energy (%)
House heating fuel used in houses and condos - Other fuel (%)
House heating fuel used in houses and condos - No fuel used (%)
House heating fuel used in apartments - Utility gas (%)
House heating fuel used in apartments - Bottled, tank, or LP gas (%)
House heating fuel used in apartments - Electricity (%)
House heating fuel used in apartments - Fuel oil, kerosene, etc. (%)
House heating fuel used in apartments - Coal or coke (%)
House heating fuel used in apartments - Wood (%)
House heating fuel used in apartments - Solar energy (%)
House heating fuel used in apartments - Other fuel (%)
House heating fuel used in apartments - No fuel used (%)
Armed forces status - In Armed Forces (%)
Armed forces status - Civilian (%)
Armed forces status - Civilian - Veteran (%)
Armed forces status - Civilian - Nonveteran (%)
Fatal accidents locations in years 2005-2021
Fatal accidents locations in 2005
Fatal accidents locations in 2006
Fatal accidents locations in 2007
Fatal accidents locations in 2008
Fatal accidents locations in 2009
Fatal accidents locations in 2010
Fatal accidents locations in 2011
Fatal accidents locations in 2012
Fatal accidents locations in 2013
Fatal accidents locations in 2014
Fatal accidents locations in 2015
Fatal accidents locations in 2016
Fatal accidents locations in 2017
Fatal accidents locations in 2018
Fatal accidents locations in 2019
Fatal accidents locations in 2020
Fatal accidents locations in 2021
Alcohol use - People drinking some alcohol every month (%)
Alcohol use - People not drinking at all (%)
Alcohol use - Average days/month drinking alcohol
Alcohol use - Average drinks/week
Alcohol use - Average days/year people drink much
Audiometry - Average condition of hearing (%)
Audiometry - People that can hear a whisper from across a quiet room (%)
Audiometry - People that can hear normal voice from across a quiet room (%)
Audiometry - Ears ringing, roaring, buzzing (%)
Audiometry - Had a job exposure to loud noise (%)
Audiometry - Had off-work exposure to loud noise (%)
Blood Pressure & Cholesterol - Has high blood pressure (%)
Blood Pressure & Cholesterol - Checking blood pressure at home (%)
Blood Pressure & Cholesterol - Frequently checking blood cholesterol (%)
Blood Pressure & Cholesterol - Has high cholesterol level (%)
Consumer Behavior - Money monthly spent on food at supermarket/grocery store
Consumer Behavior - Money monthly spent on food at other stores
Consumer Behavior - Money monthly spent on eating out
Consumer Behavior - Money monthly spent on carryout/delivered foods
Consumer Behavior - Income spent on food at supermarket/grocery store (%)
Consumer Behavior - Income spent on food at other stores (%)
Consumer Behavior - Income spent on eating out (%)
Consumer Behavior - Income spent on carryout/delivered foods (%)
Current Health Status - General health condition (%)
Current Health Status - Blood donors (%)
Current Health Status - Has blood ever tested for HIV virus (%)
Current Health Status - Left-handed people (%)
Dermatology - People using sunscreen (%)
Diabetes - Diabetics (%)
Diabetes - Had a blood test for high blood sugar (%)
Diabetes - People taking insulin (%)
Diet Behavior & Nutrition - Diet health (%)
Diet Behavior & Nutrition - Milk product consumption (# of products/month)
Diet Behavior & Nutrition - Meals not home prepared (#/week)
Diet Behavior & Nutrition - Meals from fast food or pizza place (#/week)
Diet Behavior & Nutrition - Ready-to-eat foods (#/month)
Diet Behavior & Nutrition - Frozen meals/pizza (#/month)
Drug Use - People that ever used marijuana or hashish (%)
Drug Use - Ever used hard drugs (%)
Drug Use - Ever used any form of cocaine (%)
Drug Use - Ever used heroin (%)
Drug Use - Ever used methamphetamine (%)
Health Insurance - People covered by health insurance (%)
Kidney Conditions-Urology - Avg. # of times urinating at night
Medical Conditions - People with asthma (%)
Medical Conditions - People with anemia (%)
Medical Conditions - People with psoriasis (%)
Medical Conditions - People with overweight (%)
Medical Conditions - Elderly people having difficulties in thinking or remembering (%)
Medical Conditions - People who ever received blood transfusion (%)
Medical Conditions - People having trouble seeing even with glass/contacts (%)
Medical Conditions - People with arthritis (%)
Medical Conditions - People with gout (%)
Medical Conditions - People with congestive heart failure (%)
Medical Conditions - People with coronary heart disease (%)
Medical Conditions - People with angina pectoris (%)
Medical Conditions - People who ever had heart attack (%)
Medical Conditions - People who ever had stroke (%)
Medical Conditions - People with emphysema (%)
Medical Conditions - People with thyroid problem (%)
Medical Conditions - People with chronic bronchitis (%)
Medical Conditions - People with any liver condition (%)
Medical Conditions - People who ever had cancer or malignancy (%)
Mental Health - People who have little interest in doing things (%)
Mental Health - People feeling down, depressed, or hopeless (%)
Mental Health - People who have trouble sleeping or sleeping too much (%)
Mental Health - People feeling tired or having little energy (%)
Mental Health - People with poor appetite or overeating (%)
Mental Health - People feeling bad about themself (%)
Mental Health - People who have trouble concentrating on things (%)
Mental Health - People moving or speaking slowly or too fast (%)
Mental Health - People having thoughts they would be better off dead (%)
Oral Health - Average years since last visit a dentist
Oral Health - People embarrassed because of mouth (%)
Oral Health - People with gum disease (%)
Oral Health - General health of teeth and gums (%)
Oral Health - Average days a week using dental floss/device
Oral Health - Average days a week using mouthwash for dental problem
Oral Health - Average number of teeth
Pesticide Use - Households using pesticides to control insects (%)
Pesticide Use - Households using pesticides to kill weeds (%)
Physical Activity - People doing vigorous-intensity work activities (%)
Physical Activity - People doing moderate-intensity work activities (%)
Physical Activity - People walking or bicycling (%)
Physical Activity - People doing vigorous-intensity recreational activities (%)
Physical Activity - People doing moderate-intensity recreational activities (%)
Physical Activity - Average hours a day doing sedentary activities
Physical Activity - Average hours a day watching TV or videos
Physical Activity - Average hours a day using computer
Physical Functioning - People having limitations keeping them from working (%)
Physical Functioning - People limited in amount of work they can do (%)
Physical Functioning - People that need special equipment to walk (%)
Physical Functioning - People experiencing confusion/memory problems (%)
Physical Functioning - People requiring special healthcare equipment (%)
Prescription Medications - Average number of prescription medicines taking
Preventive Aspirin Use - Adults 40+ taking low-dose aspirin (%)
Reproductive Health - Vaginal deliveries (%)
Reproductive Health - Cesarean deliveries (%)
Reproductive Health - Deliveries resulted in a live birth (%)
Reproductive Health - Pregnancies resulted in a delivery (%)
Reproductive Health - Women breastfeeding newborns (%)
Reproductive Health - Women that had a hysterectomy (%)
Reproductive Health - Women that had both ovaries removed (%)
Reproductive Health - Women that have ever taken birth control pills (%)
Reproductive Health - Women taking birth control pills (%)
Reproductive Health - Women that have ever used Depo-Provera or injectables (%)
Reproductive Health - Women that have ever used female hormones (%)
Sexual Behavior - People 18+ that ever had sex (vaginal, anal, or oral) (%)
Sexual Behavior - Males 18+ that ever had vaginal sex with a woman (%)
Sexual Behavior - Males 18+ that ever performed oral sex on a woman (%)
Sexual Behavior - Males 18+ that ever had anal sex with a woman (%)
Sexual Behavior - Males 18+ that ever had any sex with a man (%)
Sexual Behavior - Females 18+ that ever had vaginal sex with a man (%)
Sexual Behavior - Females 18+ that ever performed oral sex on a man (%)
Sexual Behavior - Females 18+ that ever had anal sex with a man (%)
Sexual Behavior - Females 18+ that ever had any kind of sex with a woman (%)
Sexual Behavior - Average age people first had sex
Sexual Behavior - Average number of female sex partners in lifetime (males 18+)
Sexual Behavior - Average number of female vaginal sex partners in lifetime (males 18+)
Sexual Behavior - Average age people first performed oral sex on a woman (18+)
Sexual Behavior - Average number of woman performed oral sex on in lifetime (18+)
Sexual Behavior - Average number of male sex partners in lifetime (males 18+)
Sexual Behavior - Average number of male anal sex partners in lifetime (males 18+)
Sexual Behavior - Average age people first performed oral sex on a man (18+)
Sexual Behavior - Average number of male oral sex partners in lifetime (18+)
Sexual Behavior - People using protection when performing oral sex (%)
Sexual Behavior - Average number of times people have vaginal or anal sex a year
Sexual Behavior - People having sex without condom (%)
Sexual Behavior - Average number of male sex partners in lifetime (females 18+)
Sexual Behavior - Average number of male vaginal sex partners in lifetime (females 18+)
Sexual Behavior - Average number of female sex partners in lifetime (females 18+)
Sexual Behavior - Circumcised males 18+ (%)
Sleep Disorders - Average hours sleeping at night
Sleep Disorders - People that has trouble sleeping (%)
Smoking-Cigarette Use - People smoking cigarettes (%)
Taste & Smell - People 40+ having problems with smell (%)
Taste & Smell - People 40+ having problems with taste (%)
Taste & Smell - People 40+ that ever had wisdom teeth removed (%)
Taste & Smell - People 40+ that ever had tonsils teeth removed (%)
Taste & Smell - People 40+ that ever had a loss of consciousness because of a head injury (%)
Taste & Smell - People 40+ that ever had a broken nose or other serious injury to face or skull (%)
Taste & Smell - People 40+ that ever had two or more sinus infections (%)
Weight - Average height (inches)
Weight - Average weight (pounds)
Weight - Average BMI
Weight - People that are obese (%)
Weight - People that ever were obese (%)
Weight - People trying to lose weight (%)
100%
rural population.
Estimated median house/condo value in 2022: $208,569
27298:
$208,569North Carolina:
$280,600
Median resident age: This zip code:
41.9 yearsNorth Carolina median age:
39.2 years
Average household size: This zip code:
2.7 peopleNorth Carolina:
2.4 people
Averages for the 2020 tax year for zip code 27298, filed in 2021:
Average Adjusted Gross Income (AGI) in 2020: $51,663 (Individual Income Tax Returns) Here:
$51,663State:
$70,020
Salary/wage: $46,289 (reported on 83.3% of returns )Here:
$46,289State:
$58,387
(% of AGI for various income ranges: 1198.2% for AGIs below $25k , 3788.3% for AGIs $25k-50k , 6951.9% for AGIs $50k-75k , 10574.5% for AGIs $75k-100k , 18899.6% for AGIs $100k-200k , 46850.0% for AGIs over 200k ) Taxable interest for individuals: $1,154 (reported on 25.7% of returns )This zip code:
$1,154North Carolina:
$1,479
(% of AGI for various income ranges: 15.8% for AGIs below $25k , 12.3% for AGIs $25k-50k , 33.7% for AGIs $50k-75k , 27.6% for AGIs $75k-100k , 127.8% for AGIs $100k-200k , 1730.0% for AGIs over 200k ) Ordinary dividends: $3,677 (reported on 12.4% of returns )(% of AGI for various income ranges: 15.4% for AGIs below $25k , 17.6% for AGIs $25k-50k , 53.0% for AGIs $50k-75k , 82.1% for AGIs $75k-100k , 360.7% for AGIs $100k-200k , 1213.3% for AGIs over 200k ) Net capital gain/loss in AGI: +$8,435 (reported on 11.6% of returns )Here:
+$8,435State:
+$23,652
(% of AGI for various income ranges: 5.0% for AGIs below $25k , 8.1% for AGIs $25k-50k , 66.3% for AGIs $50k-75k , 37.9% for AGIs $75k-100k , 764.1% for AGIs $100k-200k , 7090.0% for AGIs over 200k ) Profit/loss from business: +$10,651 (reported on 15.7% of returns )Here:
+$10,651State:
+$11,710
(% of AGI for various income ranges: 140.9% for AGIs below $25k , 147.8% for AGIs $25k-50k , 202.8% for AGIs $50k-75k , 289.0% for AGIs $75k-100k , 1083.0% for AGIs $100k-200k ) Taxable individual retirement arrangement distribution: $13,316 (reported on 9.0% of returns )27298:
$13,316North Carolina:
$20,247
(% of AGI for various income ranges: 74.3% for AGIs below $25k , 84.1% for AGIs $25k-50k , 201.5% for AGIs $50k-75k , 248.3% for AGIs $75k-100k , 822.2% for AGIs $100k-200k ) Total itemized deductions: $32,626 (reported on 3.9% of returns )Here:
$32,626State:
$34,549
(% of AGI for various income ranges: 47.6% for AGIs below $25k , 129.8% for AGIs $50k-75k , 268.6% for AGIs $75k-100k , 752.6% for AGIs $100k-200k , 7003.3% for AGIs over 200k ) Charity contributions: $14,527 (reported on 3.1% of returns )Here:
$14,527State:
$13,360
(% of AGI for various income ranges: 55.0% for AGIs $50k-75k , 252.6% for AGIs $100k-200k , 4000.0% for AGIs over 200k ) Taxes paid: $6,647 (reported on 3.9% of returns )(% of AGI for various income ranges: 8.0% for AGIs below $25k , 26.5% for AGIs $50k-75k , 53.4% for AGIs $75k-100k , 196.7% for AGIs $100k-200k , 1120.0% for AGIs over 200k ) Earned income credit: $2,313 (reported on 20.2% of returns )(% of AGI for various income ranges: 110.2% for AGIs below $25k , 85.8% for AGIs $25k-50k ) Percentage of individuals using paid preparers for their 2020 taxes: 91.6%(% for various income ranges: 90.0% for AGIs below $25k , 92.1% for AGIs $25k-50k , 93.5% for AGIs $50k-75k , 93.2% for AGIs $75k-100k , 92.3% for AGIs $100k-200k , 88.9% for AGIs over 200k )
Averages for the 2012 tax year for zip code 27298, filed in 2013:
Average Adjusted Gross Income (AGI) in 2012: $43,941 (Individual Income Tax Returns) Here:
$43,941State:
$54,937
Salary/wage: $38,596 (reported on 86.0% of returns )Here:
$38,596State:
$46,336
(% of AGI for various income ranges: 74.0% for AGIs below $25k , 83.2% for AGIs $25k-50k , 81.6% for AGIs $50k-75k , 80.4% for AGIs $75k-100k , 74.8% for AGIs $100k-200k , 34.0% for AGIs over 200k ) Taxable interest for individuals: $1,140 (reported on 30.3% of returns )This zip code:
$1,140North Carolina:
$1,298
(% of AGI for various income ranges: 1.1% for AGIs below $25k , 0.4% for AGIs $25k-50k , 0.5% for AGIs $50k-75k , 0.4% for AGIs $75k-100k , 1.2% for AGIs $100k-200k , 2.0% for AGIs over 200k ) Ordinary dividends: $2,824 (reported on 14.3% of returns )(% of AGI for various income ranges: 0.8% for AGIs below $25k , 0.5% for AGIs $25k-50k , 0.7% for AGIs $50k-75k , 0.9% for AGIs $75k-100k , 1.7% for AGIs $100k-200k , 1.3% for AGIs over 200k ) Net capital gain/loss in AGI: +$4,442 (reported on 10.9% of returns )Here:
+$4,442State:
+$12,740
(% of AGI for various income ranges: 0.3% for AGIs $25k-50k , 0.6% for AGIs $50k-75k , 0.4% for AGIs $75k-100k , 2.1% for AGIs $100k-200k , 5.1% for AGIs over 200k ) Profit/loss from business: +$7,872 (reported on 15.2% of returns )Here:
+$7,872State:
+$10,311
(% of AGI for various income ranges: 7.5% for AGIs below $25k , 2.8% for AGIs $25k-50k , 2.1% for AGIs $50k-75k , 2.3% for AGIs $75k-100k , 2.1% for AGIs $100k-200k ) Taxable individual retirement arrangement distribution: $12,132 (reported on 11.3% of returns )27298:
$12,132North Carolina:
$15,575
(% of AGI for various income ranges: 5.1% for AGIs below $25k , 2.2% for AGIs $25k-50k , 2.1% for AGIs $50k-75k , 3.4% for AGIs $75k-100k , 5.5% for AGIs $100k-200k ) Total itemized deductions: $18,448 (23% of AGI, reported on 27.8% of returns )Here:
$18,448State:
$23,438
Here:
23.1% of AGIState:
21.5% of AGI
(% of AGI for various income ranges: 8.5% for AGIs below $25k , 9.2% for AGIs $25k-50k , 10.3% for AGIs $50k-75k , 14.0% for AGIs $75k-100k , 15.7% for AGIs $100k-200k , 13.2% for AGIs over 200k ) Charity contributions: $3,904 (reported on 21.3% of returns )(% of AGI for various income ranges: 1.0% for AGIs below $25k , 1.1% for AGIs $25k-50k , 1.4% for AGIs $50k-75k , 2.3% for AGIs $75k-100k , 3.1% for AGIs $100k-200k , 3.1% for AGIs over 200k ) Taxes paid: $6,153 (reported on 27.8% of returns )(% of AGI for various income ranges: 1.3% for AGIs below $25k , 2.2% for AGIs $25k-50k , 3.0% for AGIs $50k-75k , 4.8% for AGIs $75k-100k , 6.6% for AGIs $100k-200k , 6.9% for AGIs over 200k ) Earned income credit: $2,157 (reported on 22.4% of returns )(% of AGI for various income ranges: 7.1% for AGIs below $25k , 1.2% for AGIs $25k-50k ) Percentage of individuals using paid preparers for their 2012 taxes: 57.0%(% for various income ranges: 53.4% for AGIs below $25k , 56.3% for AGIs $25k-50k , 61.8% for AGIs $50k-75k , 60.5% for AGIs $75k-100k , 64.3% for AGIs $100k-200k , 75.0% for AGIs over 200k )
Averages for the 2004 tax year for zip code 27298, filed in 2005:
Average Adjusted Gross Income (AGI) in 2004: $37,244 (Individual Income Tax Returns) Here:
$37,244State:
$45,376
Salary/wage: $34,230 (reported on 86.8% of returns )Here:
$34,230State:
$39,442
(% of AGI for various income ranges: 95.6% for AGIs below $10k , 80.4% for AGIs $10k-25k , 85.0% for AGIs $25k-50k , 85.9% for AGIs $50k-75k , 83.0% for AGIs $75k-100k , 57.1% for AGIs over 100k ) Taxable interest for individuals: $1,393 (reported on 39.0% of returns )This zip code:
$1,393North Carolina:
$1,515
(% of AGI for various income ranges: 5.1% for AGIs below $10k , 1.6% for AGIs $10k-25k , 1.0% for AGIs $25k-50k , 1.0% for AGIs $50k-75k , 1.2% for AGIs $75k-100k , 2.7% for AGIs over 100k ) Taxable dividends: $1,647 (reported on 18.2% of returns )(% of AGI for various income ranges: 2.2% for AGIs below $10k , 0.9% for AGIs $10k-25k , 0.6% for AGIs $25k-50k , 0.5% for AGIs $50k-75k , 0.8% for AGIs $75k-100k , 1.4% for AGIs over 100k ) Net capital gain/loss: +$4,145 (reported on 13.7% of returns )Here:
+$4,145State:
+$11,152
(% of AGI for various income ranges: -0.9% for AGIs below $10k , 0.9% for AGIs $10k-25k , 0.3% for AGIs $25k-50k , 0.7% for AGIs $50k-75k , 1.2% for AGIs $75k-100k , 5.8% for AGIs over 100k ) Profit/loss from business: +$9,211 (reported on 16.4% of returns )Here:
+$9,211State:
+$9,490
(% of AGI for various income ranges: 12.4% for AGIs below $10k , 5.9% for AGIs $10k-25k , 3.1% for AGIs $25k-50k , 3.1% for AGIs $50k-75k , 1.9% for AGIs $75k-100k , 6.8% for AGIs over 100k ) IRA payment deduction: $2,850 (reported on 2.8% of returns )27298:
$2,850North Carolina:
$2,967
(% of AGI for various income ranges: 0.3% for AGIs $10k-25k , 0.3% for AGIs $25k-50k , 0.2% for AGIs $50k-75k , 0.1% for AGIs $75k-100k , 0.2% for AGIs over 100k ) Self-employed pension: $12,067 (reported on 0.3% of returns )Here:
$12,067North Carolina:
$14,754
Total itemized deductions: $15,750 (24% of AGI, reported on 31.1% of returns )Here:
$15,750State:
$19,464
Here:
24.1% of AGIState:
22.7% of AGI
(% of AGI for various income ranges: 9.4% for AGIs below $10k , 7.7% for AGIs $10k-25k , 12.2% for AGIs $25k-50k , 14.2% for AGIs $50k-75k , 15.8% for AGIs $75k-100k , 15.1% for AGIs over 100k ) Charity contributions deductions: $3,059 (4% of AGI, reported on 26.1% of returns )Here:
4.5% of AGIState:
4.5% of AGI
(% of AGI for various income ranges: 1.0% for AGIs below $10k , 1.0% for AGIs $10k-25k , 1.9% for AGIs $25k-50k , 2.0% for AGIs $50k-75k , 2.8% for AGIs $75k-100k , 3.2% for AGIs over 100k ) Total tax: $4,557 (reported on 72.9% of returns )(% of AGI for various income ranges: 3.6% for AGIs below $10k , 3.8% for AGIs $10k-25k , 6.3% for AGIs $25k-50k , 8.1% for AGIs $50k-75k , 10.1% for AGIs $75k-100k , 17.7% for AGIs over 100k ) Earned income credit: $1,676 (reported on 18.2% of returns )Percentage of individuals using paid preparers for their 2004 taxes: 66.2%(% for various income ranges: 61.8% for AGIs below $10k , 67.0% for AGIs $10k-25k , 66.7% for AGIs $25k-50k , 66.9% for AGIs $50k-75k , 69.1% for AGIs $75k-100k , 69.6% for AGIs over 100k )
Estimated median household income in 2022: This zip code:
$60,089North Carolina:
$67,481
Nearest zip codes: 27355 ,
27283 ,
27233 ,
27349 ,
27377 ,
27215 .
Ramseur Zip Code Map
Percentage of family households: This zip code:
53.2%North Carolina:
46.1%
Percentage of households with unmarried partners: This zip code:
6.3%North Carolina:
47.9%
No gay or lesbian households reported
Household received Food Stamps/SNAP in the past 12 months: 976Household did not receive Food Stamps/SNAP in the past 12 months: 3,242
Women who had a birth in the past 12 months: 127 (75 now married , 51 unmarried) Women who did not have a birth in the past 12 months: 2,344 (1,106 now married , 1,240 unmarried)
Housing units in zip code 27298 with a mortgage: 1,451 (229
second mortgage , 3
home equity loan , 190
both second mortgage and home equity loan )
Houses without a mortgage: 117
Median monthly owner costs for units with a mortgage: $1,240
Median monthly owner costs for units without a mortgage: $407
Residents with income below the poverty level in 2022:
This zip code:
12.5%Whole state:
12.8%
Residents with income below 50% of the poverty level in 2022:
This zip code:
7.5%Whole state:
6.8%
Median number of rooms in houses and condos: Median number of rooms in apartments: Notable locations in this zip code not listed on our city pages
Click to draw/clear zip code borders Notable locations in zip code 27298: (A) , Rising Meadow Farm (B) , Gilmore Plant and Bulb Farm (C) , B J Poultry Farm (D) , Fox Turkey Farm (E) . Display/hide their locations on the map
Churches in zip code 27298 include: (A) , Liberty Grove Church (B) , Louise Grove Church (C) , Lows Church (D) , Macedonia Church (E) , Beulah Church (F) , Mount Pleasant Church (G) , Mount Zion Church (H) , Oak Grove Church (I) . Display/hide their locations on the map
Cemeteries: (1) , Amose Grove Cemetery (2) . Display/hide their locations on the map
Lakes and reservoirs: (A) , Kimesville Lake (B) , Sizemore Lake (C) , Dodsons Lake (D) , Richardson Pond (E) , Staley Mill Lake (F) , Wayne Isley Lake (G) . Display/hide their locations on the map
Creeks: (A) , Boodom Creek (B) , Poppaw Creek (C) , Little Creek (D) . Display/hide their locations on the map
Year house built (houses)
61 2020 or later482 2010 to 2019661 2000 to 2009659 1990 to 1999705 1980 to 1989695 1970 to 1979251 1960 to 1969332 1950 to 1959151 1940 to 1949324 1939 or earlier
Zip code 27298 household income distribution in 2022 168 Less than $10,000184 $10,000 to $14,999197 $15,000 to $19,999139 $20,000 to $24,999108 $25,000 to $29,999234 $30,000 to $34,999230 $35,000 to $39,999185 $40,000 to $44,999240 $45,000 to $49,999410 $50,000 to $59,999451 $60,000 to $74,999634 $75,000 to $99,999340 $100,000 to $124,999258 $125,000 to $149,999255 $150,000 to $199,999126 $200,000 or moreEstimate of home value of owner-occupied houses/condos in 2022 in zip code 27298 119 Less than $10,00023 $10,000 to $14,99971 $15,000 to $19,99932 $20,000 to $24,99953 $25,000 to $29,99966 $30,000 to $34,9996 $35,000 to $39,99929 $40,000 to $49,99942 $50,000 to $59,99974 $60,000 to $69,99994 $70,000 to $79,9996 $80,000 to $89,99913 $90,000 to $99,999147 $100,000 to $124,999197 $125,000 to $149,999260 $150,000 to $174,999190 $175,000 to $199,999387 $200,000 to $249,999317 $250,000 to $299,999208 $300,000 to $399,99976 $400,000 to $499,999157 $500,000 to $749,99934 $750,000 to $999,99974 $1,000,000 to $1,499,99925 $2,000,000 or moreRent paid by renters in 2022 in zip code 27298 4 $150 to $199144 $200 to $2492 $250 to $29910 $300 to $34934 $350 to $39944 $400 to $449159 $450 to $499200 $500 to $54932 $550 to $59988 $600 to $6499 $650 to $699164 $700 to $74915 $750 to $79921 $800 to $89948 $900 to $99942 $1,000 to $1,249106 No cash rent
Median gross rent in 2022: $883.
Median price asked for vacant for-sale houses and condos in 2022: $409,179.
Estimated median house (or condo) value in 2022 for: White Non-Hispanic householders: $230,707Black or African American householders: $188,993American Indian or Alaska Native householders: $221,385Some other race householders: $151,474Two or more races householders: $262,167Hispanic or Latino householders: $203,907Estimated median house or condo value in 2022: $208,569
27298:
$208,569North Carolina:
$280,600
Lower value quartile - upper value quartile: $125,049 - $297,373
Mean price in 2022: Detached houses: $200,399Here:
$200,399State:
$375,326
Mobile homes: $89,584Here:
$89,584State:
$124,933
Housing units in structures:
One, detached: 2,912One, attached: 5Two: 823 or 4: 505 to 9: 5110 to 19: 14220 to 49: 21Mobile homes: 1,141Unemployment : 5.9%
Means of transportation to work in zip code 27298 67.8% 3,384 Drove a car alone15.2% 760 Carpooled0.3% 17 Walked1.6% 81 Other means14.8% 736 Worked at homeTravel time to work (commute) in zip code 27298 274 Less than 5 minutes405 5 to 9 minutes454 10 to 14 minutes388 15 to 19 minutes360 20 to 24 minutes334 25 to 29 minutes891 30 to 34 minutes208 35 to 39 minutes346 40 to 44 minutes294 45 to 59 minutes87 60 to 89 minutes176 90 or more minutes
Percentage of zip code residents living and working in this county: 53.2%
Household type by relationship:
Households: 11,397
Male householders: 1,834 (474 living alone ), Female householders: 2,349 (502 living alone )2,469 spouses (2,428 opposite-sex spouses ), 265 unmarried partners , (265 opposite-sex unmarried partners ), 3,159 children (2,948 natural , 69 adopted , 142 stepchildren ), 454 grandchildren , 230 brothers or sisters , 285 parents , 0 foster children , 252 other relatives , 69 non-relatives In group quarters: 31 (-1 institutionalized population )
Size of family households: 1,507 2-persons , 607 3-persons , 640 4-persons , 263 5-persons , 85 6-persons , 31 7-or-more-persons
Size of nonfamily households: 977 1-person , 60 2-persons
1,625 married couples with children. single-parent households (47 men , 305 women ).
89.0% of residents of 27298 zip code speak English at home. of residents speak Spanish at home (39% very well, 30% well, 18% not well, 13% not at all ).of residents speak other Indo-European language at home (90% very well, 10% well ).of residents speak Asian or Pacific Island language at home (20% well, 34% not well, 46% not at all ).
Foreign born population: 819 (7.2%)
(11.6%
of them are naturalized citizens )
This zip code:
7.2%Whole state:
8.6%
73% Honduras 8% El Salvador 3% Iran 3% Romania 1% Greece 1% Guatemala 0% Guyana 15% American 13% English 10% German 9% Irish 2% African 1% Scottish 1% Scotch-Irish
Year of entry for the foreign-born population
354 2010 or later 180 2000 to 2009 237 1990 to 1999 152 Before 1990
Facilities with environmental interests located in this zip code:
AMERICAN BUILDING COMPANY (6306 OLD 421 ROAD in LIBERTY, NC)
AIR MINOR (AIRS/AFS) STATE MASTER (North Carolina facility info) - -115DA4YG00M29W84AX3YG48879, WASTEWATER FACILITY, -4187, AIR PROGRAM CRITERIA AND HAZARDOUS AIR POLLUTANT INVENTORY (Inventory of air pollution sources) National Pollutant Discharge Elimination System NON-MAJOR (Tracking pollutant discharge elimination systems) - permit Conditionally Exempt Small Quantity Generators, less than 100 kg/month of hazardous waste (Resource Conservation and Recovery Act (tracking hazardous waste)) - notification Business SIC classification: PREFABRICATED METAL BUILDINGS AND COMPONENTSBusiness NAICS classification: PREFABRICATED METAL BUILDING AND COMPONENT MANUFACTURING.; PREFABRICATED METAL BUILDING AND COMPONENT MANUFACTURING.Organizations: BCU LLC (CONTACT/OWNER)
Alternative names: AMERICAN MODULAR TECHNOLOGIES, BCU AMT DBA AMERICAN MODULAR TECHNOLOGIEs
CAUSEY AVIATION SERVICE INC (6120 SMITHWOOD RD in LIBERTY, NC)
STATE MASTER (North Carolina facility info) - UNDERGROUND STORAGE TANK PROGRAM Conditionally Exempt Small Quantity Generators, less than 100 kg/month of hazardous waste (Resource Conservation and Recovery Act (tracking hazardous waste)) - notification Business SIC classification: NONCLASSIFIABLE ESTABLISHMENTSOrganizations: CAUSEY B W JR (CONTACT/OWNER)
CHAIR CO (457 W SWANNANOA in LIBERTY, NC)
TRI REPORTER (Tracking of toxic chemicals releasing facilities) Business SIC classification: WOOD HOUSEHOLD FURNITURE, UPHOLSTERED
Housing units lacking complete plumbing facilities: 2.1%
Housing units lacking complete kitchen facilities: 1.9%
60.3% Electricity 16.9% Bottled, tank, or LP gas 11.6% Utility gas 7.0% Fuel oil, kerosene, etc. 3.8% Wood
Population in 1990: 7,303. Population change in the 1990s: +2,224 (+30.5%).
Place of birth for U.S.-born residents:
This state: 8,040Northeast: 652Midwest: 407South: 1,139West: 135
65% of the 27298 zip code residents lived in the same house 5 years ago.
Out of people who lived in different houses, 48% lived in this county.
Out of people who lived in different counties, 50% lived in North Carolina.
95% of the 27298 zip code residents lived in the same house 1 year ago.
Out of people who lived in different houses, 40% moved from this county.
Out of people who lived in different houses, 63% moved from different county within same state.
Out of people who lived in different houses, 6% moved from different state.
Private vs. public school enrollment:
Students in private schools in grades 1 to 8 (elementary and middle school): 220
Here:
19.9%North Carolina:
13.8%
Students in private schools in grades 9 to 12 (high school): 108
Here:
21.1%North Carolina:
11.9%
Students in private undergraduate colleges: 50
Here:
17.2%North Carolina:
19.3%
Occupation by median earnings in the past 12 months ($)
86,627 Management occupations 76,553 Health diagnosing and treating practitioners and other technical occupations 72,533 Computer and mathematical occupations 64,334 Architecture and engineering occupations 56,816 Transportation occupations 51,134 Community and social service occupations
Companies with federal contracts located in this zip code:
CROMER ASSOCIATES INC (124 W SWANNANOA AVE in LIBERTY, NC; small business)
$44,160 with Air Force for Recreational and Gymnastic Equipment. Signed on 2003-06-10. Completion date: 2003-10-08.
RANDOLPH TELEPHONE COMPANY (211 W SWANNANOA AVE in LIBERTY, NC; small business)
$5,000 with Department of Defense for ADP Telecommunications and Transmission Services. Signed on 2002-12-31. Completion date: 2012-12-01.
RUBBERMILL INC (9897 OLD LIBERTY RD in LIBERTY, NC; small business)
$1,280 with Navy for Plate, Sheet, Strip, and Foil; Nonferrous Base Metal. Signed on 2005-06-13. Completion date: 2005-07-25.
Top industries in this zip code by the number of employees in 2005:
Wholesale Trade: Flower, Nursery Stock, and Florists' Supplies Merchant Wholesalers (50-99 employees: 1 establishment)
People in group quarters in 2010:
19 people in group homes intended for adults
6 people in workers' group living quarters and job corps centers
People in group quarters in 2000:
19 people in other noninstitutional group quarters
Fatal accident statistics in 2014:
Fatal accident count: 1Vehicles involved in fatal accidents: 1Fatal accidents caused by drunken drivers: 1Fatalities: 1Persons involved in fatal accidents: 2Pedestrians involved in fatal accidents: 0
Fatal accident statistics in 2013:
Fatal accident count: 3Vehicles involved in fatal accidents: 3Fatal accidents caused by drunken drivers: 1Fatalities: 3Persons involved in fatal accidents: 6Pedestrians involved in fatal accidents: 1
Home Mortgage Disclosure Act Aggregated Statistics For Year 2009(Based on 10 partial tracts) A) FHA, FSA/RHS & VA B) Conventional C) Refinancings D) Home Improvement Loans F) Non-occupant Loans on G) Loans On Manufactured Number Average Value Number Average Value Number Average Value Number Average Value Number Average Value Number Average Value
LOANS ORIGINATED 78 $127,616 85 $136,511 386 $141,745 14 $40,540 23 $108,266 34 $74,346 APPLICATIONS APPROVED, NOT ACCEPTED 3 $123,317 5 $130,582 26 $125,010 0 $0 1 $193,830 3 $62,507 APPLICATIONS DENIED 21 $136,638 21 $115,708 144 $141,908 15 $25,658 10 $86,355 44 $75,251 APPLICATIONS WITHDRAWN 10 $146,749 7 $149,323 88 $151,819 2 $89,085 4 $114,838 12 $94,842 FILES CLOSED FOR INCOMPLETENESS 0 $0 0 $0 22 $183,998 0 $0 0 $0 1 $105,410
Aggregated Statistics For Year 2008(Based on 10 partial tracts) A) FHA, FSA/RHS & VA B) Conventional C) Refinancings D) Home Improvement Loans E) Loans on Dwellings For 5+ Families F) Non-occupant Loans on G) Loans On Manufactured Number Average Value Number Average Value Number Average Value Number Average Value Number Average Value Number Average Value Number Average Value
LOANS ORIGINATED 79 $128,146 133 $171,338 279 $127,484 24 $59,531 2 $314,630 38 $113,073 41 $84,094 APPLICATIONS APPROVED, NOT ACCEPTED 9 $115,081 8 $192,386 44 $131,383 6 $29,000 0 $0 4 $27,948 13 $78,548 APPLICATIONS DENIED 16 $136,828 38 $121,573 242 $117,908 40 $36,724 0 $0 8 $101,916 51 $80,238 APPLICATIONS WITHDRAWN 9 $117,902 18 $144,866 72 $126,517 6 $69,987 0 $0 4 $86,025 14 $76,766 FILES CLOSED FOR INCOMPLETENESS 3 $155,557 3 $242,850 10 $142,529 1 $1,330 0 $0 0 $0 0 $0
Aggregated Statistics For Year 2007(Based on 10 partial tracts) A) FHA, FSA/RHS & VA B) Conventional C) Refinancings D) Home Improvement Loans E) Loans on Dwellings For 5+ Families F) Non-occupant Loans on G) Loans On Manufactured Number Average Value Number Average Value Number Average Value Number Average Value Number Average Value Number Average Value Number Average Value
LOANS ORIGINATED 49 $133,200 243 $140,355 305 $114,142 36 $44,393 1 $215,340 44 $113,645 61 $72,379 APPLICATIONS APPROVED, NOT ACCEPTED 0 $0 28 $124,835 60 $83,214 10 $76,962 0 $0 7 $49,003 9 $64,740 APPLICATIONS DENIED 6 $154,573 39 $130,533 317 $111,370 50 $54,441 0 $0 13 $83,244 58 $80,299 APPLICATIONS WITHDRAWN 8 $123,136 25 $125,981 112 $129,683 8 $110,550 0 $0 7 $128,240 12 $71,861 FILES CLOSED FOR INCOMPLETENESS 0 $0 5 $66,010 19 $128,169 0 $0 0 $0 2 $76,035 1 $108,000
Aggregated Statistics For Year 2006(Based on 10 partial tracts) A) FHA, FSA/RHS & VA B) Conventional C) Refinancings D) Home Improvement Loans E) Loans on Dwellings For 5+ Families F) Non-occupant Loans on G) Loans On Manufactured Number Average Value Number Average Value Number Average Value Number Average Value Number Average Value Number Average Value Number Average Value
LOANS ORIGINATED 62 $117,194 323 $118,008 358 $106,377 44 $51,892 2 $294,880 72 $82,811 64 $73,960 APPLICATIONS APPROVED, NOT ACCEPTED 3 $123,517 35 $89,291 87 $93,798 9 $37,324 0 $0 7 $73,034 18 $57,971 APPLICATIONS DENIED 9 $121,571 97 $100,808 362 $110,992 47 $49,134 0 $0 17 $121,124 79 $66,943 APPLICATIONS WITHDRAWN 5 $88,336 29 $138,233 129 $125,190 12 $78,489 0 $0 1 $223,960 9 $85,637 FILES CLOSED FOR INCOMPLETENESS 0 $0 11 $117,791 43 $133,797 0 $0 0 $0 3 $70,030 1 $88,130
Aggregated Statistics For Year 2005(Based on 10 partial tracts) A) FHA, FSA/RHS & VA B) Conventional C) Refinancings D) Home Improvement Loans F) Non-occupant Loans on G) Loans On Manufactured Number Average Value Number Average Value Number Average Value Number Average Value Number Average Value Number Average Value
LOANS ORIGINATED 53 $106,608 254 $110,301 362 $103,502 49 $66,045 52 $70,385 89 $71,702 APPLICATIONS APPROVED, NOT ACCEPTED 6 $76,808 39 $77,775 80 $107,711 10 $25,844 4 $44,750 23 $49,734 APPLICATIONS DENIED 14 $97,309 111 $88,374 371 $101,068 55 $59,802 13 $73,149 99 $69,106 APPLICATIONS WITHDRAWN 8 $99,108 40 $117,416 147 $118,443 19 $154,807 13 $90,874 23 $87,429 FILES CLOSED FOR INCOMPLETENESS 1 $100,720 9 $144,600 72 $117,987 0 $0 1 $46,380 7 $81,296
Aggregated Statistics For Year 2004(Based on 10 partial tracts) A) FHA, FSA/RHS & VA B) Conventional C) Refinancings D) Home Improvement Loans E) Loans on Dwellings For 5+ Families F) Non-occupant Loans on G) Loans On Manufactured Number Average Value Number Average Value Number Average Value Number Average Value Number Average Value Number Average Value Number Average Value
LOANS ORIGINATED 66 $112,010 275 $107,022 392 $110,402 48 $47,460 2 $167,175 64 $76,154 93 $74,665 APPLICATIONS APPROVED, NOT ACCEPTED 5 $98,612 29 $93,297 57 $89,264 6 $19,048 0 $0 2 $72,870 22 $56,847 APPLICATIONS DENIED 20 $93,212 92 $78,449 390 $110,496 38 $58,229 0 $0 20 $57,228 108 $64,738 APPLICATIONS WITHDRAWN 9 $112,186 42 $112,733 164 $118,219 10 $46,753 0 $0 6 $137,642 26 $95,453 FILES CLOSED FOR INCOMPLETENESS 3 $117,113 4 $258,350 65 $111,170 2 $27,775 0 $0 0 $0 12 $90,433
Aggregated Statistics For Year 2003(Based on 10 partial tracts) A) FHA, FSA/RHS & VA B) Conventional C) Refinancings D) Home Improvement Loans F) Non-occupant Loans on Number Average Value Number Average Value Number Average Value Number Average Value Number Average Value
LOANS ORIGINATED 47 $111,553 235 $104,514 833 $115,179 20 $28,998 67 $78,440 APPLICATIONS APPROVED, NOT ACCEPTED 2 $108,185 50 $77,009 94 $104,055 11 $19,261 5 $47,810 APPLICATIONS DENIED 8 $92,058 124 $65,285 389 $92,082 37 $26,528 7 $97,537 APPLICATIONS WITHDRAWN 7 $99,334 31 $132,560 159 $110,554 7 $71,890 7 $136,554 FILES CLOSED FOR INCOMPLETENESS 3 $81,270 2 $173,110 25 $104,249 0 $0 1 $92,100
Aggregated Statistics For Year 2002(Based on 10 partial tracts) A) FHA, FSA/RHS & VA B) Conventional C) Refinancings D) Home Improvement Loans F) Non-occupant Loans on Number Average Value Number Average Value Number Average Value Number Average Value Number Average Value
LOANS ORIGINATED 32 $103,151 228 $107,838 559 $104,494 30 $19,167 46 $69,265 APPLICATIONS APPROVED, NOT ACCEPTED 5 $104,446 62 $64,026 99 $87,647 17 $33,238 2 $58,535 APPLICATIONS DENIED 13 $114,421 123 $61,719 285 $92,100 31 $14,949 6 $60,700 APPLICATIONS WITHDRAWN 4 $128,985 16 $109,558 107 $100,179 2 $40,340 2 $71,625 FILES CLOSED FOR INCOMPLETENESS 1 $78,190 8 $82,802 21 $84,970 2 $31,745 1 $56,170
Aggregated Statistics For Year 2001(Based on 10 partial tracts) A) FHA, FSA/RHS & VA B) Conventional C) Refinancings D) Home Improvement Loans F) Non-occupant Loans on Number Average Value Number Average Value Number Average Value Number Average Value Number Average Value
LOANS ORIGINATED 39 $88,778 196 $99,911 517 $101,782 42 $24,467 45 $66,945 APPLICATIONS APPROVED, NOT ACCEPTED 6 $53,648 74 $55,998 77 $96,121 4 $12,755 5 $41,200 APPLICATIONS DENIED 7 $77,067 133 $65,107 264 $82,772 40 $17,425 15 $91,735 APPLICATIONS WITHDRAWN 2 $126,555 28 $93,278 85 $93,400 13 $36,914 2 $96,820 FILES CLOSED FOR INCOMPLETENESS 3 $96,017 9 $98,494 21 $135,590 2 $30,690 1 $86,800
Aggregated Statistics For Year 2000(Based on 10 partial tracts) A) FHA, FSA/RHS & VA B) Conventional C) Refinancings D) Home Improvement Loans F) Non-occupant Loans on Number Average Value Number Average Value Number Average Value Number Average Value Number Average Value
LOANS ORIGINATED 37 $96,763 233 $87,423 186 $85,855 37 $15,699 33 $76,267 APPLICATIONS APPROVED, NOT ACCEPTED 22 $45,391 79 $55,451 87 $72,820 18 $15,272 6 $33,775 APPLICATIONS DENIED 21 $57,369 234 $51,974 252 $67,517 33 $34,083 12 $59,801 APPLICATIONS WITHDRAWN 8 $80,491 32 $85,961 85 $79,270 8 $39,241 2 $76,570 FILES CLOSED FOR INCOMPLETENESS 1 $117,940 6 $104,592 25 $88,818 0 $0 0 $0
Aggregated Statistics For Year 1999(Based on 5 partial tracts) A) FHA, FSA/RHS & VA B) Conventional C) Refinancings D) Home Improvement Loans F) Non-occupant Loans on Number Average Value Number Average Value Number Average Value Number Average Value Number Average Value
LOANS ORIGINATED 31 $97,590 160 $80,164 180 $80,985 27 $32,219 19 $66,453 APPLICATIONS APPROVED, NOT ACCEPTED 0 $0 59 $50,166 54 $71,914 10 $19,840 4 $79,092 APPLICATIONS DENIED 2 $118,570 133 $58,361 131 $69,001 17 $24,362 12 $57,302 APPLICATIONS WITHDRAWN 2 $102,980 16 $80,104 56 $68,716 3 $60,333 2 $49,115 FILES CLOSED FOR INCOMPLETENESS 1 $93,030 3 $81,157 25 $88,694 0 $0 0 $0
Detailed HMDA statistics for the following Tracts:
0170.00
,
0218.00 ,
0310.00 ,
0312.00
Private Mortgage Insurance Companies Aggregated Statistics For Year 2009(Based on 10 partial tracts) A) Conventional B) Refinancings C) Non-occupant Loans on Number Average Value Number Average Value Number Average Value
LOANS ORIGINATED 16 $151,418 24 $177,212 0 $0 APPLICATIONS APPROVED, NOT ACCEPTED 2 $196,600 3 $270,463 0 $0 APPLICATIONS DENIED 2 $253,925 3 $180,597 0 $0 APPLICATIONS WITHDRAWN 1 $94,750 1 $206,070 0 $0 FILES CLOSED FOR INCOMPLETENESS 0 $0 1 $102,880 1 $84,150
Aggregated Statistics For Year 2008(Based on 10 partial tracts) A) Conventional B) Refinancings C) Non-occupant Loans on D) Loans On Manufactured Number Average Value Number Average Value Number Average Value Number Average Value
LOANS ORIGINATED 41 $169,243 26 $154,901 2 $242,940 1 $105,350 APPLICATIONS APPROVED, NOT ACCEPTED 12 $182,285 11 $191,664 3 $135,390 1 $82,830 APPLICATIONS DENIED 2 $173,175 0 $0 1 $181,590 0 $0 APPLICATIONS WITHDRAWN 0 $0 1 $149,090 0 $0 0 $0 FILES CLOSED FOR INCOMPLETENESS 1 $93,010 1 $108,670 0 $0 0 $0
Aggregated Statistics For Year 2007(Based on 10 partial tracts) A) Conventional B) Refinancings C) Non-occupant Loans on Number Average Value Number Average Value Number Average Value
LOANS ORIGINATED 63 $149,953 23 $149,920 2 $43,720 APPLICATIONS APPROVED, NOT ACCEPTED 9 $159,984 8 $185,250 2 $121,395 APPLICATIONS DENIED 2 $97,460 0 $0 0 $0 APPLICATIONS WITHDRAWN 8 $189,550 7 $103,691 5 $102,420 FILES CLOSED FOR INCOMPLETENESS 2 $38,580 0 $0 2 $38,580
Aggregated Statistics For Year 2006(Based on 10 partial tracts) A) Conventional B) Refinancings C) Non-occupant Loans on D) Loans On Manufactured Number Average Value Number Average Value Number Average Value Number Average Value
LOANS ORIGINATED 62 $139,169 43 $148,043 9 $125,491 1 $47,040 APPLICATIONS APPROVED, NOT ACCEPTED 8 $122,524 3 $155,393 1 $147,930 0 $0 APPLICATIONS DENIED 2 $47,150 0 $0 0 $0 0 $0 APPLICATIONS WITHDRAWN 5 $279,136 2 $171,175 0 $0 0 $0 FILES CLOSED FOR INCOMPLETENESS 1 $72,220 0 $0 0 $0 0 $0
Aggregated Statistics For Year 2005(Based on 10 partial tracts) A) Conventional B) Refinancings C) Non-occupant Loans on D) Loans On Manufactured Number Average Value Number Average Value Number Average Value Number Average Value
LOANS ORIGINATED 40 $124,920 40 $140,556 4 $108,240 4 $75,710 APPLICATIONS APPROVED, NOT ACCEPTED 7 $117,284 9 $143,054 0 $0 4 $67,428 APPLICATIONS DENIED 1 $180,700 0 $0 0 $0 0 $0 APPLICATIONS WITHDRAWN 2 $121,735 7 $200,624 2 $121,735 0 $0 FILES CLOSED FOR INCOMPLETENESS 0 $0 2 $144,740 0 $0 0 $0
Aggregated Statistics For Year 2004(Based on 10 partial tracts) A) Conventional B) Refinancings C) Non-occupant Loans on D) Loans On Manufactured Number Average Value Number Average Value Number Average Value Number Average Value
LOANS ORIGINATED 55 $107,550 49 $133,504 2 $80,145 10 $86,638 APPLICATIONS APPROVED, NOT ACCEPTED 8 $140,430 25 $126,275 0 $0 2 $89,435 APPLICATIONS DENIED 2 $99,445 4 $96,842 2 $118,595 1 $98,320 APPLICATIONS WITHDRAWN 15 $146,550 6 $120,035 10 $146,084 0 $0 FILES CLOSED FOR INCOMPLETENESS 2 $86,230 0 $0 0 $0 1 $122,240
Aggregated Statistics For Year 2003(Based on 10 partial tracts) A) Conventional B) Refinancings C) Non-occupant Loans on Number Average Value Number Average Value Number Average Value
LOANS ORIGINATED 68 $125,170 113 $119,532 5 $80,156 APPLICATIONS APPROVED, NOT ACCEPTED 19 $121,019 36 $112,211 3 $69,497 APPLICATIONS DENIED 2 $114,020 7 $105,801 2 $174,315 APPLICATIONS WITHDRAWN 5 $115,678 8 $117,769 1 $147,930 FILES CLOSED FOR INCOMPLETENESS 0 $0 1 $62,280 0 $0
Aggregated Statistics For Year 2002(Based on 10 partial tracts) A) Conventional B) Refinancings Number Average Value Number Average Value
LOANS ORIGINATED 59 $125,053 100 $121,030 APPLICATIONS APPROVED, NOT ACCEPTED 3 $109,580 21 $130,480 APPLICATIONS DENIED 2 $137,330 6 $124,253 APPLICATIONS WITHDRAWN 3 $102,757 6 $185,067 FILES CLOSED FOR INCOMPLETENESS 0 $0 2 $107,165
Aggregated Statistics For Year 2001(Based on 10 partial tracts) A) Conventional B) Refinancings C) Non-occupant Loans on Number Average Value Number Average Value Number Average Value
LOANS ORIGINATED 64 $120,109 95 $117,901 1 $133,470 APPLICATIONS APPROVED, NOT ACCEPTED 11 $141,703 16 $131,246 0 $0 APPLICATIONS DENIED 2 $70,205 2 $83,330 0 $0 APPLICATIONS WITHDRAWN 0 $0 7 $112,256 0 $0 FILES CLOSED FOR INCOMPLETENESS 0 $0 3 $118,403 0 $0
Aggregated Statistics For Year 2000(Based on 10 partial tracts) A) Conventional B) Refinancings C) Non-occupant Loans on Number Average Value Number Average Value Number Average Value
LOANS ORIGINATED 51 $111,514 20 $104,218 2 $31,720 APPLICATIONS APPROVED, NOT ACCEPTED 2 $119,240 7 $106,306 0 $0 APPLICATIONS DENIED 0 $0 2 $97,090 0 $0 APPLICATIONS WITHDRAWN 0 $0 2 $73,730 0 $0 FILES CLOSED FOR INCOMPLETENESS 1 $76,520 0 $0 0 $0
Aggregated Statistics For Year 1999(Based on 5 partial tracts) A) Conventional B) Refinancings C) Non-occupant Loans on Number Average Value Number Average Value Number Average Value
LOANS ORIGINATED 27 $107,061 8 $100,880 1 $122,900 APPLICATIONS APPROVED, NOT ACCEPTED 3 $145,497 4 $115,122 0 $0 APPLICATIONS DENIED 1 $141,980 0 $0 0 $0 APPLICATIONS WITHDRAWN 1 $108,420 0 $0 0 $0 FILES CLOSED FOR INCOMPLETENESS 0 $0 0 $0 0 $0
Detailed PMIC statistics for the following Tracts:
0170.00
,
0218.00 ,
0310.00 ,
0312.00
2002 - 2018 National Fire Incident Reporting System (NFIRS) incidents See full 2006 National Fire Incident Reporting System statistics for zip code 27298, North Carolina
Most common first names in zip code 27298 among deceased individuals Name Count Lived (average)
James 91 74.0 years John 84 75.1 years William 68 72.9 years Mary 67 76.6 years Robert 38 69.2 years Thomas 30 71.5 years Charles 28 70.2 years George 24 76.9 years Annie 23 78.7 years Clarence 23 75.5 years
Most common last names in zip code 27298 among deceased individuals Last name Count Lived (average)
Smith 105 77.1 years Staley 38 75.8 years Coble 36 75.7 years Bowman 35 73.3 years Fogleman 34 79.6 years Shoffner 34 74.8 years Johnson 33 77.7 years Humble 33 73.7 years Williams 27 72.1 years York 25 76.9 years
Businesses in zip code 27298
Name Count Name Count
Advance Auto Parts 1 Ford 1 CVS 1 UPS 1

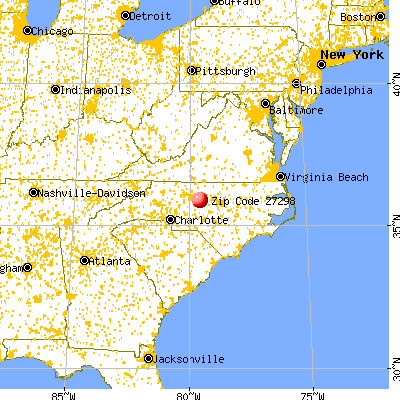


 Nearest zip codes: 27355, 27283, 27233, 27349, 27377, 27215.
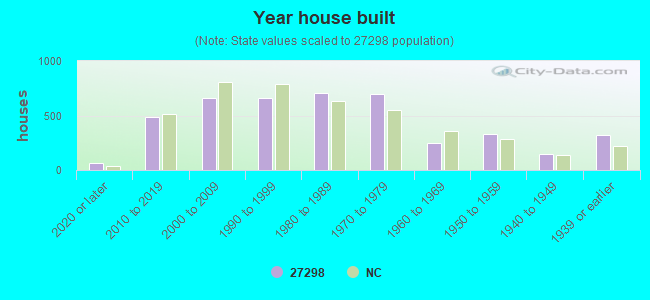
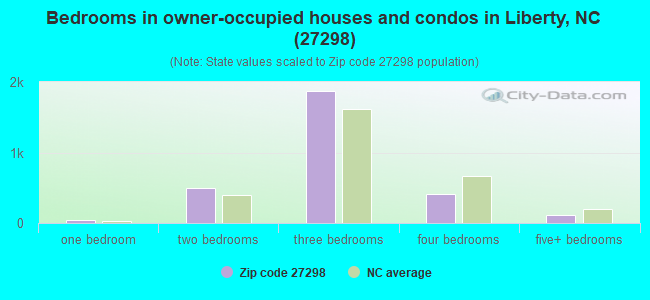

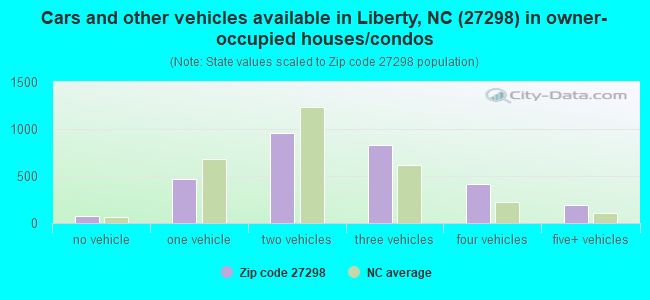
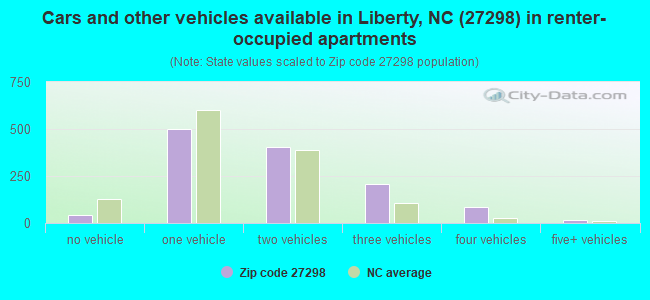


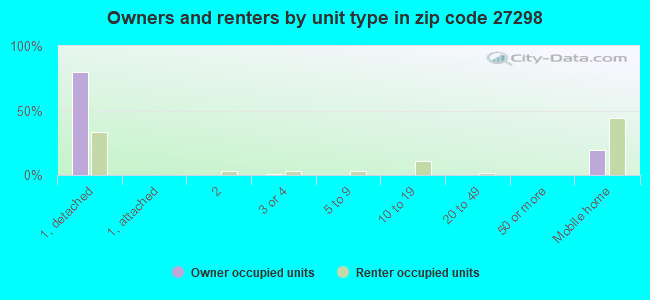
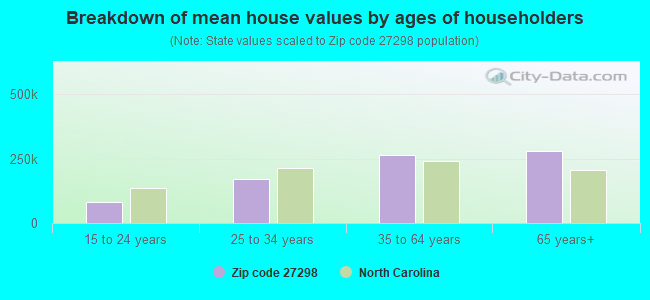


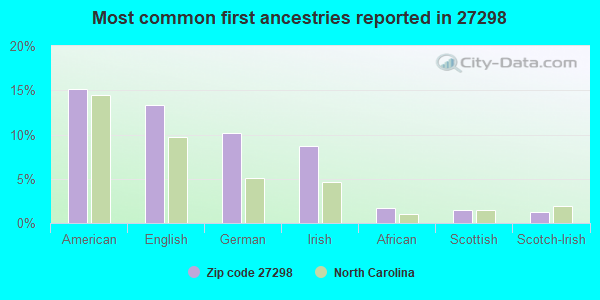
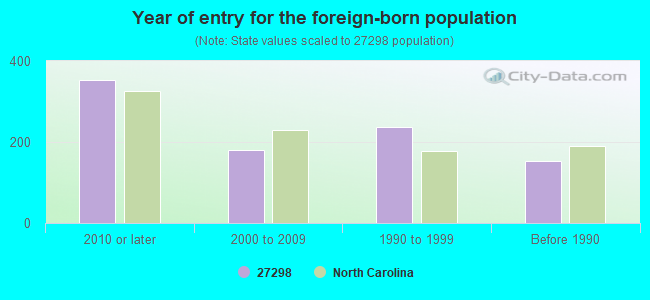


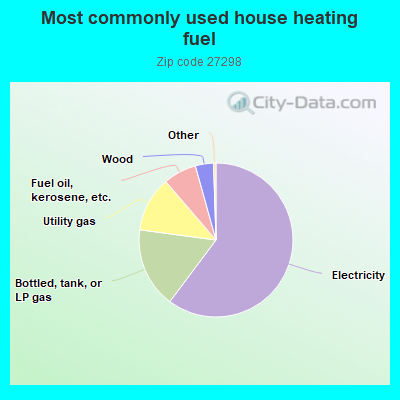
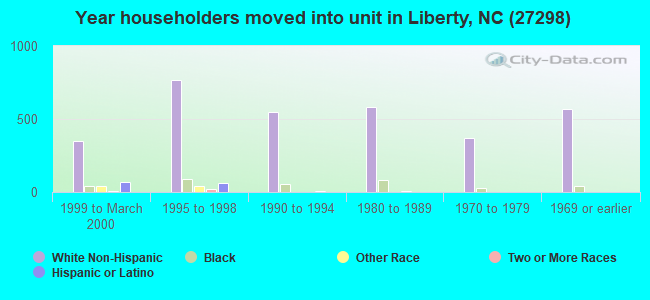
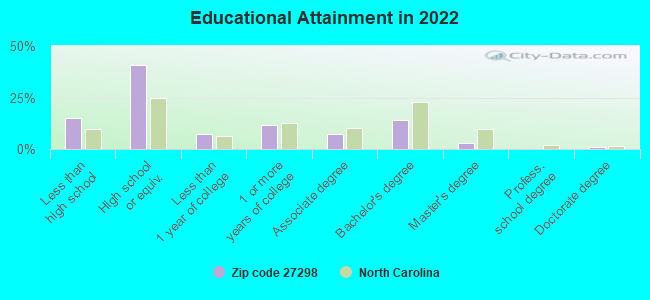
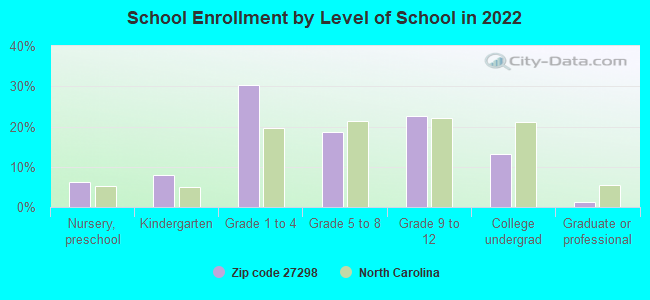
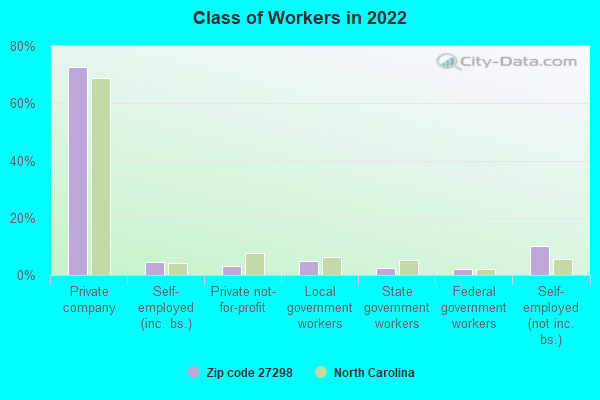
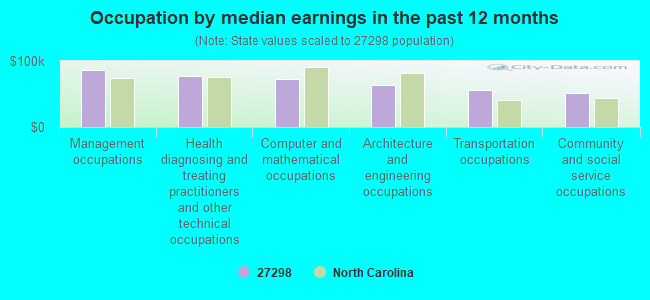
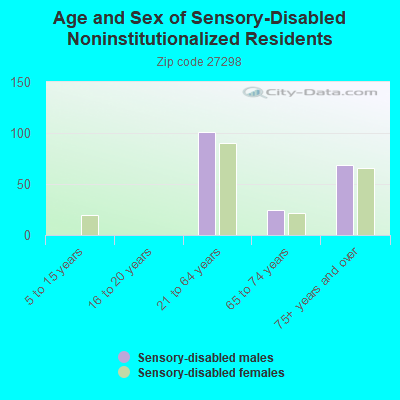
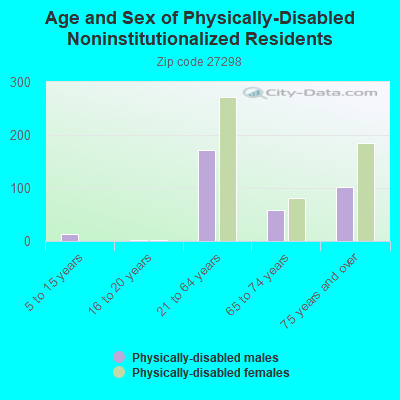
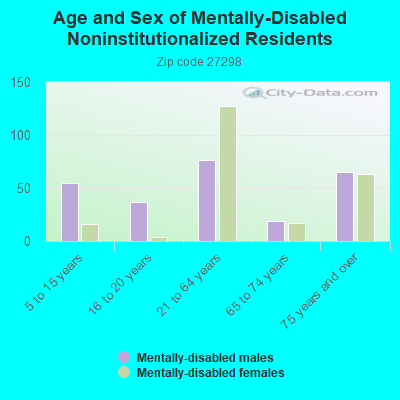
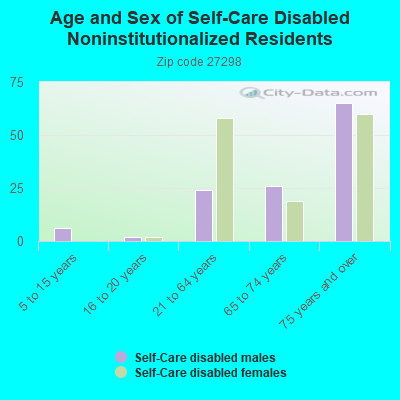
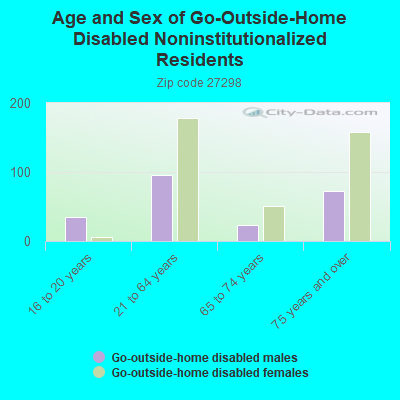
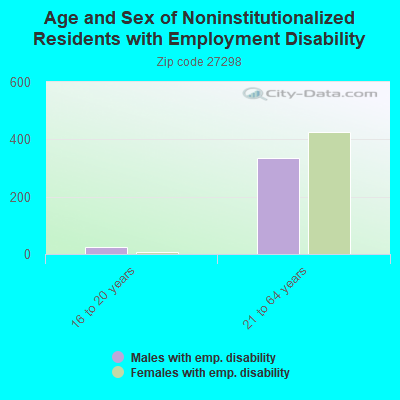
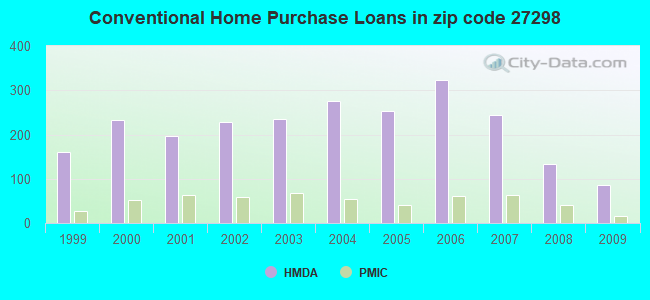
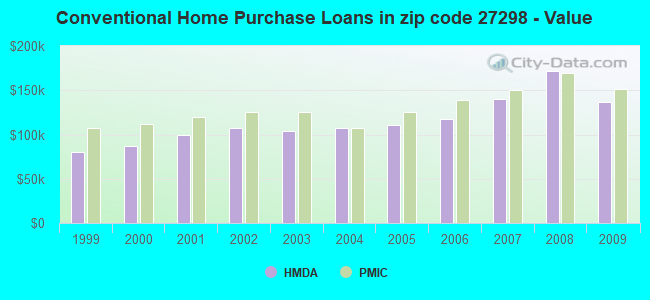
 Based on the data from the years 2002 - 2018 the average number of fire incidents per year is 37. The highest number of reported fire incidents - 68 took place in 2017, and the least - 11 in 2012. The data has an increasing trend.
 When looking into fire subcategories, the most incidents belonged to: Structure Fires (45.2%), and Outside Fires (39.2%).