Estimated zip code population in 2022: 1,139 Zip code population in 2010: 1,662 Zip code population in 2000: 1,942
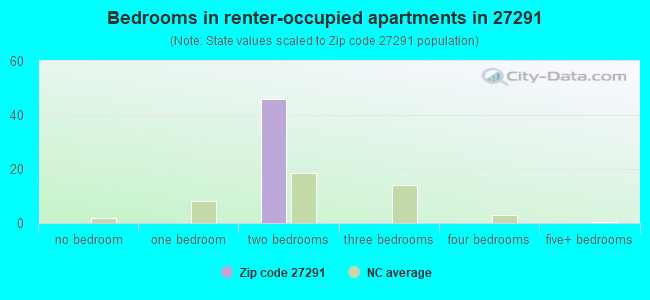
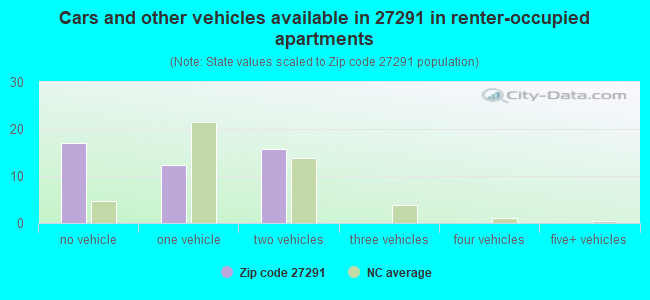
Houses and condos: 755 Renter-occupied apartments: 46
% of renters here:
8%
State:
33%
March 2022 cost of living index in zip code 27291: 78.5 (low, U.S. average is 100)
Land area: 50.7 sq. mi. Water area: 1.7 sq. mi.
Population density: 22 people per square mile
(very low).
OSM Map
General Map
Google Map
MSN Map
OSM Map
General Map
Google Map
MSN Map
OSM Map
General Map
Google Map
MSN Map
OSM Map
General Map
Google Map
MSN Map
Please wait while loading the map...
Real estate property taxes paid for housing units in 2022:
This zip code:
0.5% ($1,017)
North Carolina:
0.6% ($1,769)
Median real estate property taxes paid for housing units with mortgages in 2022: $849 (0.5%) Median real estate property taxes paid for housing units with no mortgage in 2022: $1,411 (0.5%)
Business Search- 14 Million verified businesses
Males: 546
(47.9%)
Females: 593
(52.1%)
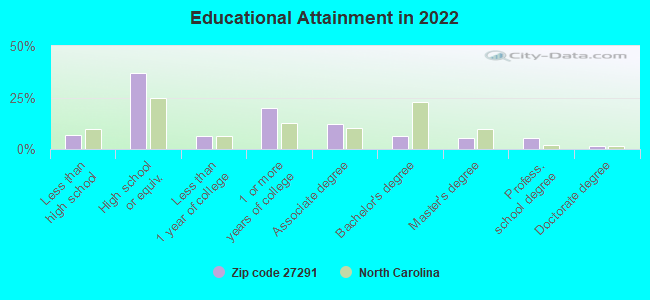
For population 25 years and over in 27291:
High school or higher: 91.0%
Bachelor's degree or higher: 17.9%
Graduate or professional degree: 11.9%
Unemployed: 4.3%
Mean travel time to work (commute): 36.6 minutes
For population 15 years and over in 27291:
Never married: 12.4%
Now married: 70.7%
Separated: 0.0%
Widowed: 4.5%
Divorced: 12.4%
Zip code 27291 compared to state average:
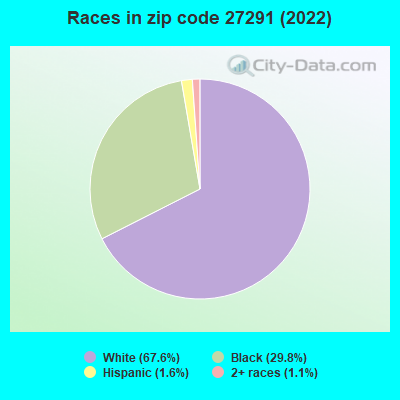
Hispanic race population percentage significantly below state average.
Median age significantly above state average.
Foreign-born population percentage significantly below state average.
Renting percentage significantly below state average.
Number of college students significantly below state average.
Percentage of population with a bachelor's degree or higher below state average.
Estimated median house/condo value in 2022: $208,688
27291:
$208,688
North Carolina:
$280,600
According to our research of North Carolina and other state lists, there were 6 registered sex offenders living in 27291 zip code as of May 28, 2024. The ratio of all residents to sex offenders in zip code 27291 is 258 to 1.
Median resident age:
This zip code:
55.8 years
North Carolina median age:
39.2 years
Average household size:
This zip code:
2.1 people
North Carolina:
2.4 people
Averages for the 2020 tax year for zip code 27291, filed in 2021:
Average Adjusted Gross Income (AGI) in 2020: $53,117 (Individual Income Tax Returns)
Here:
$53,117
State:
$70,020
Salary/wage: $48,979 (reported on 76.8% of returns)
Here:
$48,979
State:
$58,387
(% of AGI for various income ranges: 973.3% for AGIs below $25k, 3033.8% for AGIs $25k-50k, 7281.4% for AGIs $50k-75k, 9943.3% for AGIs $75k-100k, 28182.5% for AGIs $100k-200k)
Taxable interest for individuals: $757 (reported on 30.4% of returns)
This zip code:
$757
North Carolina:
$1,479
(% of AGI for various income ranges: 11.7% for AGIs below $25k, 13.8% for AGIs $25k-50k, 14.3% for AGIs $50k-75k, 56.7% for AGIs $75k-100k, 222.5% for AGIs $100k-200k)
Ordinary dividends: $4,210 (reported on 14.5% of returns)
Here:
$4,210
State:
$7,888
(% of AGI for various income ranges: 25.6% for AGIs below $25k, 84.3% for AGIs $50k-75k, 790.0% for AGIs $100k-200k)
Net capital gain/loss in AGI: +$8,011 (reported on 13.0% of returns)
Here:
+$8,011
State:
+$23,652
(% of AGI for various income ranges: 20.6% for AGIs below $25k, 90.0% for AGIs $50k-75k, 1552.5% for AGIs $100k-200k)
Profit/loss from business: +$7,800 (reported on 13.0% of returns)
Here:
+$7,800
State:
+$11,710
(% of AGI for various income ranges: 118.9% for AGIs below $25k, 121.2% for AGIs $25k-50k, 420.0% for AGIs $50k-75k)
Taxable individual retirement arrangement distribution: $16,029 (reported on 10.1% of returns)
27291:
$16,029
North Carolina:
$20,247
(% of AGI for various income ranges: 373.1% for AGIs $25k-50k, 1750.0% for AGIs $75k-100k)
Total itemized deductions: $27,675 (reported on 5.8% of returns)
Here:
$27,675
State:
$34,549
(% of AGI for various income ranges: 2767.5% for AGIs $100k-200k)
Charity contributions: $5,167 (reported on 4.3% of returns)
Here:
$5,167
State:
$13,360
(% of AGI for various income ranges: 387.5% for AGIs $100k-200k)
Taxes paid: $6,350 (reported on 5.8% of returns)
27291:
$6,350
State:
$7,586
(% of AGI for various income ranges: 635.0% for AGIs $100k-200k)
Earned income credit: $2,485 (reported on 18.8% of returns)
Here:
$2,485
State:
$2,337
(% of AGI for various income ranges: 112.8% for AGIs below $25k, 75.0% for AGIs $25k-50k)
Percentage of individuals using paid preparers for their 2020 taxes: 92.8%
Here:
93%
State:
93%
(% for various income ranges: 95.8% for AGIs below $25k, 89.5% for AGIs $25k-50k, 90.9% for AGIs $50k-75k, 100.0% for AGIs $75k-100k, 90.0% for AGIs $100k-200k)
Averages for the 2012 tax year for zip code 27291, filed in 2013:
Average Adjusted Gross Income (AGI) in 2012: $43,039 (Individual Income Tax Returns)
Here:
$43,039
State:
$54,937
Salary/wage: $38,078 (reported on 80.6% of returns)
Here:
$38,078
State:
$46,336
(% of AGI for various income ranges: 72.6% for AGIs below $25k, 76.8% for AGIs $25k-50k, 72.0% for AGIs $50k-75k, 77.6% for AGIs $75k-100k, 62.5% for AGIs $100k-200k)
Taxable interest for individuals: $1,009 (reported on 32.8% of returns)
This zip code:
$1,009
North Carolina:
$1,298
(% of AGI for various income ranges: 0.9% for AGIs below $25k, 0.9% for AGIs $25k-50k, 1.2% for AGIs $50k-75k, 0.2% for AGIs $75k-100k, 0.7% for AGIs $100k-200k)
Ordinary dividends: $1,936 (reported on 16.4% of returns)
Here:
$1,936
State:
$6,213
(% of AGI for various income ranges: 0.3% for AGIs below $25k, 0.5% for AGIs $25k-50k, 2.1% for AGIs $50k-75k, 0.7% for AGIs $100k-200k)
Net capital gain/loss in AGI: +$2,800 (reported on 9.0% of returns)
Here:
+$2,800
State:
+$12,740
(% of AGI for various income ranges: 1.0% for AGIs below $25k, 1.5% for AGIs $100k-200k)
Profit/loss from business: +$7,900 (reported on 10.4% of returns)
Here:
+$7,900
State:
+$10,311
Taxable individual retirement arrangement distribution: $10,975 (reported on 11.9% of returns)
27291:
$10,975
North Carolina:
$15,575
(% of AGI for various income ranges: 3.8% for AGIs below $25k, 2.6% for AGIs $25k-50k, 10.9% for AGIs $50k-75k)
Total itemized deductions: $20,789 (25% of AGI, reported on 26.9% of returns)
Here:
$20,789
State:
$23,438
Here:
25.4% of AGI
State:
21.5% of AGI
(% of AGI for various income ranges: 14.4% for AGIs $25k-50k, 10.9% for AGIs $50k-75k, 13.1% for AGIs $75k-100k, 18.3% for AGIs $100k-200k)
Charity contributions: $3,738 (reported on 23.9% of returns)
Here:
$3,738
State:
$4,687
(% of AGI for various income ranges: 1.7% for AGIs $25k-50k, 1.9% for AGIs $50k-75k, 2.3% for AGIs $75k-100k, 3.2% for AGIs $100k-200k)
Taxes paid: $6,278 (reported on 26.9% of returns)
27291:
$6,278
State:
$8,823
(% of AGI for various income ranges: 2.9% for AGIs $25k-50k, 3.0% for AGIs $50k-75k, 4.3% for AGIs $75k-100k, 6.6% for AGIs $100k-200k)
Earned income credit: $2,457 (reported on 20.9% of returns)
Here:
$2,457
State:
$2,376
(% of AGI for various income ranges: 7.8% for AGIs below $25k, 1.2% for AGIs $25k-50k)
Percentage of individuals using paid preparers for their 2012 taxes: 58.2%
Here:
58%
State:
53%
(% for various income ranges: 55.6% for AGIs below $25k, 52.6% for AGIs $25k-50k, 66.7% for AGIs $50k-75k, 66.7% for AGIs $75k-100k, 66.7% for AGIs $100k-200k)
Averages for the 2004 tax year for zip code 27291, filed in 2005:
Average Adjusted Gross Income (AGI) in 2004: $39,317 (Individual Income Tax Returns)
Here:
$39,317
State:
$45,376
Salary/wage: $34,946 (reported on 84.7% of returns)
Here:
$34,946
State:
$39,442
(% of AGI for various income ranges: 112.3% for AGIs below $10k, 77.6% for AGIs $10k-25k, 79.8% for AGIs $25k-50k, 81.5% for AGIs $50k-75k, 86.0% for AGIs $75k-100k, 52.6% for AGIs over 100k)
Taxable interest for individuals: $966 (reported on 40.2% of returns)
This zip code:
$966
North Carolina:
$1,515
(% of AGI for various income ranges: 5.2% for AGIs below $10k, 1.5% for AGIs $10k-25k, 0.8% for AGIs $25k-50k, 0.4% for AGIs $50k-75k, 0.3% for AGIs $75k-100k, 1.6% for AGIs over 100k)
Taxable dividends: $1,070 (reported on 17.4% of returns)
Here:
$1,070
State:
$4,016
(% of AGI for various income ranges: 0.6% for AGIs below $10k, 0.5% for AGIs $10k-25k, 0.3% for AGIs $25k-50k, 0.3% for AGIs $50k-75k, 0.5% for AGIs $75k-100k, 0.7% for AGIs over 100k)
Net capital gain/loss: +$3,472 (reported on 10.9% of returns)
Here:
+$3,472
State:
+$11,152
(% of AGI for various income ranges: 0.1% for AGIs $10k-25k, -0.1% for AGIs $25k-50k, -0.3% for AGIs $75k-100k, 4.6% for AGIs over 100k)
Profit/loss from business: +$5,882 (reported on 11.5% of returns)
Here:
+$5,882
State:
+$9,490
(% of AGI for various income ranges: -1.1% for AGIs below $10k, 2.6% for AGIs $10k-25k, 4.9% for AGIs $25k-50k, 1.1% for AGIs $75k-100k)
Total itemized deductions: $15,903 (22% of AGI, reported on 32.7% of returns)
Here:
$15,903
State:
$19,464
Here:
22.5% of AGI
State:
22.7% of AGI
(% of AGI for various income ranges: 12.0% for AGIs $10k-25k, 10.0% for AGIs $25k-50k, 16.6% for AGIs $50k-75k, 17.9% for AGIs $75k-100k, 12.1% for AGIs over 100k)
Charity contributions deductions: $2,968 (4% of AGI, reported on 28.8% of returns)
Here:
$2,968
State:
$4,035
Here:
4.1% of AGI
State:
4.5% of AGI
(% of AGI for various income ranges: 1.4% for AGIs $10k-25k, 1.7% for AGIs $25k-50k, 3.1% for AGIs $50k-75k, 2.8% for AGIs $75k-100k, 2.0% for AGIs over 100k)
Total tax: $4,647 (reported on 74.7% of returns)
27291:
$4,647
State:
$7,257
(% of AGI for various income ranges: 3.2% for AGIs below $10k, 3.6% for AGIs $10k-25k, 7.1% for AGIs $25k-50k, 7.7% for AGIs $50k-75k, 9.4% for AGIs $75k-100k, 14.8% for AGIs over 100k)
Earned income credit: $1,685 (reported on 18.8% of returns)
Here:
$1,685
State:
$1,851
Percentage of individuals using paid preparers for their 2004 taxes: 66.4%
Here:
66%
State:
62%
(% for various income ranges: 61.6% for AGIs below $10k, 69.1% for AGIs $10k-25k, 66.3% for AGIs $25k-50k, 67.4% for AGIs $50k-75k, 66.0% for AGIs $75k-100k, 67.7% for AGIs over 100k)
Household received Food Stamps/SNAP in the past 12 months: 20 Household did not receive Food Stamps/SNAP in the past 12 months: 523
Women who did not have a birth in the past 12 months: 183 (79 now married, 104 unmarried)
Housing units in zip code 27291 with a mortgage: 368 (23 second mortgage, 24 both second mortgage and home equity loan) Median monthly owner costs for units with a mortgage: $1,139 Median monthly owner costs for units without a mortgage: $511
Residents with income below the poverty level in 2022:
This zip code:
2.8%
Whole state:
12.8%
Residents with income below 50% of the poverty level in 2022:
This zip code:
2.8%
Whole state:
6.8%
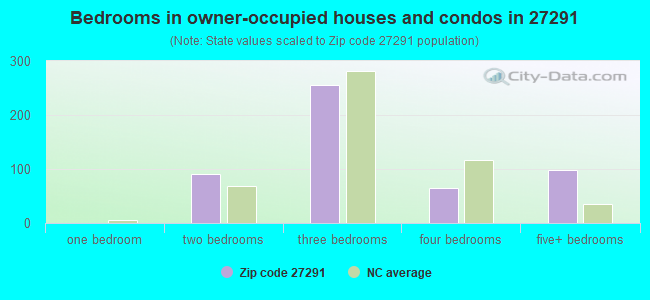
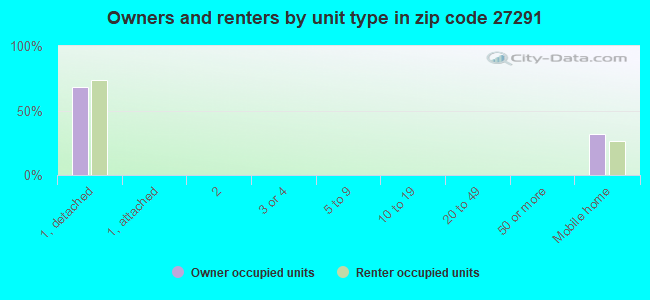
Median number of rooms in houses and condos:
Here:
6.7
State:
6.4
Median number of rooms in apartments:
Here:
6.2
State:
4.4
Notable locations in this zip code not listed on our city pages
Churches in zip code 27291 include: Griers Church (A), Allens Chapel (B), Union Church (C), Beulah Church (D), New Hope Church (E), Olive Grove Church (F), Olive Hill Church (G), Ebenezer Primitive Baptist Church (H), Saint James Church (I). Display/hide their locations on the map
In group quarters: 3 (-1 institutionalized population)
Size of family households: 188 2-persons, 120 3-persons, 16 4-persons, 65 5-persons
Size of nonfamily households: 124 1-person, 35 2-persons
148 married couples with children.
0 single-parent households ().
100.2% of residents of 27291 zip code speak English at home.
Foreign born population: 17 (1.5%) (100.0% of them are naturalized citizens)
This zip code:
1.5%
Whole state:
8.6%
112%Grenada
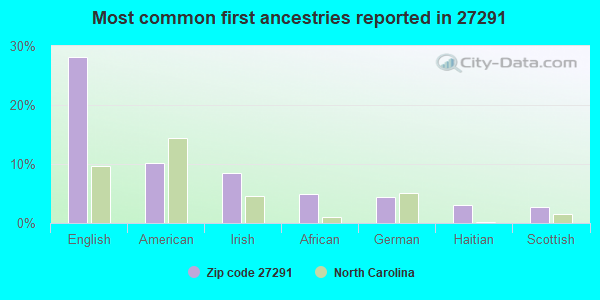
28%English
10%American
9%Irish
5%African
4%German
3%Haitian
3%Scottish
Year of entry for the foreign-born population
02010 or later
02000 to 2009
01990 to 1999
41Before 1990
Facilities with environmental interests located in this zip code:
BURGIO, JOSEPH T. - RESIDENCE (669 KELLY BREWER ROAD in LEASBURG, NC)
STATE MASTER (North Carolina facility info) - -115DA4YG00M69W84AY3W055V9H, WASTEWATER FACILITY National Pollutant Discharge Elimination System NON-MAJOR (Tracking pollutant discharge elimination systems) - permit Business SIC classification: SEWERAGE SYSTEMS
Housing units lacking complete plumbing facilities: 4.6% Housing units lacking complete kitchen facilities: 9.1%
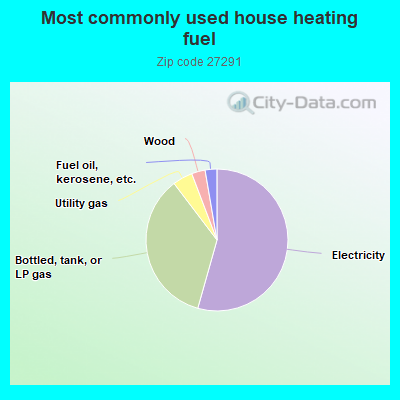
54.7%Electricity
35.5%Bottled, tank, or LP gas
4.6%Utility gas
3.1%Wood
2.7%Fuel oil, kerosene, etc.
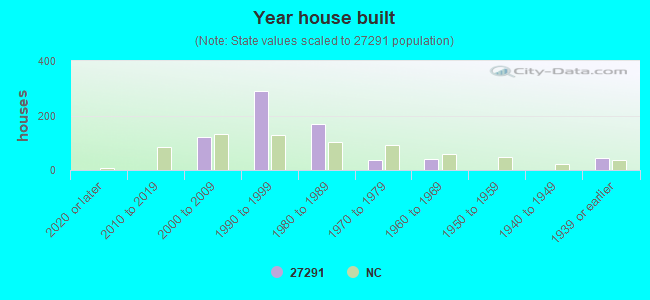
Population in 1990: 2,700.
Place of birth for U.S.-born residents:
This state: 763
Northeast: 89
Midwest: 56
South: 178
66% of the 27291 zip code residents lived in the same house 5 years ago. Out of people who lived in different houses, 43% lived in this county. Out of people who lived in different counties, 50% lived in North Carolina.
94% of the 27291 zip code residents lived in the same house 1 year ago. Out of people who lived in different houses, 61% moved from this county. Out of people who lived in different houses, 37% moved from different county within same state.
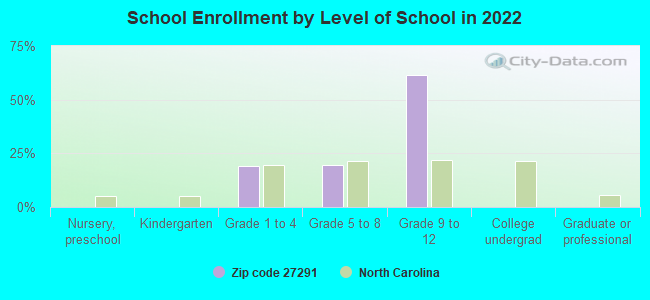
Private vs. public school enrollment:
Students in private schools in grades 1 to 8 (elementary and middle school): 55
Here:
100.0%
North Carolina:
13.8%
Students in private schools in grades 9 to 12 (high school):
Here:
0.0%
North Carolina:
11.9%
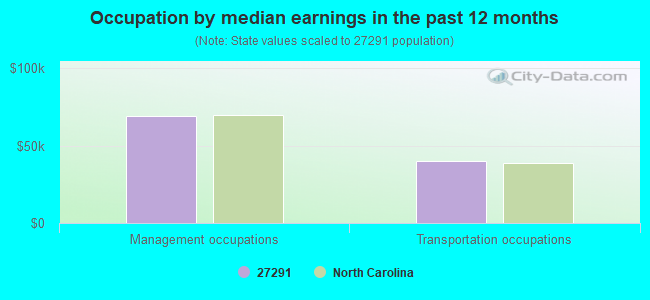
Occupation by median earnings in the past 12 months ($)
68,993Management occupations
39,816Transportation occupations
Top industries in this zip code by the number of employees in 2005:
Health Care and Social Assistance: Residential Mental Retardation Facilities (5-9: 1, 1-4: 2)
Administrative and Support and Waste Management and Remediation Services: Landscaping Services (1-4: 3)
Construction: Drywall and Insulation Contractors (1-4: 2)
Other Services (except Public Administration): Commercial and Industrial Machinery and Equipment (except Automotive and Electronic) Repair and Maintenance (1-4: 2)
Construction: Plumbing, Heating, and Air-Conditioning Contractors (1-4: 1)
Health Care and Social Assistance: Offices of Chiropractors (1-4: 1)
Construction: Flooring Contractors (1-4: 1)
Construction: New Single-Family Housing Construction (except Operative Builders) (1-4: 1)
People in group quarters in 2010:
4 people in group homes intended for adults
2 people in workers' group living quarters and job corps centers
People in group quarters in 2000:
2 people in other group homes
Fatal accident statistics in 2012:
Fatal accident count: 2
Vehicles involved in fatal accidents: 4
Fatal accidents caused by drunken drivers: 1
Fatalities: 2
Persons involved in fatal accidents: 8
Pedestrians involved in fatal accidents: 0
Home Mortgage Disclosure Act Aggregated Statistics For Year 2009 (Based on 2 partial tracts)
A) FHA, FSA/RHS & VA Home Purchase Loans
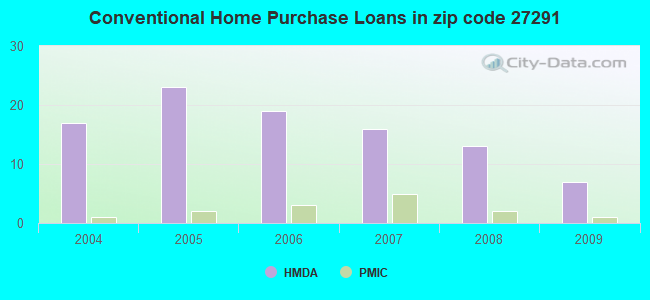
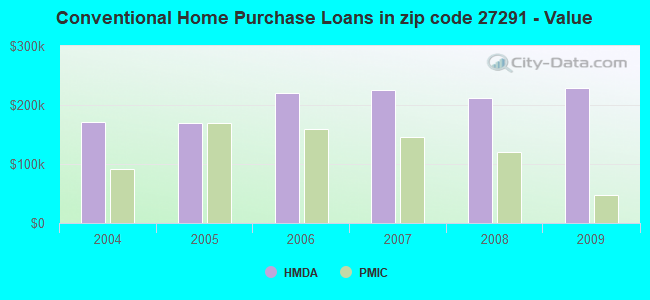
B) Conventional Home Purchase Loans
C) Refinancings
D) Home Improvement Loans
F) Non-occupant Loans on < 5 Family Dwellings (A B C & D)
G) Loans On Manufactured Home Dwelling (A B C & D)
Number
Average Value
Number
Average Value
Number
Average Value
Number
Average Value
Number
Average Value
Number
Average Value
LOANS ORIGINATED
3
$132,200
7
$229,201
45
$198,136
2
$157,535
14
$287,549
5
$79,834
APPLICATIONS APPROVED, NOT ACCEPTED
0
$0
0
$0
2
$127,955
0
$0
0
$0
1
$90,530
APPLICATIONS DENIED
1
$181,580
2
$259,260
18
$186,070
2
$11,315
3
$338,817
3
$58,900
APPLICATIONS WITHDRAWN
1
$85,900
2
$180,425
6
$175,110
0
$0
2
$208,720
1
$128,340
FILES CLOSED FOR INCOMPLETENESS
1
$70,470
0
$0
1
$292,440
0
$0
1
$174,900
0
$0
Aggregated Statistics For Year 2008 (Based on 2 partial tracts)
A) FHA, FSA/RHS & VA Home Purchase Loans
B) Conventional Home Purchase Loans
C) Refinancings
D) Home Improvement Loans
F) Non-occupant Loans on < 5 Family Dwellings (A B C & D)
G) Loans On Manufactured Home Dwelling (A B C & D)
Number
Average Value
Number
Average Value
Number
Average Value
Number
Average Value
Number
Average Value
Number
Average Value
LOANS ORIGINATED
5
$123,044
13
$212,507
35
$206,076
2
$160,365
14
$280,385
8
$82,144
APPLICATIONS APPROVED, NOT ACCEPTED
0
$0
1
$47,320
4
$155,478
1
$23,920
1
$23,150
1
$84,360
APPLICATIONS DENIED
0
$0
2
$66,230
18
$158,721
3
$57,527
2
$365,225
7
$84,141
APPLICATIONS WITHDRAWN
0
$0
3
$141,803
9
$128,971
1
$63,530
2
$173,355
3
$96,537
FILES CLOSED FOR INCOMPLETENESS
0
$0
0
$0
1
$277,000
0
$0
0
$0
0
$0
Aggregated Statistics For Year 2007 (Based on 2 partial tracts)
A) FHA, FSA/RHS & VA Home Purchase Loans
B) Conventional Home Purchase Loans
C) Refinancings
D) Home Improvement Loans
F) Non-occupant Loans on < 5 Family Dwellings (A B C & D)
G) Loans On Manufactured Home Dwelling (A B C & D)
Number
Average Value
Number
Average Value
Number
Average Value
Number
Average Value
Number
Average Value
Number
Average Value
LOANS ORIGINATED
3
$100,907
16
$225,291
29
$162,524
4
$66,422
13
$264,243
7
$87,080
APPLICATIONS APPROVED, NOT ACCEPTED
0
$0
2
$161,005
5
$132,406
0
$0
1
$190,840
1
$88,480
APPLICATIONS DENIED
0
$0
3
$156,720
26
$118,134
4
$51,182
2
$204,860
7
$90,681
APPLICATIONS WITHDRAWN
0
$0
3
$144,290
12
$147,612
1
$38,580
1
$287,810
2
$82,045
FILES CLOSED FOR INCOMPLETENESS
0
$0
1
$228,910
3
$187,327
0
$0
1
$118,570
0
$0
Aggregated Statistics For Year 2006 (Based on 2 partial tracts)
A) FHA, FSA/RHS & VA Home Purchase Loans
B) Conventional Home Purchase Loans
C) Refinancings
D) Home Improvement Loans
F) Non-occupant Loans on < 5 Family Dwellings (A B C & D)
G) Loans On Manufactured Home Dwelling (A B C & D)
Number
Average Value
Number
Average Value
Number
Average Value
Number
Average Value
Number
Average Value
Number
Average Value
LOANS ORIGINATED
3
$115,227
19
$219,581
35
$147,662
4
$43,018
14
$243,458
6
$93,578
APPLICATIONS APPROVED, NOT ACCEPTED
0
$0
3
$370,197
6
$119,812
1
$38,840
2
$127,055
1
$87,450
APPLICATIONS DENIED
1
$38,070
6
$100,093
22
$112,221
3
$22,890
2
$173,610
9
$77,131
APPLICATIONS WITHDRAWN
0
$0
3
$306,667
8
$141,942
1
$46,300
2
$206,915
1
$80,250
FILES CLOSED FOR INCOMPLETENESS
0
$0
0
$0
3
$131,600
0
$0
0
$0
0
$0
Aggregated Statistics For Year 2005 (Based on 2 partial tracts)
A) FHA, FSA/RHS & VA Home Purchase Loans
B) Conventional Home Purchase Loans
C) Refinancings
D) Home Improvement Loans
F) Non-occupant Loans on < 5 Family Dwellings (A B C & D)
G) Loans On Manufactured Home Dwelling (A B C & D)
Number
Average Value
Number
Average Value
Number
Average Value
Number
Average Value
Number
Average Value
Number
Average Value
LOANS ORIGINATED
2
$117,410
23
$169,551
37
$129,163
4
$114,968
15
$215,791
10
$70,679
APPLICATIONS APPROVED, NOT ACCEPTED
0
$0
3
$117,540
7
$106,701
2
$20,190
1
$100,570
1
$32,660
APPLICATIONS DENIED
1
$62,240
7
$134,736
26
$105,719
6
$31,378
3
$79,473
13
$81,493
APPLICATIONS WITHDRAWN
0
$0
3
$132,373
12
$103,994
2
$170,265
1
$104,680
3
$80,333
FILES CLOSED FOR INCOMPLETENESS
0
$0
0
$0
2
$140,175
0
$0
0
$0
0
$0
Aggregated Statistics For Year 2004 (Based on 2 partial tracts)
A) FHA, FSA/RHS & VA Home Purchase Loans
B) Conventional Home Purchase Loans
C) Refinancings
D) Home Improvement Loans
F) Non-occupant Loans on < 5 Family Dwellings (A B C & D)
G) Loans On Manufactured Home Dwelling (A B C & D)

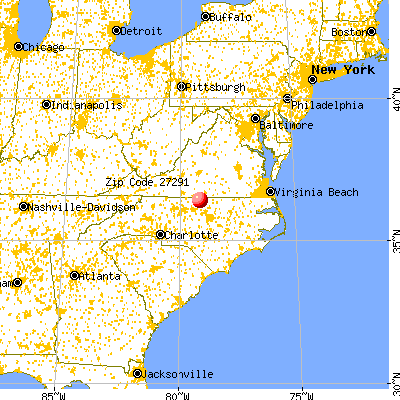


 Nearest zip codes: 27314, 27343, 27305, 27212, 27379, 27541.