Estimated zip code population in 2022: 1,542 Zip code population in 2010: 1,716 Zip code population in 2000: 1,576
Houses and condos: 1,178 Renter-occupied apartments: 68
% of renters here:
12%
State:
33%
March 2022 cost of living index in zip code 27343: 84.6 (less than average, U.S. average is 100)
Land area: 45.9 sq. mi. Water area: 5.6 sq. mi.
Population density: 34 people per square mile
(very low).
OSM Map
General Map
Google Map
MSN Map
OSM Map
General Map
Google Map
MSN Map
OSM Map
General Map
Google Map
MSN Map
OSM Map
General Map
Google Map
MSN Map
Please wait while loading the map...
Real estate property taxes paid for housing units in 2022:
This zip code:
0.7% ($1,967)
North Carolina:
0.6% ($1,769)
Median real estate property taxes paid for housing units with mortgages in 2022: $2,133 Median real estate property taxes paid for housing units with no mortgage in 2022: $1,540
Business Search- 14 Million verified businesses
Males: 808
(52.4%)
Females: 734
(47.6%)
For population 25 years and over in 27343:
High school or higher: 91.3%
Bachelor's degree or higher: 16.2%
Graduate or professional degree: 1.4%
Unemployed: 4.9%
Mean travel time to work (commute): 28.1 minutes
For population 15 years and over in 27343:
Never married: 28.4%
Now married: 53.7%
Separated: 0.0%
Widowed: 5.9%
Divorced: 12.0%
Zip code 27343 compared to state average:
Median age above state average.
Foreign-born population percentage significantly below state average.
Renting percentage significantly below state average.
Length of stay since moving in significantly above state average.
Percentage of population with a bachelor's degree or higher significantly below state average.
Estimated median house/condo value in 2022: $271,044
27343:
$271,044
North Carolina:
$280,600
According to our research of North Carolina and other state lists, there were 7 registered sex offenders living in 27343 zip code as of May 28, 2024. The ratio of all residents to sex offenders in zip code 27343 is 282 to 1.
Median resident age:
This zip code:
46.3 years
North Carolina median age:
39.2 years
Average household size:
This zip code:
2.6 people
North Carolina:
2.4 people
Averages for the 2020 tax year for zip code 27343, filed in 2021:
Average Adjusted Gross Income (AGI) in 2020: $75,038 (Individual Income Tax Returns)
Here:
$75,038
State:
$70,020
Salary/wage: $65,897 (reported on 77.2% of returns)
Here:
$65,897
State:
$58,387
(% of AGI for various income ranges: 1162.3% for AGIs below $25k, 3715.0% for AGIs $25k-50k, 6861.7% for AGIs $50k-75k, 12740.0% for AGIs $75k-100k, 12005.0% for AGIs $100k-200k)
Taxable interest for individuals: $888 (reported on 32.9% of returns)
This zip code:
$888
North Carolina:
$1,479
(% of AGI for various income ranges: 5.9% for AGIs below $25k, 23.3% for AGIs $25k-50k, 63.3% for AGIs $50k-75k, 76.7% for AGIs $75k-100k, 81.2% for AGIs $100k-200k)
Ordinary dividends: $9,306 (reported on 20.3% of returns)
Here:
$9,306
State:
$7,888
(% of AGI for various income ranges: 25.5% for AGIs below $25k, 105.0% for AGIs $50k-75k, 173.3% for AGIs $75k-100k, 677.5% for AGIs $100k-200k)
Net capital gain/loss in AGI: +$26,247 (reported on 19.0% of returns)
Here:
+$26,247
State:
+$23,652
(% of AGI for various income ranges: 23.6% for AGIs below $25k, 380.0% for AGIs $50k-75k, 398.8% for AGIs $100k-200k)
Profit/loss from business: +$8,992 (reported on 16.5% of returns)
Here:
+$8,992
State:
+$11,710
(% of AGI for various income ranges: 119.5% for AGIs below $25k, 140.8% for AGIs $25k-50k, 308.3% for AGIs $50k-75k, 690.0% for AGIs $100k-200k)
Taxable individual retirement arrangement distribution: $25,240 (reported on 12.7% of returns)
27343:
$25,240
North Carolina:
$20,247
(% of AGI for various income ranges: 105.0% for AGIs below $25k, 903.3% for AGIs $50k-75k, 2188.8% for AGIs $100k-200k)
Total itemized deductions: $29,120 (reported on 12.7% of returns)
Here:
$29,120
State:
$34,549
(% of AGI for various income ranges: 1518.3% for AGIs $50k-75k, 928.8% for AGIs $100k-200k)
Charity contributions: $6,367 (reported on 11.4% of returns)
Here:
$6,367
State:
$13,360
(% of AGI for various income ranges: 107.5% for AGIs $25k-50k, 187.5% for AGIs $100k-200k)
Taxes paid: $7,070 (reported on 12.7% of returns)
27343:
$7,070
State:
$7,586
(% of AGI for various income ranges: 298.3% for AGIs $50k-75k, 310.0% for AGIs $100k-200k)
Earned income credit: $2,269 (reported on 16.5% of returns)
Here:
$2,269
State:
$2,337
(% of AGI for various income ranges: 107.7% for AGIs below $25k, 48.3% for AGIs $25k-50k)
Percentage of individuals using paid preparers for their 2020 taxes: 92.4%
Here:
92%
State:
93%
(% for various income ranges: 93.3% for AGIs below $25k, 93.8% for AGIs $25k-50k, 90.0% for AGIs $50k-75k, 85.7% for AGIs $75k-100k, 91.7% for AGIs $100k-200k, 100.0% for AGIs over 200k)
Averages for the 2012 tax year for zip code 27343, filed in 2013:
Average Adjusted Gross Income (AGI) in 2012: $46,554 (Individual Income Tax Returns)
Here:
$46,554
State:
$54,937
Salary/wage: $37,875 (reported on 85.7% of returns)
Here:
$37,875
State:
$46,336
(% of AGI for various income ranges: 74.1% for AGIs below $25k, 79.8% for AGIs $25k-50k, 76.5% for AGIs $50k-75k, 76.8% for AGIs $75k-100k, 54.7% for AGIs $100k-200k)
Taxable interest for individuals: $832 (reported on 31.4% of returns)
This zip code:
$832
North Carolina:
$1,298
(% of AGI for various income ranges: 0.3% for AGIs below $25k, 0.3% for AGIs $25k-50k, 0.6% for AGIs $50k-75k, 0.4% for AGIs $75k-100k, 0.9% for AGIs $100k-200k)
Ordinary dividends: $4,973 (reported on 15.7% of returns)
Here:
$4,973
State:
$6,213
(% of AGI for various income ranges: 0.6% for AGIs $25k-50k, 1.6% for AGIs $50k-75k, 3.7% for AGIs $100k-200k)
Net capital gain/loss in AGI: +$4,122 (reported on 12.9% of returns)
Here:
+$4,122
State:
+$12,740
(% of AGI for various income ranges: 0.7% for AGIs below $25k, 3.3% for AGIs $100k-200k)
Profit/loss from business: +$6,520 (reported on 14.3% of returns)
Here:
+$6,520
State:
+$10,311
(% of AGI for various income ranges: 8.5% for AGIs below $25k, 2.5% for AGIs $50k-75k, 3.8% for AGIs $75k-100k)
Taxable individual retirement arrangement distribution: $13,067 (reported on 8.6% of returns)
27343:
$13,067
North Carolina:
$15,575
Total itemized deductions: $20,162 (26% of AGI, reported on 34.3% of returns)
Here:
$20,162
State:
$23,438
Here:
25.9% of AGI
State:
21.5% of AGI
(% of AGI for various income ranges: 11.4% for AGIs below $25k, 14.2% for AGIs $25k-50k, 15.4% for AGIs $50k-75k, 13.5% for AGIs $75k-100k, 16.6% for AGIs $100k-200k)
Charity contributions: $3,535 (reported on 28.6% of returns)
Here:
$3,535
State:
$4,687
(% of AGI for various income ranges: 1.1% for AGIs below $25k, 2.3% for AGIs $25k-50k, 2.4% for AGIs $50k-75k, 2.0% for AGIs $75k-100k, 2.4% for AGIs $100k-200k)
Taxes paid: $6,088 (reported on 34.3% of returns)
27343:
$6,088
State:
$8,823
(% of AGI for various income ranges: 1.2% for AGIs below $25k, 2.8% for AGIs $25k-50k, 4.2% for AGIs $50k-75k, 5.2% for AGIs $75k-100k, 6.5% for AGIs $100k-200k)
Earned income credit: $2,094 (reported on 25.7% of returns)
Here:
$2,094
State:
$2,376
(% of AGI for various income ranges: 8.0% for AGIs below $25k, 1.3% for AGIs $25k-50k)
Percentage of individuals using paid preparers for their 2012 taxes: 64.3%
Here:
64%
State:
53%
(% for various income ranges: 57.1% for AGIs below $25k, 68.4% for AGIs $25k-50k, 63.6% for AGIs $50k-75k, 80.0% for AGIs $75k-100k, 71.4% for AGIs $100k-200k)
Averages for the 2004 tax year for zip code 27343, filed in 2005:
Average Adjusted Gross Income (AGI) in 2004: $40,327 (Individual Income Tax Returns)
Here:
$40,327
State:
$45,376
Salary/wage: $36,090 (reported on 88.0% of returns)
Here:
$36,090
State:
$39,442
(% of AGI for various income ranges: 133.6% for AGIs below $10k, 84.3% for AGIs $10k-25k, 89.3% for AGIs $25k-50k, 84.3% for AGIs $50k-75k, 79.7% for AGIs $75k-100k, 57.2% for AGIs over 100k)
Taxable interest for individuals: $899 (reported on 37.8% of returns)
This zip code:
$899
North Carolina:
$1,515
(% of AGI for various income ranges: 1.7% for AGIs below $10k, 0.9% for AGIs $10k-25k, 0.6% for AGIs $25k-50k, 1.1% for AGIs $50k-75k, 0.6% for AGIs $75k-100k, 0.8% for AGIs over 100k)
Taxable dividends: $2,740 (reported on 17.8% of returns)
Here:
$2,740
State:
$4,016
(% of AGI for various income ranges: 1.9% for AGIs below $10k, 0.3% for AGIs $10k-25k, 0.4% for AGIs $25k-50k, 1.0% for AGIs $50k-75k, 0.9% for AGIs $75k-100k, 2.7% for AGIs over 100k)
Net capital gain/loss: +$6,419 (reported on 12.6% of returns)
Here:
+$6,419
State:
+$11,152
(% of AGI for various income ranges: -1.5% for AGIs below $10k, -0.3% for AGIs $10k-25k, -0.1% for AGIs $25k-50k, -0.3% for AGIs $50k-75k, 1.4% for AGIs $75k-100k, 7.7% for AGIs over 100k)
Profit/loss from business: +$1,957 (reported on 12.6% of returns)
Here:
+$1,957
State:
+$9,490
(% of AGI for various income ranges: 17.7% for AGIs below $10k, 4.8% for AGIs $10k-25k, -0.9% for AGIs $25k-50k, -0.3% for AGIs $50k-75k, 0.7% for AGIs $75k-100k)
Total itemized deductions: $17,512 (25% of AGI, reported on 34.5% of returns)
Here:
$17,512
State:
$19,464
Here:
24.6% of AGI
State:
22.7% of AGI
(% of AGI for various income ranges: 12.3% for AGIs $10k-25k, 12.1% for AGIs $25k-50k, 16.0% for AGIs $50k-75k, 17.8% for AGIs $75k-100k, 17.2% for AGIs over 100k)
Charity contributions deductions: $2,461 (3% of AGI, reported on 31.0% of returns)
Here:
$2,461
State:
$4,035
Here:
3.4% of AGI
State:
4.5% of AGI
(% of AGI for various income ranges: 1.2% for AGIs $10k-25k, 1.7% for AGIs $25k-50k, 2.3% for AGIs $50k-75k, 2.4% for AGIs $75k-100k, 1.9% for AGIs over 100k)
Total tax: $5,541 (reported on 70.4% of returns)
27343:
$5,541
State:
$7,257
(% of AGI for various income ranges: 3.5% for AGIs below $10k, 3.3% for AGIs $10k-25k, 6.5% for AGIs $25k-50k, 8.3% for AGIs $50k-75k, 11.0% for AGIs $75k-100k, 16.2% for AGIs over 100k)
Earned income credit: $1,609 (reported on 23.0% of returns)
Here:
$1,609
State:
$1,851
Percentage of individuals using paid preparers for their 2004 taxes: 71.2%
Here:
71%
State:
62%
(% for various income ranges: 65.8% for AGIs below $10k, 73.4% for AGIs $10k-25k, 73.2% for AGIs $25k-50k, 70.8% for AGIs $50k-75k, 71.2% for AGIs $75k-100k, 72.3% for AGIs over 100k)
Household received Food Stamps/SNAP in the past 12 months: 109 Household did not receive Food Stamps/SNAP in the past 12 months: 467
Women who did not have a birth in the past 12 months: 258 (138 now married, 121 unmarried)
Housing units in zip code 27343 with a mortgage: 166 (58 second mortgage, 61 both second mortgage and home equity loan) Median monthly owner costs for units with a mortgage: $1,395 Median monthly owner costs for units without a mortgage: $434
Residents with income below the poverty level in 2022:
This zip code:
19.6%
Whole state:
12.8%
Residents with income below 50% of the poverty level in 2022:
This zip code:
17.3%
Whole state:
6.8%
Median number of rooms in houses and condos:
Here:
6.3
State:
6.4
Median number of rooms in apartments:
Here:
6.9
State:
4.4
Notable locations in this zip code not listed on our city pages
Churches in zip code 27343 include: Lebanon Church (A), New Ephesus Church (B), Chestnut Grove Baptist Church (C), Zion Level Baptist Church (D), Ephesus Church (E). Display/hide their locations on the map
Cemeteries: Zion Level Baptist Church Cemetery (1), Ephesus Cemetery (2), Cunningham Cemetery (3), Chestnut Grove Baptist Church Cemetery (4). Display/hide their locations on the map
Streams, rivers, and creeks: Cobbs Creek (A), Cane Creek (B), Sargents Creek (C), Reedy Fork (D), Hyco Creek (E), Ghent Creek (F). Display/hide their locations on the map
In group quarters: 33 (-1 institutionalized population)
Size of family households: 179 2-persons, 67 3-persons, 31 4-persons, 41 6-persons, 44 7-or-more-persons
Size of nonfamily households: 206 1-person, 7 2-persons
236 married couples with children.
0 single-parent households ().
93.7% of residents of 27343 zip code speak English at home.
6.1% of residents speak Spanish at home (60% very well, 30% well, 10% not well).
Foreign born population: 33 (2.2%) (32.9% of them are naturalized citizens)
This zip code:
2.2%
Whole state:
8.6%
61%Honduras
42%Romania
10%Scottish
7%Croatian
5%English
4%Polish
4%American
3%European
3%Italian
Year of entry for the foreign-born population
02010 or later
92000 to 2009
91990 to 1999
12Before 1990
Facilities with environmental interests located in this zip code:
DONNA GRAY (454 RAINEY RIDGE ROAD in SEMORA, NC)
STATE MASTER (North Carolina facility info) - -115DA4YG00TT9W64FBEM83RRS9, WASTEWATER FACILITY National Pollutant Discharge Elimination System NON-MAJOR (Tracking pollutant discharge elimination systems) - permit Business SIC classification: SEWERAGE SYSTEMS
AUGUSTA FIBERGLASS COATINGS (3276 MCGHEE'S MILL RD in SEMORA, NC)
Small Quantity Generators, between 100 kg and 1000 kg of hazardous waste/month (Resource Conservation and Recovery Act (tracking hazardous waste)) Organizations: BOBBY GRAY (CONTACT/OWNER)
CHANDLER CONCRETE COMPANY, INC. - PROGR (1700 DUNNAWAY ROAD in SEMORA, NC)
AIR MINOR (AIRS/AFS) Business SIC classification: READY-MIXED CONCRETE
CLAUDE FITCH- RESIDENCE (LOT 3B FAWNS CROSSING RD in SEMORA, NC)
National Pollutant Discharge Elimination System NON-MAJOR (Tracking pollutant discharge elimination systems) - permit Business SIC classification: SEWERAGE SYSTEMS
DODSON MICHAEL & WELDON CYNTHI (533 SHORE ACRES RD in SEMORA, NC)
National Pollutant Discharge Elimination System NON-MAJOR (Tracking pollutant discharge elimination systems) - permit
AUGUSTA FIBERGLASS COATINGS, INC. ** IN (3276 MCGHEE MILL RD in SEMORA, NC)
AIR MAJOR (AIRS/AFS) Business SIC classification: SPECIAL TRADE CONTRACTORS
Housing units lacking complete plumbing facilities: 11.5% Housing units lacking complete kitchen facilities: 6.9%
59.0%Electricity
26.4%Bottled, tank, or LP gas
8.6%Utility gas
4.8%Wood
1.6%No fuel used
Population in 1990: 1,214. Population change in the 1990s: +362 (+29.8%).
Place of birth for U.S.-born residents:
This state: 803
Northeast: 88
South: 545
West: 67
68% of the 27343 zip code residents lived in the same house 5 years ago. Out of people who lived in different houses, 52% lived in this county. Out of people who lived in different counties, 50% lived in North Carolina.
91% of the 27343 zip code residents lived in the same house 1 year ago. Out of people who lived in different houses, 61% moved from this county. Out of people who lived in different houses, 24% moved from different county within same state. Out of people who lived in different houses, 11% moved from different state.
Private vs. public school enrollment:
Students in private schools in grades 1 to 8 (elementary and middle school): 41
Here:
39.1%
North Carolina:
13.8%
Students in private schools in grades 9 to 12 (high school): 22
Here:
23.4%
North Carolina:
11.9%
Students in private undergraduate colleges:
Here:
0.0%
North Carolina:
19.3%
Occupation by median earnings in the past 12 months ($)
92,923Construction and extraction occupations
70,252Health technologists and technicians
48,801Sales and related occupations
39,134Production occupations
Top industries in this zip code by the number of employees in 2005:
Construction: Industrial Building Construction (5-9 employees: 1 establishment)
Health Care and Social Assistance: Homes for the Elderly (5-9: 1)
Other Services (except Public Administration): Religious Organizations (5-9: 1)
Real Estate and Rental and Leasing: Offices of Real Estate Agents and Brokers (1-4: 2)
Professional, Scientific, and Technical Services: Computer Systems Design Services (1-4: 1)
Construction: Masonry Contractors (1-4: 1)
Accommodation and Food Services: Full-Service Restaurants (1-4: 1)
Construction: Residential Remodelers (1-4: 1)
People in group quarters in 2010:
6 people in group homes intended for adults
3 people in nursing facilities/skilled-nursing facilities
People in group quarters in 2000:
4 people in other noninstitutional group quarters
Fatal accident statistics in 2014:
Fatal accident count: 1
Vehicles involved in fatal accidents: 2
Fatal accidents caused by drunken drivers: 0
Fatalities: 1
Persons involved in fatal accidents: 1
Pedestrians involved in fatal accidents: 0
Home Mortgage Disclosure Act Aggregated Statistics For Year 2009 (Based on 2 partial tracts)
A) FHA, FSA/RHS & VA Home Purchase Loans
B) Conventional Home Purchase Loans
C) Refinancings
D) Home Improvement Loans
F) Non-occupant Loans on < 5 Family Dwellings (A B C & D)
G) Loans On Manufactured Home Dwelling (A B C & D)
Number
Average Value
Number
Average Value
Number
Average Value
Number
Average Value
Number
Average Value
Number
Average Value
LOANS ORIGINATED
6
$124,233
14
$215,389
85
$197,148
4
$148,042
27
$280,229
10
$75,024
APPLICATIONS APPROVED, NOT ACCEPTED
0
$0
0
$0
3
$160,327
0
$0
0
$0
2
$85,080
APPLICATIONS DENIED
2
$170,640
4
$243,632
33
$190,752
3
$14,180
6
$318,400
5
$66,420
APPLICATIONS WITHDRAWN
1
$161,460
3
$226,070
12
$164,558
0
$0
4
$196,140
2
$120,610
FILES CLOSED FOR INCOMPLETENESS
1
$132,450
0
$0
2
$274,815
0
$0
1
$328,710
0
$0
Aggregated Statistics For Year 2008 (Based on 2 partial tracts)
A) FHA, FSA/RHS & VA Home Purchase Loans
B) Conventional Home Purchase Loans
C) Refinancings
D) Home Improvement Loans
F) Non-occupant Loans on < 5 Family Dwellings (A B C & D)
G) Loans On Manufactured Home Dwelling (A B C & D)
Number
Average Value
Number
Average Value
Number
Average Value
Number
Average Value
Number
Average Value
Number
Average Value
LOANS ORIGINATED
9
$128,477
24
$216,342
66
$205,394
4
$150,700
27
$273,246
15
$82,339
APPLICATIONS APPROVED, NOT ACCEPTED
0
$0
1
$88,950
7
$166,980
1
$44,960
1
$43,510
1
$158,560
APPLICATIONS DENIED
0
$0
3
$82,983
34
$157,930
6
$54,060
3
$457,620
13
$85,153
APPLICATIONS WITHDRAWN
0
$0
5
$159,908
17
$128,328
1
$119,400
3
$217,207
6
$90,718
FILES CLOSED FOR INCOMPLETENESS
0
$0
0
$0
2
$260,310
0
$0
0
$0
0
$0
Aggregated Statistics For Year 2007 (Based on 2 partial tracts)
A) FHA, FSA/RHS & VA Home Purchase Loans
B) Conventional Home Purchase Loans
C) Refinancings
D) Home Improvement Loans
F) Non-occupant Loans on < 5 Family Dwellings (A B C & D)
G) Loans On Manufactured Home Dwelling (A B C & D)
Number
Average Value
Number
Average Value
Number
Average Value
Number
Average Value
Number
Average Value
Number
Average Value
LOANS ORIGINATED
6
$94,827
31
$218,544
55
$161,060
7
$71,336
24
$269,012
14
$81,833
APPLICATIONS APPROVED, NOT ACCEPTED
0
$0
4
$151,305
9
$138,252
0
$0
2
$179,340
2
$83,145
APPLICATIONS DENIED
0
$0
6
$147,277
49
$117,811
8
$48,099
4
$192,515
14
$85,216
APPLICATIONS WITHDRAWN
0
$0
6
$135,593
23
$144,747
1
$72,510
2
$270,460
4
$77,102
FILES CLOSED FOR INCOMPLETENESS
0
$0
1
$430,230
5
$211,246
0
$0
1
$222,850
0
$0
Aggregated Statistics For Year 2006 (Based on 2 partial tracts)
A) FHA, FSA/RHS & VA Home Purchase Loans
B) Conventional Home Purchase Loans
C) Refinancings
D) Home Improvement Loans
F) Non-occupant Loans on < 5 Family Dwellings (A B C & D)
G) Loans On Manufactured Home Dwelling (A B C & D)
Number
Average Value
Number
Average Value
Number
Average Value
Number
Average Value
Number
Average Value
Number
Average Value
LOANS ORIGINATED
5
$129,938
35
$224,035
65
$149,438
8
$40,424
27
$237,260
12
$87,938
APPLICATIONS APPROVED, NOT ACCEPTED
0
$0
5
$417,464
11
$122,827
2
$36,495
4
$119,400
2
$82,180
APPLICATIONS DENIED
1
$71,540
11
$102,613
42
$110,480
5
$25,814
4
$163,148
16
$81,544
APPLICATIONS WITHDRAWN
0
$0
6
$288,187
16
$133,388
1
$87,010
4
$194,448
1
$150,820
FILES CLOSED FOR INCOMPLETENESS
0
$0
0
$0
5
$148,404
0
$0
0
$0
0
$0
Aggregated Statistics For Year 2005 (Based on 2 partial tracts)
A) FHA, FSA/RHS & VA Home Purchase Loans
B) Conventional Home Purchase Loans
C) Refinancings
D) Home Improvement Loans
F) Non-occupant Loans on < 5 Family Dwellings (A B C & D)
G) Loans On Manufactured Home Dwelling (A B C & D)
Number
Average Value
Number
Average Value
Number
Average Value
Number
Average Value
Number
Average Value
Number
Average Value
LOANS ORIGINATED
4
$110,335
44
$166,575
69
$130,175
8
$108,040
28
$217,271
18
$73,799
APPLICATIONS APPROVED, NOT ACCEPTED
0
$0
5
$132,548
13
$107,984
3
$25,297
1
$189,010
1
$61,390
APPLICATIONS DENIED
1
$116,980
13
$136,356
49
$105,431
11
$32,168
5
$89,622
25
$79,645
APPLICATIONS WITHDRAWN
0
$0
5
$149,274
22
$106,612
4
$160,005
1
$196,740
5
$90,590
FILES CLOSED FOR INCOMPLETENESS
0
$0
0
$0
4
$131,728
0
$0
0
$0
0
$0
Aggregated Statistics For Year 2004 (Based on 2 partial tracts)
A) FHA, FSA/RHS & VA Home Purchase Loans
B) Conventional Home Purchase Loans
C) Refinancings
D) Home Improvement Loans
F) Non-occupant Loans on < 5 Family Dwellings (A B C & D)
G) Loans On Manufactured Home Dwelling (A B C & D)
Detailed PMIC statistics for the following Tracts:9802.00
2003 - 2018 National Fire Incident Reporting System (NFIRS) incidents
According to the data from the years 2003 - 2018 the average number of fire incidents per year is 8. The highest number of reported fires - 23 took place in 2011, and the least - 0 in 2004. The data has a rising trend.
When looking into fire subcategories, the most incidents belonged to: Outside Fires (44.8%), and Structure Fires (30.4%).
Fire incident types reported to NFIRS in Zip Code 27343

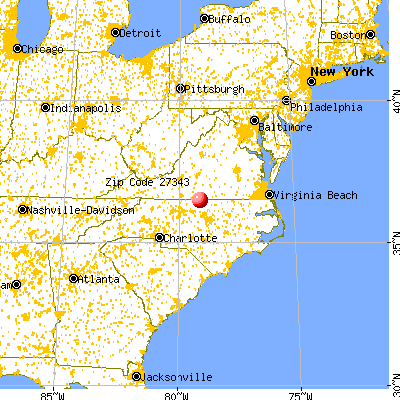


 Nearest zip codes: 24520, 27291, 27305, 27573, 24594, 27212.


 According to the data from the years 2003 - 2018 the average number of fire incidents per year is 8. The highest number of reported fires - 23 took place in 2011, and the least - 0 in 2004. The data has a rising trend.
 When looking into fire subcategories, the most incidents belonged to: Outside Fires (44.8%), and Structure Fires (30.4%).