Estimated zip code population in 2022: 6,271 Zip code population in 2010: 6,629 Zip code population in 2000: 5,686
Houses and condos: 2,552 Renter-occupied apartments: 582
% of renters here:
26%
State:
33%
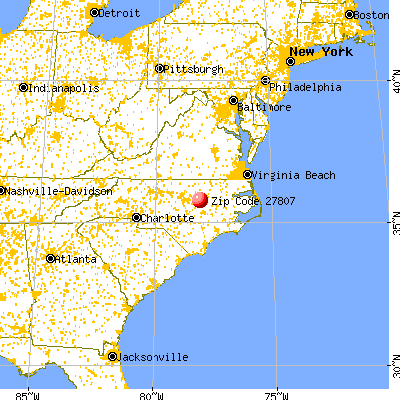
March 2022 cost of living index in zip code 27807: 79.7 (low, U.S. average is 100)
Land area: 50.0 sq. mi. Water area: 0.2 sq. mi.
Population density: 125 people per square mile
(very low).
OSM Map
General Map
Google Map
MSN Map
OSM Map
General Map
Google Map
MSN Map
OSM Map
General Map
Google Map
MSN Map
OSM Map
General Map
Google Map
MSN Map
Please wait while loading the map...
Real estate property taxes paid for housing units in 2022:
This zip code:
0.6% ($1,000)
North Carolina:
0.6% ($1,769)
Median real estate property taxes paid for housing units with mortgages in 2022: $1,298 (0.7%) Median real estate property taxes paid for housing units with no mortgage in 2022: $789 (0.7%)
Business Search- 14 Million verified businesses
Males: 3,122
(49.8%)
Females: 3,148
(50.2%)
For population 25 years and over in 27807:
High school or higher: 77.9%
Bachelor's degree or higher: 18.8%
Graduate or professional degree: 3.5%
Unemployed: 5.1%
Mean travel time to work (commute): 28.5 minutes
For population 15 years and over in 27807:
Never married: 24.5%
Now married: 58.3%
Separated: 2.8%
Widowed: 5.8%
Divorced: 8.5%
Zip code 27807 compared to state average:
Median house value below state average.
Hispanic race population percentage above state average.
Length of stay since moving in significantly above state average.
Percentage of population with a bachelor's degree or higher below state average.
Estimated median house/condo value in 2022: $164,131
27807:
$164,131
North Carolina:
$280,600
According to our research of North Carolina and other state lists, there were 13 registered sex offenders living in 27807 zip code as of May 28, 2024. The ratio of all residents to sex offenders in zip code 27807 is 528 to 1. The ratio of registered sex offenders to all residents in this zip code is near the state average.
Median resident age:
This zip code:
41.4 years
North Carolina median age:
39.2 years
Average household size:
This zip code:
2.8 people
North Carolina:
2.4 people
Averages for the 2020 tax year for zip code 27807, filed in 2021:
Average Adjusted Gross Income (AGI) in 2020: $48,768 (Individual Income Tax Returns)
Here:
$48,768
State:
$70,020
Salary/wage: $43,999 (reported on 85.1% of returns)
Here:
$43,999
State:
$58,387
(% of AGI for various income ranges: 1426.4% for AGIs below $25k, 3998.9% for AGIs $25k-50k, 7060.3% for AGIs $50k-75k, 10930.0% for AGIs $75k-100k, 15997.3% for AGIs $100k-200k)
Taxable interest for individuals: $991 (reported on 23.2% of returns)
This zip code:
$991
North Carolina:
$1,479
(% of AGI for various income ranges: 16.7% for AGIs below $25k, 12.8% for AGIs $25k-50k, 28.1% for AGIs $50k-75k, 22.0% for AGIs $75k-100k, 104.5% for AGIs $100k-200k)
Ordinary dividends: $3,017 (reported on 8.8% of returns)
Here:
$3,017
State:
$7,888
(% of AGI for various income ranges: 8.8% for AGIs below $25k, 16.2% for AGIs $25k-50k, 22.6% for AGIs $50k-75k, 74.7% for AGIs $75k-100k, 139.5% for AGIs $100k-200k)
Net capital gain/loss in AGI: +$4,812 (reported on 7.9% of returns)
Here:
+$4,812
State:
+$23,652
(% of AGI for various income ranges: 8.9% for AGIs below $25k, 13.5% for AGIs $25k-50k, 39.7% for AGIs $50k-75k, 28.0% for AGIs $75k-100k, 413.6% for AGIs $100k-200k)
Profit/loss from business: +$8,129 (reported on 14.9% of returns)
Here:
+$8,129
State:
+$11,710
(% of AGI for various income ranges: 135.3% for AGIs below $25k, 142.7% for AGIs $25k-50k, 168.7% for AGIs $50k-75k, 280.7% for AGIs $75k-100k, 378.6% for AGIs $100k-200k)
Taxable individual retirement arrangement distribution: $13,855 (reported on 6.1% of returns)
27807:
$13,855
North Carolina:
$20,247
(% of AGI for various income ranges: 38.7% for AGIs below $25k, 60.1% for AGIs $25k-50k, 228.1% for AGIs $50k-75k, 586.4% for AGIs $100k-200k)
Total itemized deductions: $29,369 (reported on 4.0% of returns)
Here:
$29,369
State:
$34,549
(% of AGI for various income ranges: 95.0% for AGIs $25k-50k, 469.0% for AGIs $50k-75k, 755.0% for AGIs $100k-200k)
Charity contributions: $9,033 (reported on 3.7% of returns)
Here:
$9,033
State:
$13,360
(% of AGI for various income ranges: 20.7% for AGIs $25k-50k, 90.3% for AGIs $50k-75k, 295.9% for AGIs $100k-200k)
Taxes paid: $5,777 (reported on 4.0% of returns)
27807:
$5,777
State:
$7,586
(% of AGI for various income ranges: 15.1% for AGIs $25k-50k, 69.0% for AGIs $50k-75k, 193.2% for AGIs $100k-200k)
Earned income credit: $2,391 (reported on 22.6% of returns)
Here:
$2,391
State:
$2,337
(% of AGI for various income ranges: 135.1% for AGIs below $25k, 83.9% for AGIs $25k-50k)
Percentage of individuals using paid preparers for their 2020 taxes: 92.1%
Here:
92%
State:
93%
(% for various income ranges: 91.1% for AGIs below $25k, 92.7% for AGIs $25k-50k, 91.1% for AGIs $50k-75k, 91.3% for AGIs $75k-100k, 94.3% for AGIs $100k-200k, 100.0% for AGIs over 200k)
Averages for the 2012 tax year for zip code 27807, filed in 2013:
Average Adjusted Gross Income (AGI) in 2012: $40,263 (Individual Income Tax Returns)
Here:
$40,263
State:
$54,937
Salary/wage: $34,888 (reported on 87.3% of returns)
Here:
$34,888
State:
$46,336
(% of AGI for various income ranges: 79.8% for AGIs below $25k, 83.1% for AGIs $25k-50k, 78.7% for AGIs $50k-75k, 84.3% for AGIs $75k-100k, 87.6% for AGIs $100k-200k)
Taxable interest for individuals: $1,074 (reported on 25.7% of returns)
This zip code:
$1,074
North Carolina:
$1,298
(% of AGI for various income ranges: 0.9% for AGIs below $25k, 0.5% for AGIs $25k-50k, 0.7% for AGIs $50k-75k, 0.4% for AGIs $75k-100k, 1.3% for AGIs $100k-200k)
Ordinary dividends: $1,184 (reported on 8.8% of returns)
Here:
$1,184
State:
$6,213
(% of AGI for various income ranges: 0.3% for AGIs below $25k, 0.2% for AGIs $25k-50k, 0.1% for AGIs $50k-75k, 0.1% for AGIs $75k-100k, 0.6% for AGIs $100k-200k)
Net capital gain/loss in AGI: +$3,436 (reported on 8.8% of returns)
Here:
+$3,436
State:
+$12,740
(% of AGI for various income ranges: 0.3% for AGIs below $25k, 0.3% for AGIs $25k-50k, 0.1% for AGIs $50k-75k, 0.7% for AGIs $75k-100k, 2.8% for AGIs $100k-200k)
Profit/loss from business: +$5,808 (reported on 13.4% of returns)
Here:
+$5,808
State:
+$10,311
(% of AGI for various income ranges: 5.9% for AGIs below $25k, 1.9% for AGIs $25k-50k, 1.0% for AGIs $50k-75k, 2.1% for AGIs $100k-200k)
Taxable individual retirement arrangement distribution: $10,100 (reported on 6.3% of returns)
27807:
$10,100
North Carolina:
$15,575
(% of AGI for various income ranges: 1.5% for AGIs below $25k, 1.6% for AGIs $25k-50k, 2.5% for AGIs $50k-75k, 2.9% for AGIs $100k-200k)
Total itemized deductions: $18,901 (23% of AGI, reported on 23.6% of returns)
Here:
$18,901
State:
$23,438
Here:
23.3% of AGI
State:
21.5% of AGI
(% of AGI for various income ranges: 6.4% for AGIs below $25k, 8.4% for AGIs $25k-50k, 12.7% for AGIs $50k-75k, 12.8% for AGIs $75k-100k, 15.8% for AGIs $100k-200k, 11.7% for AGIs over 200k)
Charity contributions: $4,125 (reported on 19.4% of returns)
Here:
$4,125
State:
$4,687
(% of AGI for various income ranges: 0.7% for AGIs below $25k, 1.4% for AGIs $25k-50k, 2.4% for AGIs $50k-75k, 2.6% for AGIs $75k-100k, 4.0% for AGIs $100k-200k)
Taxes paid: $5,767 (reported on 23.6% of returns)
27807:
$5,767
State:
$8,823
(% of AGI for various income ranges: 1.2% for AGIs below $25k, 1.8% for AGIs $25k-50k, 3.1% for AGIs $50k-75k, 4.4% for AGIs $75k-100k, 6.2% for AGIs $100k-200k, 5.2% for AGIs over 200k)
Earned income credit: $2,520 (reported on 26.4% of returns)
Here:
$2,520
State:
$2,376
(% of AGI for various income ranges: 8.3% for AGIs below $25k, 1.4% for AGIs $25k-50k)
Percentage of individuals using paid preparers for their 2012 taxes: 56.0%
Here:
56%
State:
53%
(% for various income ranges: 54.5% for AGIs below $25k, 54.3% for AGIs $25k-50k, 55.9% for AGIs $50k-75k, 55.0% for AGIs $75k-100k, 73.3% for AGIs $100k-200k, 100.0% for AGIs over 200k)
Averages for the 2004 tax year for zip code 27807, filed in 2005:
Average Adjusted Gross Income (AGI) in 2004: $34,180 (Individual Income Tax Returns)
Here:
$34,180
State:
$45,376
Salary/wage: $31,988 (reported on 87.9% of returns)
Here:
$31,988
State:
$39,442
(% of AGI for various income ranges: 116.5% for AGIs below $10k, 82.7% for AGIs $10k-25k, 85.4% for AGIs $25k-50k, 85.1% for AGIs $50k-75k, 82.3% for AGIs $75k-100k, 63.4% for AGIs over 100k)
Taxable interest for individuals: $1,186 (reported on 32.1% of returns)
This zip code:
$1,186
North Carolina:
$1,515
(% of AGI for various income ranges: 3.3% for AGIs below $10k, 1.5% for AGIs $10k-25k, 0.8% for AGIs $25k-50k, 0.9% for AGIs $50k-75k, 1.5% for AGIs $75k-100k, 0.9% for AGIs over 100k)
Taxable dividends: $911 (reported on 10.6% of returns)
Here:
$911
State:
$4,016
(% of AGI for various income ranges: 0.6% for AGIs below $10k, 0.1% for AGIs $10k-25k, 0.3% for AGIs $25k-50k, 0.3% for AGIs $50k-75k, 0.2% for AGIs $75k-100k, 0.6% for AGIs over 100k)
Net capital gain/loss: +$1,631 (reported on 7.8% of returns)
Here:
+$1,631
State:
+$11,152
(% of AGI for various income ranges: -0.4% for AGIs below $10k, 0.1% for AGIs $10k-25k, 0.1% for AGIs $25k-50k, 0.4% for AGIs $50k-75k, 1.1% for AGIs $75k-100k, 0.6% for AGIs over 100k)
Profit/loss from business: +$6,924 (reported on 14.4% of returns)
Here:
+$6,924
State:
+$9,490
(% of AGI for various income ranges: 6.5% for AGIs below $10k, 3.9% for AGIs $10k-25k, 3.4% for AGIs $25k-50k, 2.8% for AGIs $50k-75k, 1.3% for AGIs $75k-100k, 2.2% for AGIs over 100k)
IRA payment deduction: $3,109 (reported on 2.2% of returns)
27807:
$3,109
North Carolina:
$2,967
Total itemized deductions: $15,986 (26% of AGI, reported on 27.7% of returns)
Here:
$15,986
State:
$19,464
Here:
25.9% of AGI
State:
22.7% of AGI
(% of AGI for various income ranges: 8.3% for AGIs below $10k, 6.4% for AGIs $10k-25k, 11.5% for AGIs $25k-50k, 17.2% for AGIs $50k-75k, 14.7% for AGIs $75k-100k, 14.6% for AGIs over 100k)
Charity contributions deductions: $3,154 (5% of AGI, reported on 24.7% of returns)
Here:
$3,154
State:
$4,035
Here:
5.0% of AGI
State:
4.5% of AGI
(% of AGI for various income ranges: 0.5% for AGIs below $10k, 0.8% for AGIs $10k-25k, 2.1% for AGIs $25k-50k, 3.2% for AGIs $50k-75k, 2.7% for AGIs $75k-100k, 2.4% for AGIs over 100k)
Total tax: $4,193 (reported on 66.8% of returns)
27807:
$4,193
State:
$7,257
(% of AGI for various income ranges: 2.4% for AGIs below $10k, 3.2% for AGIs $10k-25k, 6.0% for AGIs $25k-50k, 8.3% for AGIs $50k-75k, 10.6% for AGIs $75k-100k, 17.1% for AGIs over 100k)
Earned income credit: $1,869 (reported on 25.2% of returns)
Here:
$1,869
State:
$1,851
Percentage of individuals using paid preparers for their 2004 taxes: 66.1%
Here:
66%
State:
62%
(% for various income ranges: 59.8% for AGIs below $10k, 70.5% for AGIs $10k-25k, 64.9% for AGIs $25k-50k, 66.5% for AGIs $50k-75k, 62.5% for AGIs $75k-100k, 76.3% for AGIs over 100k)
Household received Food Stamps/SNAP in the past 12 months: 297 Household did not receive Food Stamps/SNAP in the past 12 months: 1,970
Women who had a birth in the past 12 months: 62 (64 now married, 0 unmarried) Women who did not have a birth in the past 12 months: 1,391 (640 now married, 751 unmarried)
Housing units in zip code 27807 with a mortgage: 869 (76 second mortgage, 30 home equity loan, 26 both second mortgage and home equity loan) Houses without a mortgage: 53
Median monthly owner costs for units with a mortgage: $1,200 Median monthly owner costs for units without a mortgage: $356
Residents with income below the poverty level in 2022:
This zip code:
17.4%
Whole state:
12.8%
Residents with income below 50% of the poverty level in 2022:
This zip code:
12.5%
Whole state:
6.8%
Median number of rooms in houses and condos:
Here:
6.0
State:
6.4
Median number of rooms in apartments:
Here:
5.0
State:
4.4
Notable locations in this zip code not listed on our city pages
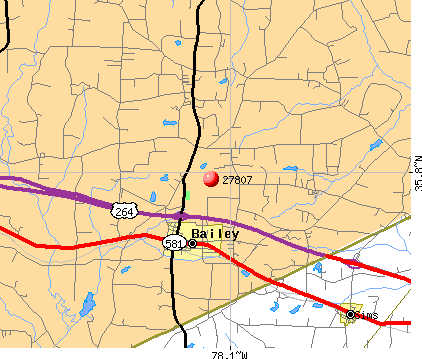
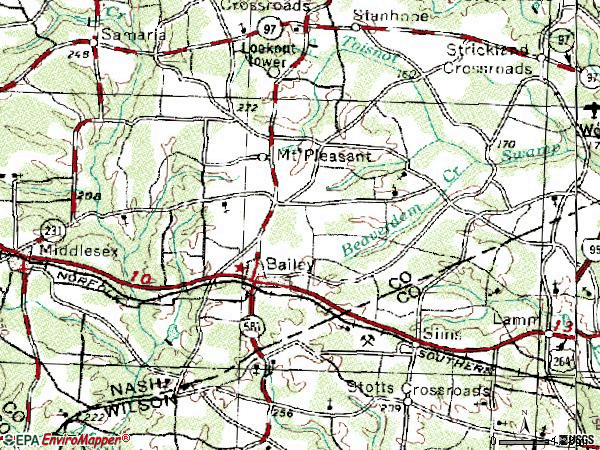
Notable locations in zip code 27807: Camp Charles (A), Perry Crossroads (B), Taylors Crossroads (C), Underwoods Mill (D). Display/hide their locations on the map
Churches in zip code 27807 include: Union View Church (A), Mitchells Chapel (B), Whiteoak Hill Church (C), New Sandy Hill Church (D), Pleasant Grove Church (E), Redoak Church (F), Sandy Level Church (G), Mount Pleasant Methodist Church (H), Rock Springs Church (I). Display/hide their locations on the map
In group quarters: 11 (-1 institutionalized population)
Size of family households: 688 2-persons, 260 3-persons, 324 4-persons, 158 5-persons, 79 6-persons, 60 7-or-more-persons
Size of nonfamily households: 619 1-person, 56 2-persons, 18 3-persons
1,047 married couples with children.
132 single-parent households (65 men, 67 women).
76.7% of residents of 27807 zip code speak English at home.
22.6% of residents speak Spanish at home (68% very well, 12% well, 9% not well, 12% not at all).
0.3% of residents speak other Indo-European language at home (100% well).
0.4% of residents speak Asian or Pacific Island language at home (62% very well, 38% well).
Foreign born population: 665 (10.6%) (33.9% of them are naturalized citizens)
This zip code:
10.6%
Whole state:
8.6%
73%Honduras
6%Guatemala
4%Serbia
4%Guyana
1%Bhutan
1%Uruguay
1%El Salvador
23%English
19%American
3%German
1%Irish
1%British
1%Scottish
1%Scotch-Irish
Year of entry for the foreign-born population
1362010 or later
2692000 to 2009
2401990 to 1999
118Before 1990
Facilities with environmental interests located in this zip code:
BAILEY ELEMENTARY SCHOOL (6288 PINE STREET in BAILEY, NC)
(Geographic Names Information System) STATE MASTER (North Carolina facility info) - UNDERGROUND STORAGE TANK PROGRAM (National Center for Education Statistics) - STATE ID-304 Business SIC classification: NONCLASSIFIABLE ESTABLISHMENTS Organizations: NASH-ROCKY MOUNT SCHOOLS (SCHOOL DISTRICT)
C HAWK BOATS INCORPORATED (8957 PACE RD. in BAILEY, NC)
AIR MAJOR (AIRS/AFS) STATE MASTER (North Carolina facility info) - -115DA4YG00M69W84AY3XG2JERN, WASTEWATER FACILITY, -2603, AIR PROGRAM CRITERIA AND HAZARDOUS AIR POLLUTANT INVENTORY (Inventory of air pollution sources) National Pollutant Discharge Elimination System NON-MAJOR (Tracking pollutant discharge elimination systems) - permit Small Quantity Generators, between 100 kg and 1000 kg of hazardous waste/month (Resource Conservation and Recovery Act (tracking hazardous waste)) - notification TRI REPORTER (Tracking of toxic chemicals releasing facilities) Business SIC classification: BOAT BUILDING AND REPAIRING Business NAICS classification: ALL OTHER MISCELLANEOUS MANUFACTURING.; ALL OTHER MISCELLANEOUS MANUFACTURING. Organizations: J MARSHALL BROCK (CONTACT/OWNER)
Alternative names: CUSTOM BOATWORKS INC
BAILEY FEED MILL INC (6421 DEANS STREET in BAILEY, NC)
AIR MINOR (AIRS/AFS) STATE MASTER (North Carolina facility info) - AIR PROGRAM CRITERIA AND HAZARDOUS AIR POLLUTANT INVENTORY (Inventory of air pollution sources) Business SIC classification: PREPARED FEEDS AND FEED INGREDIENTS FOR ANIMALS AND FOWLS, EXCEPT DOGS AND CATS Business NAICS classification: ALL OTHER MISCELLANEOUS MANUFACTURING.; ALL OTHER MISCELLANEOUS MANUFACTURING.
BAILEY WELL #2 WTP (O'NEAL ST in BAILEY, NC)
National Pollutant Discharge Elimination System NON-MAJOR (Tracking pollutant discharge elimination systems) - permit Business SIC classification: WATER SUPPLY Alternative names: BAILEY, TOWN - WELL # 2
1ST ONE INC PAINT & BODY SHOP (7939 STOTT RD in BAILEY, NC)
Conditionally Exempt Small Quantity Generators, less than 100 kg/month of hazardous waste (Resource Conservation and Recovery Act (tracking hazardous waste)) - notification Organizations: DANNY BROWN (CONTACT/OWNER)
Housing units lacking complete plumbing facilities: 1.1% Housing units lacking complete kitchen facilities: 1.1%
76.5%Electricity
20.6%Bottled, tank, or LP gas
2.0%Utility gas
Population in 1990: 4,399. Population change in the 1990s: +1,287 (+29.3%).
Place of birth for U.S.-born residents:
This state: 4,262
Northeast: 344
Midwest: 77
South: 696
West: 47
59% of the 27807 zip code residents lived in the same house 5 years ago. Out of people who lived in different houses, 52% lived in this county. Out of people who lived in different counties, 50% lived in North Carolina.
95% of the 27807 zip code residents lived in the same house 1 year ago. Out of people who lived in different houses, 25% moved from this county. Out of people who lived in different houses, 56% moved from different county within same state. Out of people who lived in different houses, 32% moved from different state. Out of people who lived in different houses, 0% moved from abroad.
Private vs. public school enrollment:
Students in private schools in grades 1 to 8 (elementary and middle school): 40
Here:
8.7%
North Carolina:
13.8%
Students in private schools in grades 9 to 12 (high school): 227
Here:
47.9%
North Carolina:
11.9%
Students in private undergraduate colleges: 9
Here:
4.1%
North Carolina:
19.3%
Occupation by median earnings in the past 12 months ($)
141,735Architecture and engineering occupations
72,544Construction and extraction occupations
71,998Health diagnosing and treating practitioners and other technical occupations
70,364Fire fighting and prevention, and other protective service workers including supervisors
64,102Business and financial operations occupations
52,421Material moving occupations
Companies with federal contracts located in this zip code:
PRECISION SCALE SYSTEMS INC (8098 OLD MIDDLESEX RD in BAILEY, NC; small business)
$1,220 with Navy for Maintenance, Repair and Rebuilding of Equipment -- Instruments and Laboratory Equipment. Signed on 2004-11-15. Completion date: 2005-11-30.
Top industries in this zip code by the number of employees in 2005:
Other Services (except Public Administration): Automotive Body, Paint, and Interior Repair and Maintenance (20-49 employees: 1 establishment, 10-19 employees: 1 establishment)
Accommodation and Food Services: Limited-Service Restaurants (20-49: 1, 5-9: 1)
Health Care and Social Assistance: Child Day Care Services (20-49: 1, 1-4: 1)
Wholesale Trade: Automobile and Other Motor Vehicle Merchant Wholesalers (20-49: 1)
Fatal accident statistics in 2014:
Fatal accident count: 1
Vehicles involved in fatal accidents: 1
Fatal accidents caused by drunken drivers: 0
Fatalities: 1
Persons involved in fatal accidents: 1
Pedestrians involved in fatal accidents: 1
Fatal accident statistics in 2013:
Fatal accident count: 1
Vehicles involved in fatal accidents: 1
Fatal accidents caused by drunken drivers: 1
Fatalities: 2
Persons involved in fatal accidents: 2
Pedestrians involved in fatal accidents: 0
Home Mortgage Disclosure Act Aggregated Statistics For Year 2009 (Based on 6 partial tracts)
A) FHA, FSA/RHS & VA Home Purchase Loans
B) Conventional Home Purchase Loans
C) Refinancings
D) Home Improvement Loans
F) Non-occupant Loans on < 5 Family Dwellings (A B C & D)
G) Loans On Manufactured Home Dwelling (A B C & D)
Number
Average Value
Number
Average Value
Number
Average Value
Number
Average Value
Number
Average Value
Number
Average Value
LOANS ORIGINATED
44
$119,732
33
$168,005
152
$134,387
8
$53,005
16
$68,263
27
$69,868
APPLICATIONS APPROVED, NOT ACCEPTED
1
$60,050
6
$117,613
5
$148,356
0
$0
2
$57,250
1
$64,000
APPLICATIONS DENIED
9
$124,166
8
$82,474
35
$141,963
14
$17,688
7
$29,971
14
$79,806
APPLICATIONS WITHDRAWN
3
$114,577
5
$222,414
29
$116,945
3
$19,083
1
$30,050
6
$72,618
FILES CLOSED FOR INCOMPLETENESS
0
$0
3
$90,307
6
$124,783
0
$0
2
$57,250
2
$93,965
Aggregated Statistics For Year 2008 (Based on 6 partial tracts)
A) FHA, FSA/RHS & VA Home Purchase Loans
B) Conventional Home Purchase Loans
C) Refinancings
D) Home Improvement Loans
F) Non-occupant Loans on < 5 Family Dwellings (A B C & D)
G) Loans On Manufactured Home Dwelling (A B C & D)
Number
Average Value
Number
Average Value
Number
Average Value
Number
Average Value
Number
Average Value
Number
Average Value
LOANS ORIGINATED
26
$119,778
76
$124,765
93
$125,914
11
$71,823
28
$71,464
27
$66,994
APPLICATIONS APPROVED, NOT ACCEPTED
4
$106,522
4
$57,588
17
$79,658
1
$47,770
1
$58,980
9
$59,436
APPLICATIONS DENIED
8
$152,131
12
$53,475
77
$126,272
21
$34,866
5
$90,444
24
$57,926
APPLICATIONS WITHDRAWN
6
$119,313
8
$108,308
37
$149,326
3
$48,353
3
$144,830
8
$87,104
FILES CLOSED FOR INCOMPLETENESS
0
$0
3
$96,570
3
$133,777
0
$0
0
$0
0
$0
Aggregated Statistics For Year 2007 (Based on 6 partial tracts)
A) FHA, FSA/RHS & VA Home Purchase Loans
B) Conventional Home Purchase Loans
C) Refinancings
D) Home Improvement Loans
F) Non-occupant Loans on < 5 Family Dwellings (A B C & D)
G) Loans On Manufactured Home Dwelling (A B C & D)
Number
Average Value
Number
Average Value
Number
Average Value
Number
Average Value
Number
Average Value
Number
Average Value
LOANS ORIGINATED
28
$125,402
109
$136,060
100
$109,684
14
$45,202
14
$86,911
39
$81,837
APPLICATIONS APPROVED, NOT ACCEPTED
4
$98,460
17
$91,801
30
$96,388
7
$65,119
0
$0
9
$73,872
APPLICATIONS DENIED
6
$133,810
21
$74,408
120
$108,664
30
$44,574
4
$80,795
36
$66,474
APPLICATIONS WITHDRAWN
2
$80,340
12
$151,696
41
$116,477
4
$51,068
1
$50,250
11
$70,799
FILES CLOSED FOR INCOMPLETENESS
1
$41,730
2
$152,625
10
$137,084
0
$0
0
$0
1
$41,730
Aggregated Statistics For Year 2006 (Based on 6 partial tracts)
A) FHA, FSA/RHS & VA Home Purchase Loans
B) Conventional Home Purchase Loans
C) Refinancings
D) Home Improvement Loans
F) Non-occupant Loans on < 5 Family Dwellings (A B C & D)
G) Loans On Manufactured Home Dwelling (A B C & D)
Number
Average Value
Number
Average Value
Number
Average Value
Number
Average Value
Number
Average Value
Number
Average Value
LOANS ORIGINATED
33
$104,423
113
$107,832
104
$113,043
29
$31,250
18
$76,771
39
$74,563
APPLICATIONS APPROVED, NOT ACCEPTED
6
$100,873
22
$74,433
25
$67,115
6
$37,035
3
$131,843
17
$63,095
APPLICATIONS DENIED
5
$133,664
51
$103,003
117
$105,615
23
$44,174
10
$96,553
53
$64,468
APPLICATIONS WITHDRAWN
0
$0
14
$143,761
31
$118,986
5
$38,724
0
$0
3
$67,807
FILES CLOSED FOR INCOMPLETENESS
0
$0
5
$101,572
11
$117,416
0
$0
0
$0
0
$0
Aggregated Statistics For Year 2005 (Based on 6 partial tracts)
A) FHA, FSA/RHS & VA Home Purchase Loans
B) Conventional Home Purchase Loans
C) Refinancings
D) Home Improvement Loans
F) Non-occupant Loans on < 5 Family Dwellings (A B C & D)
G) Loans On Manufactured Home Dwelling (A B C & D)
Number
Average Value
Number
Average Value
Number
Average Value
Number
Average Value
Number
Average Value
Number
Average Value
LOANS ORIGINATED
27
$123,641
95
$112,840
134
$104,101
16
$35,338
16
$78,272
34
$71,476
APPLICATIONS APPROVED, NOT ACCEPTED
3
$78,550
13
$69,744
37
$89,306
2
$47,145
1
$36,720
14
$58,609
APPLICATIONS DENIED
3
$77,333
47
$72,686
114
$96,532
23
$69,503
5
$51,090
51
$52,388
APPLICATIONS WITHDRAWN
5
$136,030
10
$108,561
57
$117,187
2
$176,945
0
$0
12
$84,793
FILES CLOSED FOR INCOMPLETENESS
0
$0
7
$93,467
13
$97,689
0
$0
0
$0
0
$0
Aggregated Statistics For Year 2004 (Based on 6 partial tracts)
A) FHA, FSA/RHS & VA Home Purchase Loans
B) Conventional Home Purchase Loans
C) Refinancings
D) Home Improvement Loans
F) Non-occupant Loans on < 5 Family Dwellings (A B C & D)
G) Loans On Manufactured Home Dwelling (A B C & D)
Number
Average Value
Number
Average Value
Number
Average Value
Number
Average Value
Number
Average Value
Number
Average Value
LOANS ORIGINATED
24
$103,335
95
$86,451
145
$92,310
27
$17,724
22
$47,905
47
$63,175
APPLICATIONS APPROVED, NOT ACCEPTED
3
$102,520
13
$88,764
17
$101,701
1
$59,640
1
$93,370
9
$61,458
APPLICATIONS DENIED
7
$92,626
37
$47,402
130
$83,028
22
$38,360
7
$63,714
39
$56,651
APPLICATIONS WITHDRAWN
0
$0
11
$98,099
47
$99,411
2
$26,430
0
$0
5
$66,984
FILES CLOSED FOR INCOMPLETENESS
2
$80,830
0
$0
9
$99,009
0
$0
0
$0
2
$94,570
Aggregated Statistics For Year 2003 (Based on 6 partial tracts)
A) FHA, FSA/RHS & VA Home Purchase Loans
B) Conventional Home Purchase Loans
C) Refinancings
D) Home Improvement Loans
F) Non-occupant Loans on < 5 Family Dwellings (A B C & D)
Number
Average Value
Number
Average Value
Number
Average Value
Number
Average Value
Number
Average Value
LOANS ORIGINATED
27
$97,630
106
$88,953
296
$104,706
22
$21,668
24
$62,634
APPLICATIONS APPROVED, NOT ACCEPTED
6
$85,237
18
$65,985
43
$107,463
0
$0
1
$40,520
APPLICATIONS DENIED
3
$76,997
46
$61,918
146
$74,465
16
$11,584
7
$22,746
APPLICATIONS WITHDRAWN
3
$109,187
18
$84,998
56
$87,381
3
$11,073
1
$105,560
FILES CLOSED FOR INCOMPLETENESS
0
$0
0
$0
14
$94,495
0
$0
2
$86,740
Aggregated Statistics For Year 2002 (Based on 6 partial tracts)
A) FHA, FSA/RHS & VA Home Purchase Loans
B) Conventional Home Purchase Loans
C) Refinancings
D) Home Improvement Loans
F) Non-occupant Loans on < 5 Family Dwellings (A B C & D)
Number
Average Value
Number
Average Value
Number
Average Value
Number
Average Value
Number
Average Value
LOANS ORIGINATED
35
$94,133
95
$89,795
156
$95,624
30
$9,150
11
$75,352
APPLICATIONS APPROVED, NOT ACCEPTED
2
$81,690
20
$60,768
34
$70,385
9
$20,404
4
$26,068
APPLICATIONS DENIED
0
$0
87
$40,161
90
$77,839
30
$18,389
2
$6,485
APPLICATIONS WITHDRAWN
4
$90,288
11
$133,084
50
$99,645
13
$33,638
0
$0
FILES CLOSED FOR INCOMPLETENESS
0
$0
1
$58,980
7
$75,680
0
$0
1
$97,670
Aggregated Statistics For Year 2001 (Based on 6 partial tracts)
A) FHA, FSA/RHS & VA Home Purchase Loans
B) Conventional Home Purchase Loans
C) Refinancings
D) Home Improvement Loans
F) Non-occupant Loans on < 5 Family Dwellings (A B C & D)
Number
Average Value
Number
Average Value
Number
Average Value
Number
Average Value
Number
Average Value
LOANS ORIGINATED
21
$90,869
118
$79,590
183
$77,583
40
$12,694
14
$68,424
APPLICATIONS APPROVED, NOT ACCEPTED
0
$0
25
$42,551
27
$81,914
2
$9,390
0
$0
APPLICATIONS DENIED
0
$0
85
$46,331
78
$67,959
21
$13,521
9
$53,898
APPLICATIONS WITHDRAWN
0
$0
15
$95,374
36
$104,014
8
$21,080
0
$0
FILES CLOSED FOR INCOMPLETENESS
0
$0
2
$81,790
19
$77,415
0
$0
0
$0
Aggregated Statistics For Year 2000 (Based on 6 partial tracts)
A) FHA, FSA/RHS & VA Home Purchase Loans
B) Conventional Home Purchase Loans
C) Refinancings
D) Home Improvement Loans
F) Non-occupant Loans on < 5 Family Dwellings (A B C & D)
Number
Average Value
Number
Average Value
Number
Average Value
Number
Average Value
Number
Average Value
LOANS ORIGINATED
18
$84,744
108
$75,739
52
$70,144
23
$8,826
17
$27,011
APPLICATIONS APPROVED, NOT ACCEPTED
13
$34,751
27
$63,573
24
$62,057
7
$13,266
0
$0
APPLICATIONS DENIED
17
$57,151
77
$48,560
70
$60,134
8
$15,251
3
$74,627
APPLICATIONS WITHDRAWN
3
$90,210
12
$66,276
41
$69,900
4
$37,050
0
$0
FILES CLOSED FOR INCOMPLETENESS
0
$0
8
$106,156
6
$52,937
0
$0
0
$0
Aggregated Statistics For Year 1999 (Based on 3 partial tracts)
A) FHA, FSA/RHS & VA Home Purchase Loans
B) Conventional Home Purchase Loans
C) Refinancings
D) Home Improvement Loans
F) Non-occupant Loans on < 5 Family Dwellings (A B C & D)
2002 - 2018 National Fire Incident Reporting System (NFIRS) incidents
Based on the data from the years 2002 - 2018 the average number of fire incidents per year is 41. The highest number of reported fires - 97 took place in 2011, and the least - 5 in 2006. The data has a rising trend.
When looking into fire subcategories, the most reports belonged to: Structure Fires (48.0%), and Outside Fires (36.6%).
Fire incident types reported to NFIRS in Zip Code 27807


 Nearest zip codes: 27880, 27557, 27896, 27882, 27851, 27542.


 Based on the data from the years 2002 - 2018 the average number of fire incidents per year is 41. The highest number of reported fires - 97 took place in 2011, and the least - 5 in 2006. The data has a rising trend.
 When looking into fire subcategories, the most reports belonged to: Structure Fires (48.0%), and Outside Fires (36.6%).