Estimated zip code population in 2022: 8,372 Zip code population in 2010: 7,413 Zip code population in 2000: 6,197
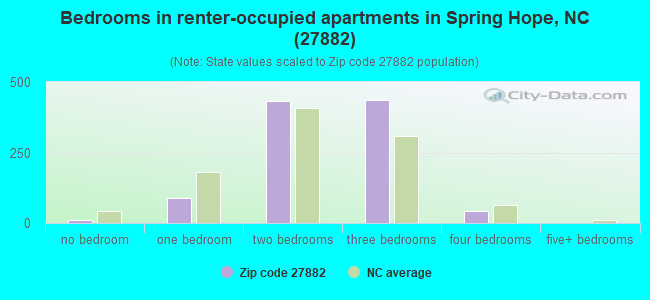
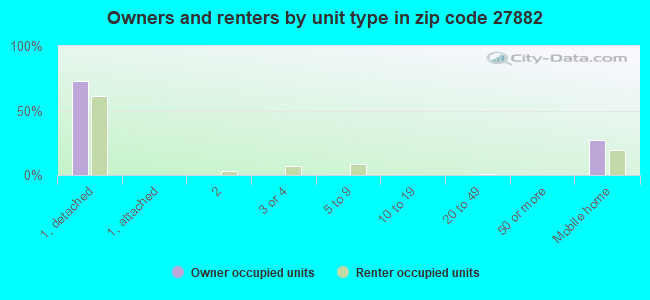
Houses and condos: 3,873 Renter-occupied apartments: 1,017
% of renters here:
33%
State:
33%
March 2022 cost of living index in zip code 27882: 79.7 (low, U.S. average is 100)
Land area: 99.1 sq. mi. Water area: 0.3 sq. mi.
Population density: 84 people per square mile
(very low).
OSM Map
General Map
Google Map
MSN Map
OSM Map
General Map
Google Map
MSN Map
OSM Map
General Map
Google Map
MSN Map
OSM Map
General Map
Google Map
MSN Map
Please wait while loading the map...
Real estate property taxes paid for housing units in 2022:
This zip code:
0.6% ($1,048)
North Carolina:
0.6% ($1,769)
Median real estate property taxes paid for housing units with mortgages in 2022: $1,391 (0.7%) Median real estate property taxes paid for housing units with no mortgage in 2022: $830 (0.6%)
Averages for the 2020 tax year for zip code 27882, filed in 2021:
Average Adjusted Gross Income (AGI) in 2020: $47,195 (Individual Income Tax Returns)
Here:
$47,195
State:
$70,020
Salary/wage: $42,186 (reported on 83.1% of returns)
Here:
$42,186
State:
$58,387
(% of AGI for various income ranges: 1385.8% for AGIs below $25k, 4067.2% for AGIs $25k-50k, 6886.4% for AGIs $50k-75k, 10022.9% for AGIs $75k-100k, 17015.9% for AGIs $100k-200k)
Taxable interest for individuals: $718 (reported on 22.9% of returns)
This zip code:
$718
North Carolina:
$1,479
(% of AGI for various income ranges: 9.7% for AGIs below $25k, 12.8% for AGIs $25k-50k, 25.8% for AGIs $50k-75k, 67.6% for AGIs $75k-100k, 54.7% for AGIs $100k-200k)
Ordinary dividends: $2,886 (reported on 9.8% of returns)
Here:
$2,886
State:
$7,888
(% of AGI for various income ranges: 8.7% for AGIs below $25k, 13.3% for AGIs $25k-50k, 52.2% for AGIs $50k-75k, 50.6% for AGIs $75k-100k, 248.8% for AGIs $100k-200k)
Net capital gain/loss in AGI: +$6,357 (reported on 8.2% of returns)
Here:
+$6,357
State:
+$23,652
(% of AGI for various income ranges: 4.6% for AGIs below $25k, 5.8% for AGIs $25k-50k, 31.9% for AGIs $50k-75k, 80.0% for AGIs $75k-100k, 570.6% for AGIs $100k-200k)
Profit/loss from business: +$6,335 (reported on 14.7% of returns)
Here:
+$6,335
State:
+$11,710
(% of AGI for various income ranges: 118.4% for AGIs below $25k, 84.1% for AGIs $25k-50k, 0.6% for AGIs $50k-75k, 22.9% for AGIs $75k-100k, 884.7% for AGIs $100k-200k)
Taxable individual retirement arrangement distribution: $13,933 (reported on 6.5% of returns)
27882:
$13,933
North Carolina:
$20,247
(% of AGI for various income ranges: 45.9% for AGIs below $25k, 62.8% for AGIs $25k-50k, 145.8% for AGIs $50k-75k, 307.6% for AGIs $75k-100k, 784.1% for AGIs $100k-200k)
Total itemized deductions: $33,100 (reported on 3.8% of returns)
Here:
$33,100
State:
$34,549
(% of AGI for various income ranges: 97.1% for AGIs $25k-50k, 271.7% for AGIs $50k-75k, 868.2% for AGIs $100k-200k)
Charity contributions: $14,564 (reported on 3.0% of returns)
Here:
$14,564
State:
$13,360
(% of AGI for various income ranges: 12.1% for AGIs below $25k, 85.8% for AGIs $50k-75k, 390.0% for AGIs $100k-200k)
Taxes paid: $6,536 (reported on 3.8% of returns)
27882:
$6,536
State:
$7,586
(% of AGI for various income ranges: 9.2% for AGIs $25k-50k, 58.6% for AGIs $50k-75k, 224.1% for AGIs $100k-200k)
Earned income credit: $2,334 (reported on 24.5% of returns)
Here:
$2,334
State:
$2,337
(% of AGI for various income ranges: 136.0% for AGIs below $25k, 89.7% for AGIs $25k-50k)
Percentage of individuals using paid preparers for their 2020 taxes: 91.3%
Here:
91%
State:
93%
(% for various income ranges: 90.7% for AGIs below $25k, 91.4% for AGIs $25k-50k, 92.2% for AGIs $50k-75k, 92.0% for AGIs $75k-100k, 93.3% for AGIs $100k-200k, 83.3% for AGIs over 200k)
Averages for the 2012 tax year for zip code 27882, filed in 2013:
Average Adjusted Gross Income (AGI) in 2012: $37,808 (Individual Income Tax Returns)
Here:
$37,808
State:
$54,937
Salary/wage: $34,120 (reported on 84.6% of returns)
Here:
$34,120
State:
$46,336
(% of AGI for various income ranges: 76.3% for AGIs below $25k, 81.6% for AGIs $25k-50k, 77.1% for AGIs $50k-75k, 74.8% for AGIs $75k-100k, 70.4% for AGIs $100k-200k)
Taxable interest for individuals: $1,007 (reported on 26.2% of returns)
This zip code:
$1,007
North Carolina:
$1,298
(% of AGI for various income ranges: 0.9% for AGIs below $25k, 0.6% for AGIs $25k-50k, 0.6% for AGIs $50k-75k, 0.6% for AGIs $75k-100k, 0.8% for AGIs $100k-200k)
Ordinary dividends: $2,497 (reported on 10.5% of returns)
Here:
$2,497
State:
$6,213
(% of AGI for various income ranges: 0.5% for AGIs below $25k, 0.7% for AGIs $25k-50k, 0.8% for AGIs $50k-75k, 0.6% for AGIs $75k-100k, 0.7% for AGIs $100k-200k)
Net capital gain/loss in AGI: +$2,294 (reported on 9.8% of returns)
Here:
+$2,294
State:
+$12,740
(% of AGI for various income ranges: 0.3% for AGIs $25k-50k, 0.2% for AGIs $50k-75k, 0.2% for AGIs $75k-100k, 1.9% for AGIs $100k-200k)
Profit/loss from business: +$6,125 (reported on 14.8% of returns)
Here:
+$6,125
State:
+$10,311
(% of AGI for various income ranges: 7.0% for AGIs below $25k, 1.4% for AGIs $25k-50k, 1.1% for AGIs $50k-75k, 1.0% for AGIs $75k-100k, 2.4% for AGIs $100k-200k)
Taxable individual retirement arrangement distribution: $11,750 (reported on 8.0% of returns)
27882:
$11,750
North Carolina:
$15,575
(% of AGI for various income ranges: 2.0% for AGIs below $25k, 1.7% for AGIs $25k-50k, 2.4% for AGIs $50k-75k, 3.1% for AGIs $75k-100k, 3.5% for AGIs $100k-200k)
Total itemized deductions: $18,273 (25% of AGI, reported on 22.8% of returns)
Here:
$18,273
State:
$23,438
Here:
25.5% of AGI
State:
21.5% of AGI
(% of AGI for various income ranges: 6.8% for AGIs below $25k, 8.9% for AGIs $25k-50k, 11.7% for AGIs $50k-75k, 12.8% for AGIs $75k-100k, 14.9% for AGIs $100k-200k)
Charity contributions: $4,100 (reported on 19.4% of returns)
Here:
$4,100
State:
$4,687
(% of AGI for various income ranges: 0.8% for AGIs below $25k, 1.7% for AGIs $25k-50k, 2.0% for AGIs $50k-75k, 2.4% for AGIs $75k-100k, 3.4% for AGIs $100k-200k)
Taxes paid: $5,334 (reported on 22.8% of returns)
27882:
$5,334
State:
$8,823
(% of AGI for various income ranges: 0.9% for AGIs below $25k, 1.7% for AGIs $25k-50k, 3.2% for AGIs $50k-75k, 4.3% for AGIs $75k-100k, 6.0% for AGIs $100k-200k)
Earned income credit: $2,516 (reported on 28.6% of returns)
Here:
$2,516
State:
$2,376
(% of AGI for various income ranges: 8.9% for AGIs below $25k, 1.6% for AGIs $25k-50k)
Percentage of individuals using paid preparers for their 2012 taxes: 53.8%
Here:
54%
State:
53%
(% for various income ranges: 53.3% for AGIs below $25k, 51.6% for AGIs $25k-50k, 55.3% for AGIs $50k-75k, 52.4% for AGIs $75k-100k, 68.4% for AGIs $100k-200k)
Averages for the 2004 tax year for zip code 27882, filed in 2005:
Average Adjusted Gross Income (AGI) in 2004: $32,576 (Individual Income Tax Returns)
Here:
$32,576
State:
$45,376
Salary/wage: $30,508 (reported on 87.3% of returns)
Here:
$30,508
State:
$39,442
(% of AGI for various income ranges: 139.6% for AGIs below $10k, 84.5% for AGIs $10k-25k, 85.9% for AGIs $25k-50k, 81.8% for AGIs $50k-75k, 80.2% for AGIs $75k-100k, 63.4% for AGIs over 100k)
Taxable interest for individuals: $1,043 (reported on 31.4% of returns)
This zip code:
$1,043
North Carolina:
$1,515
(% of AGI for various income ranges: 4.5% for AGIs below $10k, 0.8% for AGIs $10k-25k, 1.0% for AGIs $25k-50k, 0.9% for AGIs $50k-75k, 0.8% for AGIs $75k-100k, 1.2% for AGIs over 100k)
Taxable dividends: $2,069 (reported on 11.4% of returns)
Here:
$2,069
State:
$4,016
(% of AGI for various income ranges: 1.6% for AGIs below $10k, 0.6% for AGIs $10k-25k, 0.4% for AGIs $25k-50k, 0.9% for AGIs $50k-75k, 0.4% for AGIs $75k-100k, 1.4% for AGIs over 100k)
Net capital gain/loss: +$4,663 (reported on 9.4% of returns)
Here:
+$4,663
State:
+$11,152
(% of AGI for various income ranges: 0.9% for AGIs below $10k, 0.3% for AGIs $10k-25k, 0.6% for AGIs $25k-50k, 0.9% for AGIs $50k-75k, 1.0% for AGIs $75k-100k, 4.8% for AGIs over 100k)
Profit/loss from business: +$6,959 (reported on 13.6% of returns)
Here:
+$6,959
State:
+$9,490
(% of AGI for various income ranges: 7.2% for AGIs below $10k, 3.1% for AGIs $10k-25k, 1.2% for AGIs $25k-50k, 2.6% for AGIs $50k-75k, 3.1% for AGIs $75k-100k, 5.8% for AGIs over 100k)
IRA payment deduction: $3,000 (reported on 2.3% of returns)
27882:
$3,000
North Carolina:
$2,967
(% of AGI for various income ranges: 0.2% for AGIs $10k-25k, 0.2% for AGIs $25k-50k, 0.3% for AGIs $50k-75k, 0.3% for AGIs over 100k)
Total itemized deductions: $15,013 (25% of AGI, reported on 25.5% of returns)
Here:
$15,013
State:
$19,464
Here:
24.9% of AGI
State:
22.7% of AGI
(% of AGI for various income ranges: 12.3% for AGIs below $10k, 6.0% for AGIs $10k-25k, 11.0% for AGIs $25k-50k, 15.0% for AGIs $50k-75k, 14.0% for AGIs $75k-100k, 13.4% for AGIs over 100k)
Charity contributions deductions: $3,364 (5% of AGI, reported on 21.8% of returns)
Here:
$3,364
State:
$4,035
Here:
5.4% of AGI
State:
4.5% of AGI
(% of AGI for various income ranges: 0.9% for AGIs below $10k, 0.9% for AGIs $10k-25k, 1.9% for AGIs $25k-50k, 3.0% for AGIs $50k-75k, 2.7% for AGIs $75k-100k, 3.2% for AGIs over 100k)
Total tax: $4,044 (reported on 65.4% of returns)
27882:
$4,044
State:
$7,257
(% of AGI for various income ranges: 3.2% for AGIs below $10k, 3.1% for AGIs $10k-25k, 5.6% for AGIs $25k-50k, 8.6% for AGIs $50k-75k, 10.5% for AGIs $75k-100k, 17.0% for AGIs over 100k)
Earned income credit: $1,926 (reported on 25.5% of returns)
Here:
$1,926
State:
$1,851
Percentage of individuals using paid preparers for their 2004 taxes: 61.4%
Here:
61%
State:
62%
(% for various income ranges: 56.5% for AGIs below $10k, 63.3% for AGIs $10k-25k, 62.3% for AGIs $25k-50k, 57.8% for AGIs $50k-75k, 64.5% for AGIs $75k-100k, 72.5% for AGIs over 100k)
Household received Food Stamps/SNAP in the past 12 months: 683 Household did not receive Food Stamps/SNAP in the past 12 months: 2,473
Women who had a birth in the past 12 months: 190 (111 now married, 77 unmarried) Women who did not have a birth in the past 12 months: 1,778 (531 now married, 1,242 unmarried)
Housing units in zip code 27882 with a mortgage: 1,078 (39 second mortgage, 9 both second mortgage and home equity loan) Houses without a mortgage: 150
Median monthly owner costs for units with a mortgage: $1,249 Median monthly owner costs for units without a mortgage: $385
Residents with income below the poverty level in 2022:
This zip code:
13.3%
Whole state:
12.8%
Residents with income below 50% of the poverty level in 2022:
This zip code:
10.6%
Whole state:
6.8%
Median number of rooms in houses and condos:
Here:
6.1
State:
6.4
Median number of rooms in apartments:
Here:
4.6
State:
4.4
Notable locations in this zip code not listed on our city pages
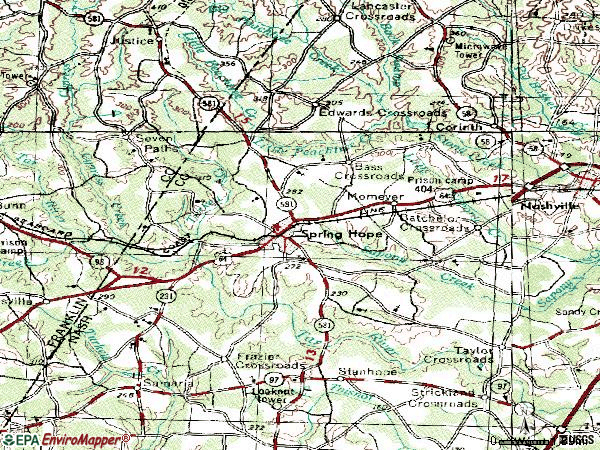
Notable locations in zip code 27882: Peachtree Hills Country Club (A), Webbs Mill (B), Pace Crossroads (C), Red Crossroads (D). Display/hide their locations on the map
Churches in zip code 27882 include: Holly Grove Church (A), Lettuce Hollow Church (B), Bethel Church (C), Macedonia Church (D), Morning Star Church (E), Mount Olie Church (F), Peachtree Church (G), Pleasant Hill Church (H), Elizabeth Church (I). Display/hide their locations on the map
Reservoirs: Barbees Pond (A), Bass Pond (B), Jeffries Pond (C), Brantleys Pond (D), Webbs Millpond (E), Mullens Pond (F), Stanciels Pond (G). Display/hide their locations on the map
Streams, rivers, and creeks: Beaverdam Branch (A), White Creek (B), Turkey Creek (C), Back Swamp (D), Biddie Toe Creek (E), Coker Creek (F), Crooked Creek (G), Gabe Branch (H), Henry Branch (I). Display/hide their locations on the map
In group quarters: 29 (-1 institutionalized population)
Size of family households: 833 2-persons, 485 3-persons, 321 4-persons, 222 5-persons, 134 6-persons, 36 7-or-more-persons
Size of nonfamily households: 1,009 1-person, 88 2-persons
915 married couples with children.
458 single-parent households (160 men, 298 women).
87.7% of residents of 27882 zip code speak English at home.
11.0% of residents speak Spanish at home (57% very well, 24% well, 20% not well).
1.0% of residents speak other Indo-European language at home (41% very well, 27% well, 32% not well).
0.1% of residents speak Asian or Pacific Island language at home (100% well).
Foreign born population: 488 (5.8%) (7.4% of them are naturalized citizens)
This zip code:
5.8%
Whole state:
8.6%
70%Honduras
13%Guyana
2%France
1%Taiwan
1%Costa Rica
1%Uruguay
1%Denmark
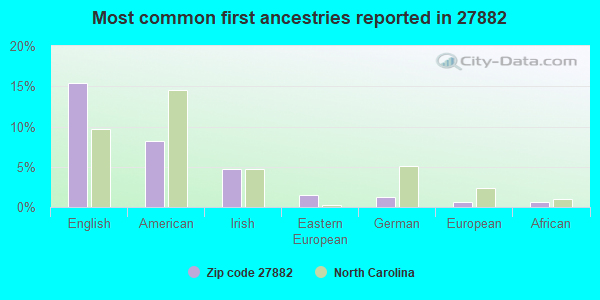
15%English
8%American
5%Irish
2%Eastern European
1%German
1%European
1%African
Year of entry for the foreign-born population
832010 or later
1342000 to 2009
2451990 to 1999
50Before 1990
Facilities with environmental interests located in this zip code:
BELT CONCEPTS OF AMERICA INCORPORATED (605 N. PINE ST. in SPRING HOPE, NC)
AIR MINOR (AIRS/AFS) STATE MASTER (North Carolina facility info) - -115DA4YG00M29W84AY3Y8CA0GK, WASTEWATER FACILITY, -2350, AIR PROGRAM, -6481, HAZARDOUS WASTE PROGRAM CRITERIA AND HAZARDOUS AIR POLLUTANT INVENTORY (Inventory of air pollution sources) National Pollutant Discharge Elimination System NON-MAJOR (Tracking pollutant discharge elimination systems) - permit National Pollutant Discharge Elimination System NON-MAJOR (Tracking pollutant discharge elimination systems) - permit Conditionally Exempt Small Quantity Generators, less than 100 kg/month of hazardous waste (Resource Conservation and Recovery Act (tracking hazardous waste)) - notification TRI REPORTER (Tracking of toxic chemicals releasing facilities) Business SIC classification: RUBBER AND PLASTICS HOSE AND BELTING; NONCLASSIFIABLE ESTABLISHMENTS Business NAICS classification: ALL OTHER PLASTICS PRODUCT MANUFACTURING.; ALL OTHER PLASTICS PRODUCT MANUFACTURING. Organizations: JOHN WILLIS (CONTACT/OWNER)
AMERICAN ROCKWOOL INCORPORATED (820 EAST NASH STREET in SPRING HOPE, NC)
AIR MAJOR (AIRS/AFS) STATE MASTER (North Carolina facility info) - -115DA4YG00M29W84AX3YG9CPXF, WASTEWATER FACILITY, -2339, AIR PROGRAM CRITERIA AND HAZARDOUS AIR POLLUTANT INVENTORY (Inventory of air pollution sources) National Pollutant Discharge Elimination System NON-MAJOR (Tracking pollutant discharge elimination systems) - permit (Resource Conservation and Recovery Act (tracking hazardous waste)) TRI REPORTER (Tracking of toxic chemicals releasing facilities) Business SIC and NAICS classification: MINERAL WOOL Organizations: OPERNAME (CONTACT/OPERATOR)
, ALUMINUM COMPANY OF AMERICA (CONTACT/OWNER)
Housing units lacking complete plumbing facilities: 5.7% Housing units lacking complete kitchen facilities: 4.7%
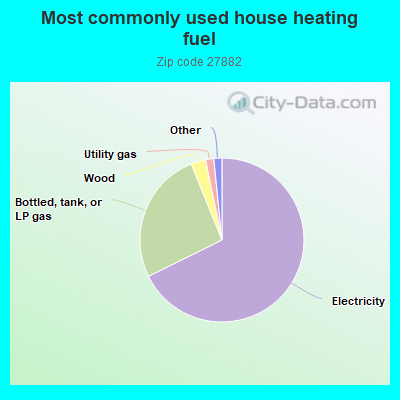
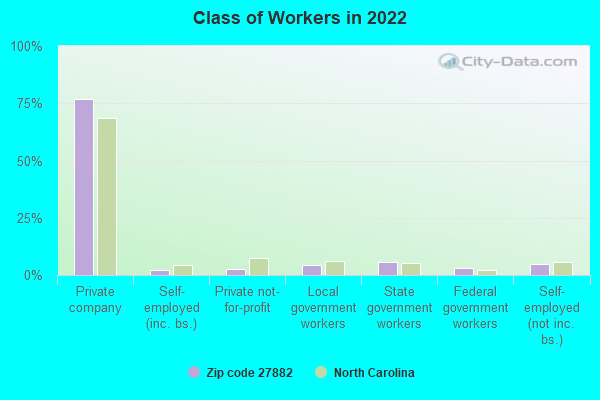
67.7%Electricity
26.2%Bottled, tank, or LP gas
2.9%Wood
1.6%Utility gas
0.7%No fuel used
0.5%Fuel oil, kerosene, etc.
0.5%Other fuel
Population in 1990: 6,180. Population change in the 1990s: +17 (+0.3%).
Place of birth for U.S.-born residents:
This state: 6,196
Northeast: 404
Midwest: 75
South: 996
West: 65
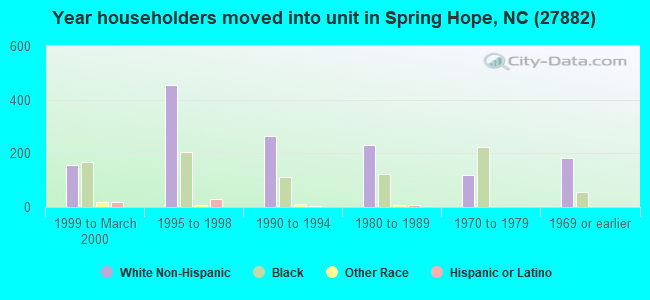
63% of the 27882 zip code residents lived in the same house 5 years ago. Out of people who lived in different houses, 59% lived in this county. Out of people who lived in different counties, 50% lived in North Carolina.
90% of the 27882 zip code residents lived in the same house 1 year ago. Out of people who lived in different houses, 43% moved from this county. Out of people who lived in different houses, 39% moved from different county within same state. Out of people who lived in different houses, 19% moved from different state.
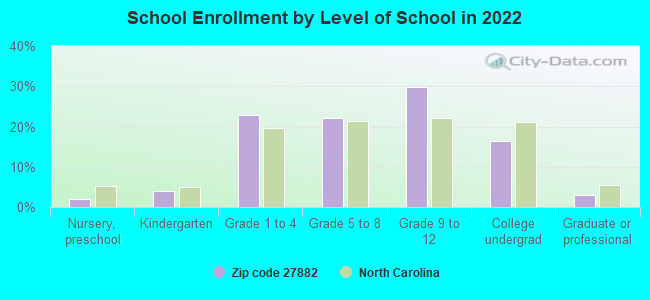
Private vs. public school enrollment:
Students in private schools in grades 1 to 8 (elementary and middle school): 42
Here:
5.8%
North Carolina:
13.8%
Students in private schools in grades 9 to 12 (high school): 18
Here:
3.7%
North Carolina:
11.9%
Students in private undergraduate colleges: 10
Here:
3.9%
North Carolina:
19.3%
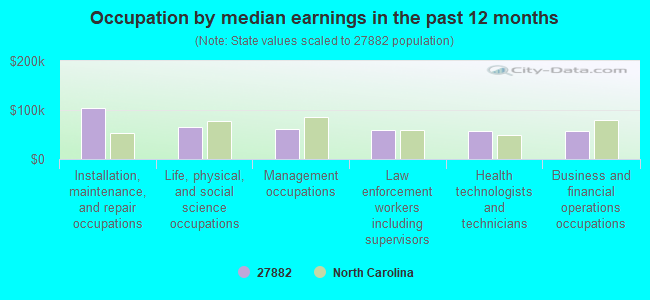
Occupation by median earnings in the past 12 months ($)
103,580Installation, maintenance, and repair occupations
65,659Life, physical, and social science occupations
62,058Management occupations
59,111Law enforcement workers including supervisors
57,180Health technologists and technicians
56,448Business and financial operations occupations
Companies with federal contracts located in this zip code:
H & S MANUFACTURING INC. OF BA (303 S PINE ST in SPRING HOPE, NC; small business) : $2,324,026 in 34 contractsfrom 2000 to 2003
Contracts for Armor, Personal, Individual Equipment, Camouflage and Deception Equipment by Air Force, Defense Logistics Agency, Army Signed by year:2000: $1,349,609; 2001: $413,430; 2002: $114,064; 2003: $446,923; 2004: $0; 2005: $0; 2006: $0.
Biggest contracts:
$203,982 with Air Force for Armor, Personal. Signed on 2000-09-01. Completion date: 2000-11-30.
$121,047 with Air Force for Individual Equipment. Taking place in FL. Signed on 2001-04-10. Completion date: 2001-04-09.
$111,257 with Air Force for Armor, Personal. Taking place in OK. Signed on 2000-09-26. Completion date: 2000-12-26.
$105,535 with Air Force for Armor, Personal. Signed on 2000-05-26. Completion date: 2000-08-24.
FARM PAK PRODUCTS CO INC (7840 OLD BAILEY HWY in SPRING HOPE, NC; small business) : $932,398 in 8 contractsfrom 2004 to 2005
Contracts for Fruits and Vegetables by Agricultural Marketing Service, Defense Logistics Agency Signed by year:2000: $0; 2001: $0; 2002: $0; 2003: $0; 2004: $30,890; 2005: $901,508; 2006: $0.
Biggest contracts:
$445,138 with Agricultural Marketing Service for Fruits and Vegetables. Signed on 2005-01-11. Completion date: 2005-06-22.
$445,138, same as above.Signed on 2005-01-11. Completion date: 2005-06-22.
$9,280 with Defense Logistics Agency for Fruits and Vegetables. Signed on 2004-11-13. Completion date: 2004-11-13.
$7,680, same as above.Signed on 2004-12-08. Completion date: 2004-12-08.
EDWARDS INC (4119 SHEEP PASTURE RD in SPRING HOPE, NC) : $10,638 in 3 contractsfrom 2002 to 2005
$5,358 with Army for Lease or Rental of Equipment -- Rope, Cable, Chain, and Fittings. Signed on 2002-01-15. Completion date: 2002-01-16.
$2,640 with U.S. Army Corps of Engineers - civil program financing only for Cranes and Crane-Shovels. Signed on 2005-01-25. Completion date: 2005-01-06.
$2,640 with Army for Cranes and Crane-Shovels. Signed on 2005-01-25. Completion date: 2005-01-06.
Top industries in this zip code by the number of employees in 2005:
Construction: All Other Specialty Trade Contractors (100-249 employees: 1 establishment)
Other Services (except Public Administration): Commercial and Industrial Machinery and Equipment (except Automotive and Electronic) Repair and Maintenance (50-99: 1, 10-19: 1, 1-4: 2)
Health Care and Social Assistance: Home Health Care Services (20-49: 1, 5-9: 1)
Accommodation and Food Services: Limited-Service Restaurants (10-19: 2, 1-4: 1)
People in group quarters in 2010:
28 people in workers' group living quarters and job corps centers
2 people in correctional residential facilities
Fatal accident statistics in 2014:
Fatal accident count: 1
Vehicles involved in fatal accidents: 1
Fatal accidents caused by drunken drivers: 0
Fatalities: 1
Persons involved in fatal accidents: 2
Pedestrians involved in fatal accidents: 1
Fatal accident statistics in 2013:
Fatal accident count: 1
Vehicles involved in fatal accidents: 2
Fatal accidents caused by drunken drivers: 0
Fatalities: 2
Persons involved in fatal accidents: 4
Pedestrians involved in fatal accidents: 0
Home Mortgage Disclosure Act Aggregated Statistics For Year 2009 (Based on 6 partial tracts)
A) FHA, FSA/RHS & VA Home Purchase Loans
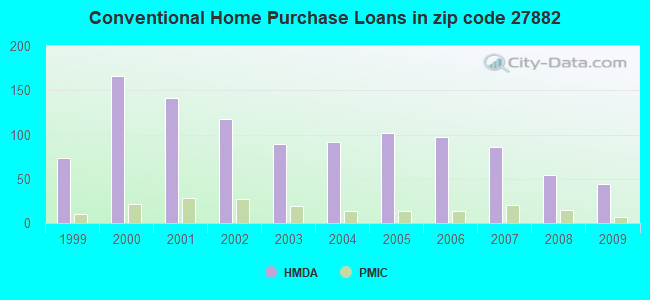
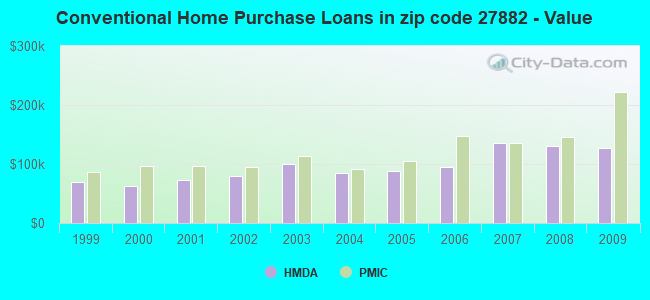
B) Conventional Home Purchase Loans
C) Refinancings
D) Home Improvement Loans
F) Non-occupant Loans on < 5 Family Dwellings (A B C & D)
G) Loans On Manufactured Home Dwelling (A B C & D)
Number
Average Value
Number
Average Value
Number
Average Value
Number
Average Value
Number
Average Value
Number
Average Value
LOANS ORIGINATED
42
$116,079
44
$126,804
114
$138,632
3
$37,503
12
$80,921
27
$75,089
APPLICATIONS APPROVED, NOT ACCEPTED
7
$106,991
3
$86,430
12
$140,257
3
$13,557
3
$79,360
5
$112,758
APPLICATIONS DENIED
3
$129,933
9
$84,027
72
$123,076
9
$8,467
2
$45,465
16
$70,291
APPLICATIONS WITHDRAWN
3
$78,133
5
$156,440
30
$114,654
0
$0
1
$38,580
8
$78,930
FILES CLOSED FOR INCOMPLETENESS
2
$113,635
2
$117,605
9
$138,141
0
$0
0
$0
1
$62,900
Aggregated Statistics For Year 2008 (Based on 6 partial tracts)
A) FHA, FSA/RHS & VA Home Purchase Loans
B) Conventional Home Purchase Loans
C) Refinancings
D) Home Improvement Loans
F) Non-occupant Loans on < 5 Family Dwellings (A B C & D)
G) Loans On Manufactured Home Dwelling (A B C & D)
Number
Average Value
Number
Average Value
Number
Average Value
Number
Average Value
Number
Average Value
Number
Average Value
LOANS ORIGINATED
39
$112,699
54
$129,751
99
$120,423
13
$63,510
17
$91,985
35
$87,240
APPLICATIONS APPROVED, NOT ACCEPTED
1
$154,300
7
$69,654
15
$106,690
3
$69,547
3
$67,157
7
$77,780
APPLICATIONS DENIED
8
$109,138
14
$62,744
105
$123,531
38
$36,001
8
$260,159
30
$69,703
APPLICATIONS WITHDRAWN
10
$110,807
13
$122,068
43
$131,903
6
$44,897
4
$151,472
17
$85,542
FILES CLOSED FOR INCOMPLETENESS
2
$103,110
2
$139,995
3
$134,480
0
$0
0
$0
0
$0
Aggregated Statistics For Year 2007 (Based on 6 partial tracts)
A) FHA, FSA/RHS & VA Home Purchase Loans
B) Conventional Home Purchase Loans
C) Refinancings
D) Home Improvement Loans
E) Loans on Dwellings For 5+ Families
F) Non-occupant Loans on < 5 Family Dwellings (A B C & D)
G) Loans On Manufactured Home Dwelling (A B C & D)
Number
Average Value
Number
Average Value
Number
Average Value
Number
Average Value
Number
Average Value
Number
Average Value
Number
Average Value
LOANS ORIGINATED
19
$116,955
86
$135,527
100
$95,064
24
$45,237
0
$0
30
$94,258
51
$74,857
APPLICATIONS APPROVED, NOT ACCEPTED
3
$96,503
10
$171,897
30
$163,785
7
$24,354
0
$0
4
$765,528
9
$62,762
APPLICATIONS DENIED
12
$124,790
38
$83,005
140
$112,308
38
$56,700
2
$14,250
6
$41,723
64
$87,180
APPLICATIONS WITHDRAWN
2
$129,895
14
$144,704
41
$100,315
15
$72,777
0
$0
1
$73,730
18
$81,420
FILES CLOSED FOR INCOMPLETENESS
1
$53,580
6
$184,598
9
$150,522
0
$0
0
$0
0
$0
1
$53,580
Aggregated Statistics For Year 2006 (Based on 6 partial tracts)
A) FHA, FSA/RHS & VA Home Purchase Loans
B) Conventional Home Purchase Loans
C) Refinancings
D) Home Improvement Loans
F) Non-occupant Loans on < 5 Family Dwellings (A B C & D)
G) Loans On Manufactured Home Dwelling (A B C & D)
Number
Average Value
Number
Average Value
Number
Average Value
Number
Average Value
Number
Average Value
Number
Average Value
LOANS ORIGINATED
32
$106,076
97
$94,665
130
$109,217
36
$45,044
31
$62,900
59
$78,269
APPLICATIONS APPROVED, NOT ACCEPTED
5
$87,556
26
$84,608
40
$73,495
3
$33,117
0
$0
21
$69,578
APPLICATIONS DENIED
7
$109,063
48
$85,450
163
$89,095
33
$46,695
4
$64,278
80
$65,714
APPLICATIONS WITHDRAWN
1
$84,030
5
$69,766
50
$116,602
10
$102,158
1
$59,460
4
$80,122
FILES CLOSED FOR INCOMPLETENESS
0
$0
4
$126,792
14
$121,301
0
$0
0
$0
2
$53,435
Aggregated Statistics For Year 2005 (Based on 6 partial tracts)
A) FHA, FSA/RHS & VA Home Purchase Loans
B) Conventional Home Purchase Loans
C) Refinancings
D) Home Improvement Loans
F) Non-occupant Loans on < 5 Family Dwellings (A B C & D)
G) Loans On Manufactured Home Dwelling (A B C & D)
Number
Average Value
Number
Average Value
Number
Average Value
Number
Average Value
Number
Average Value
Number
Average Value
LOANS ORIGINATED
36
$92,759
102
$88,141
158
$91,013
30
$47,308
27
$68,314
62
$72,675
APPLICATIONS APPROVED, NOT ACCEPTED
2
$43,370
15
$71,559
37
$80,925
2
$72,265
2
$32,895
11
$57,895
APPLICATIONS DENIED
8
$63,139
88
$72,448
167
$94,639
35
$59,873
12
$53,129
97
$66,099
APPLICATIONS WITHDRAWN
4
$104,202
27
$84,363
46
$95,073
5
$125,222
3
$62,737
21
$77,678
FILES CLOSED FOR INCOMPLETENESS
4
$73,272
3
$74,443
14
$108,144
3
$43,033
3
$57,003
3
$78,240
Aggregated Statistics For Year 2004 (Based on 6 partial tracts)
A) FHA, FSA/RHS & VA Home Purchase Loans
B) Conventional Home Purchase Loans
C) Refinancings
D) Home Improvement Loans
F) Non-occupant Loans on < 5 Family Dwellings (A B C & D)
G) Loans On Manufactured Home Dwelling (A B C & D)
Number
Average Value
Number
Average Value
Number
Average Value
Number
Average Value
Number
Average Value
Number
Average Value
LOANS ORIGINATED
29
$102,421
91
$85,184
181
$86,850
23
$29,953
38
$81,083
64
$62,801
APPLICATIONS APPROVED, NOT ACCEPTED
4
$87,492
18
$83,864
31
$79,493
2
$61,195
4
$44,205
15
$67,989
APPLICATIONS DENIED
7
$84,003
53
$64,137
154
$80,971
33
$34,105
8
$37,338
59
$61,640
APPLICATIONS WITHDRAWN
4
$122,565
13
$83,640
65
$87,989
7
$70,531
3
$46,117
14
$71,595
FILES CLOSED FOR INCOMPLETENESS
2
$78,455
0
$0
8
$95,378
0
$0
0
$0
3
$84,717
Aggregated Statistics For Year 2003 (Based on 6 partial tracts)
A) FHA, FSA/RHS & VA Home Purchase Loans
B) Conventional Home Purchase Loans
C) Refinancings
D) Home Improvement Loans
F) Non-occupant Loans on < 5 Family Dwellings (A B C & D)
Number
Average Value
Number
Average Value
Number
Average Value
Number
Average Value
Number
Average Value
LOANS ORIGINATED
33
$112,026
89
$100,815
313
$95,092
17
$18,416
19
$58,569
APPLICATIONS APPROVED, NOT ACCEPTED
3
$119,943
11
$70,052
43
$77,515
2
$15,205
4
$47,010
APPLICATIONS DENIED
4
$93,815
50
$61,365
178
$85,726
13
$10,952
8
$38,905
APPLICATIONS WITHDRAWN
6
$88,733
12
$93,377
80
$87,954
5
$13,120
8
$65,155
FILES CLOSED FOR INCOMPLETENESS
0
$0
2
$146,700
15
$82,979
0
$0
0
$0
Aggregated Statistics For Year 2002 (Based on 6 partial tracts)
A) FHA, FSA/RHS & VA Home Purchase Loans
B) Conventional Home Purchase Loans
C) Refinancings
D) Home Improvement Loans
F) Non-occupant Loans on < 5 Family Dwellings (A B C & D)
Number
Average Value
Number
Average Value
Number
Average Value
Number
Average Value
Number
Average Value
LOANS ORIGINATED
23
$91,870
118
$79,935
236
$95,022
23
$14,493
30
$56,282
APPLICATIONS APPROVED, NOT ACCEPTED
6
$77,190
39
$49,953
42
$65,171
4
$27,018
0
$0
APPLICATIONS DENIED
3
$107,457
128
$53,199
126
$69,027
21
$19,569
4
$28,712
APPLICATIONS WITHDRAWN
0
$0
14
$69,721
57
$93,848
11
$23,274
3
$36,663
FILES CLOSED FOR INCOMPLETENESS
2
$120,975
4
$95,218
19
$77,884
0
$0
4
$107,200
Aggregated Statistics For Year 2001 (Based on 6 partial tracts)
A) FHA, FSA/RHS & VA Home Purchase Loans
B) Conventional Home Purchase Loans
C) Refinancings
D) Home Improvement Loans
F) Non-occupant Loans on < 5 Family Dwellings (A B C & D)
Number
Average Value
Number
Average Value
Number
Average Value
Number
Average Value
Number
Average Value
LOANS ORIGINATED
17
$95,203
141
$73,686
220
$88,585
28
$21,624
17
$69,671
APPLICATIONS APPROVED, NOT ACCEPTED
0
$0
36
$45,586
26
$67,802
1
$28,010
1
$32,430
APPLICATIONS DENIED
2
$78,885
134
$51,537
118
$74,662
19
$23,594
14
$42,890
APPLICATIONS WITHDRAWN
2
$89,365
15
$74,277
62
$78,286
2
$31,205
2
$96,895
FILES CLOSED FOR INCOMPLETENESS
0
$0
3
$96,413
15
$79,207
0
$0
0
$0
Aggregated Statistics For Year 2000 (Based on 6 partial tracts)
A) FHA, FSA/RHS & VA Home Purchase Loans
B) Conventional Home Purchase Loans
C) Refinancings
D) Home Improvement Loans
F) Non-occupant Loans on < 5 Family Dwellings (A B C & D)
Number
Average Value
Number
Average Value
Number
Average Value
Number
Average Value
Number
Average Value
LOANS ORIGINATED
30
$89,027
166
$63,032
111
$72,653
32
$12,571
19
$44,864
APPLICATIONS APPROVED, NOT ACCEPTED
10
$28,528
50
$52,229
37
$65,676
11
$16,344
0
$0
APPLICATIONS DENIED
33
$42,988
188
$46,671
133
$67,820
21
$18,725
7
$64,069
APPLICATIONS WITHDRAWN
5
$53,986
17
$63,726
55
$61,021
2
$89,635
0
$0
FILES CLOSED FOR INCOMPLETENESS
1
$79,610
4
$78,828
16
$65,838
0
$0
0
$0
Aggregated Statistics For Year 1999 (Based on 3 partial tracts)
A) FHA, FSA/RHS & VA Home Purchase Loans
B) Conventional Home Purchase Loans
C) Refinancings
D) Home Improvement Loans
F) Non-occupant Loans on < 5 Family Dwellings (A B C & D)
2002 - 2018 National Fire Incident Reporting System (NFIRS) incidents
Based on the data from the years 2002 - 2018 the average number of fires per year is 57. The highest number of reported fires - 87 took place in 2005, and the least - 11 in 2003. The data has a growing trend.
When looking into fire subcategories, the most incidents belonged to: Structure Fires (50.2%), and Outside Fires (31.5%).
Fire incident types reported to NFIRS in Zip Code 27882

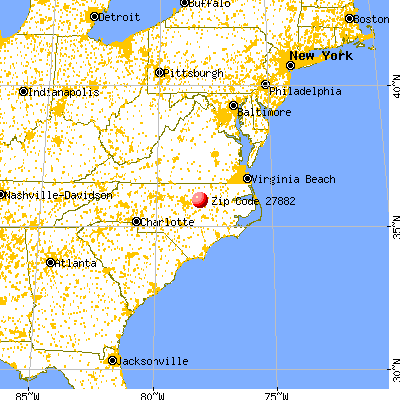


 Nearest zip codes: 27508, 27807, 27856, 27816, 27557, 27549.


 Based on the data from the years 2002 - 2018 the average number of fires per year is 57. The highest number of reported fires - 87 took place in 2005, and the least - 11 in 2003. The data has a growing trend.
 When looking into fire subcategories, the most incidents belonged to: Structure Fires (50.2%), and Outside Fires (31.5%).