Estimated zip code population in 2022: 1,417 Zip code population in 2010: 1,930 Zip code population in 2000: 1,660
Houses and condos: 1,006 Renter-occupied apartments: 223
% of renters here:
26%
State:
33%
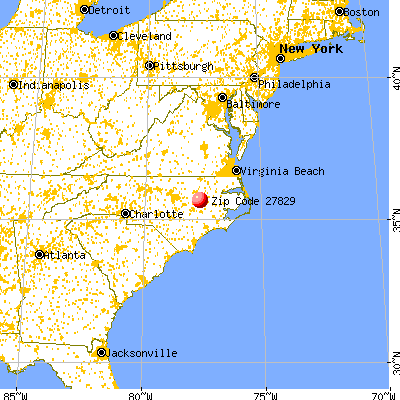
March 2022 cost of living index in zip code 27829: 77.9 (low, U.S. average is 100)
Land area: 49.2 sq. mi. Water area: 0.1 sq. mi.
Population density: 29 people per square mile
(very low).
OSM Map
General Map
Google Map
MSN Map
OSM Map
General Map
Google Map
MSN Map
OSM Map
General Map
Google Map
MSN Map
OSM Map
General Map
Google Map
MSN Map
Please wait while loading the map...
Real estate property taxes paid for housing units in 2022:
This zip code:
1.1% ($948)
North Carolina:
0.6% ($1,769)
Median real estate property taxes paid for housing units with mortgages in 2022: $1,359 (1.0%) Median real estate property taxes paid for housing units with no mortgage in 2022: $901 (1.3%)
Business Search- 14 Million verified businesses
Males: 608
(42.9%)
Females: 809
(57.1%)
For population 25 years and over in 27829:
High school or higher: 90.2%
Bachelor's degree or higher: 36.6%
Graduate or professional degree: 8.2%
Unemployed: 8.0%
Mean travel time to work (commute): 23.6 minutes
For population 15 years and over in 27829:
Never married: 19.0%
Now married: 46.5%
Separated: 1.5%
Widowed: 20.4%
Divorced: 12.6%
Zip code 27829 compared to state average:
Median house value significantly below state average.
Unemployed percentage above state average.
Hispanic race population percentage significantly below state average.
Median age significantly above state average.
Foreign-born population percentage significantly below state average.
Length of stay since moving in significantly above state average.
Estimated median house/condo value in 2022: $88,755
27829:
$88,755
North Carolina:
$280,600
According to our research of North Carolina and other state lists, there were 3 registered sex offenders living in 27829 zip code as of June 08, 2024. The ratio of all residents to sex offenders in zip code 27829 is 556 to 1. The ratio of registered sex offenders to all residents in this zip code is near the state average.
Median resident age:
This zip code:
62.1 years
North Carolina median age:
39.2 years
Average household size:
This zip code:
1.6 people
North Carolina:
2.4 people
Averages for the 2020 tax year for zip code 27829, filed in 2021:
Average Adjusted Gross Income (AGI) in 2020: $44,979 (Individual Income Tax Returns)
Here:
$44,979
State:
$70,020
Salary/wage: $43,288 (reported on 75.3% of returns)
Here:
$43,288
State:
$58,387
(% of AGI for various income ranges: 1020.0% for AGIs below $25k, 3817.3% for AGIs $25k-50k, 7650.0% for AGIs $50k-75k, 13330.0% for AGIs $75k-100k, 20884.0% for AGIs $100k-200k)
Taxable interest for individuals: $511 (reported on 23.4% of returns)
This zip code:
$511
North Carolina:
$1,479
(% of AGI for various income ranges: 11.2% for AGIs below $25k, 16.7% for AGIs $25k-50k, 18.0% for AGIs $50k-75k, 62.0% for AGIs $100k-200k)
Ordinary dividends: $2,600 (reported on 9.1% of returns)
Here:
$2,600
State:
$7,888
(% of AGI for various income ranges: 24.2% for AGIs below $25k, 38.7% for AGIs $25k-50k, 132.0% for AGIs $100k-200k)
Net capital gain/loss in AGI: +$3,833 (reported on 7.8% of returns)
Here:
+$3,833
State:
+$23,652
(% of AGI for various income ranges: 16.2% for AGIs below $25k, 3.3% for AGIs $25k-50k, 372.0% for AGIs $100k-200k)
Profit/loss from business: +$7,992 (reported on 15.6% of returns)
Here:
+$7,992
State:
+$11,710
(% of AGI for various income ranges: 213.8% for AGIs below $25k, 234.7% for AGIs $25k-50k, 470.0% for AGIs $75k-100k)
Taxable individual retirement arrangement distribution: $11,262 (reported on 10.4% of returns)
27829:
$11,262
North Carolina:
$20,247
(% of AGI for various income ranges: 144.6% for AGIs below $25k, 1108.0% for AGIs $50k-75k)
Total itemized deductions: $25,300 (reported on 3.9% of returns)
Here:
$25,300
State:
$34,549
(% of AGI for various income ranges: 1518.0% for AGIs $50k-75k)
Taxes paid: $7,350 (reported on 2.6% of returns)
27829:
$7,350
State:
$7,586
(% of AGI for various income ranges: 98.0% for AGIs $25k-50k)
Earned income credit: $2,753 (reported on 24.7% of returns)
Here:
$2,753
State:
$2,337
(% of AGI for various income ranges: 169.6% for AGIs below $25k, 77.3% for AGIs $25k-50k)
Percentage of individuals using paid preparers for their 2020 taxes: 90.9%
Here:
91%
State:
93%
(% for various income ranges: 91.2% for AGIs below $25k, 90.5% for AGIs $25k-50k, 88.9% for AGIs $50k-75k, 100.0% for AGIs $75k-100k, 88.9% for AGIs $100k-200k)
Averages for the 2012 tax year for zip code 27829, filed in 2013:
Average Adjusted Gross Income (AGI) in 2012: $40,435 (Individual Income Tax Returns)
Here:
$40,435
State:
$54,937
Salary/wage: $36,195 (reported on 82.7% of returns)
Here:
$36,195
State:
$46,336
(% of AGI for various income ranges: 68.6% for AGIs below $25k, 76.4% for AGIs $25k-50k, 79.0% for AGIs $50k-75k, 79.6% for AGIs $75k-100k, 65.2% for AGIs $100k-200k)
Taxable interest for individuals: $730 (reported on 26.7% of returns)
This zip code:
$730
North Carolina:
$1,298
(% of AGI for various income ranges: 0.9% for AGIs below $25k, 0.6% for AGIs $25k-50k, 0.3% for AGIs $50k-75k, 0.4% for AGIs $75k-100k, 0.3% for AGIs $100k-200k)
Ordinary dividends: $2,867 (reported on 8.0% of returns)
Here:
$2,867
State:
$6,213
Net capital gain/loss in AGI: +$657 (reported on 9.3% of returns)
Here:
+$657
State:
+$12,740
(% of AGI for various income ranges: 0.5% for AGIs below $25k, 0.4% for AGIs $25k-50k)
Profit/loss from business: +$6,854 (reported on 17.3% of returns)
Here:
+$6,854
State:
+$10,311
(% of AGI for various income ranges: 16.7% for AGIs below $25k, 1.1% for AGIs $50k-75k, 2.0% for AGIs $75k-100k)
Taxable individual retirement arrangement distribution: $9,860 (reported on 6.7% of returns)
27829:
$9,860
North Carolina:
$15,575
Total itemized deductions: $17,772 (23% of AGI, reported on 24.0% of returns)
Here:
$17,772
State:
$23,438
Here:
23.2% of AGI
State:
21.5% of AGI
(% of AGI for various income ranges: 11.5% for AGIs $25k-50k, 13.2% for AGIs $50k-75k, 10.1% for AGIs $75k-100k, 13.8% for AGIs $100k-200k)
Charity contributions: $4,400 (reported on 18.7% of returns)
Here:
$4,400
State:
$4,687
(% of AGI for various income ranges: 1.9% for AGIs $25k-50k, 2.4% for AGIs $50k-75k, 3.3% for AGIs $75k-100k, 2.3% for AGIs $100k-200k)
Taxes paid: $5,539 (reported on 24.0% of returns)
27829:
$5,539
State:
$8,823
(% of AGI for various income ranges: 2.0% for AGIs $25k-50k, 3.7% for AGIs $50k-75k, 3.1% for AGIs $75k-100k, 6.6% for AGIs $100k-200k)
Earned income credit: $2,535 (reported on 30.7% of returns)
Here:
$2,535
State:
$2,376
(% of AGI for various income ranges: 11.4% for AGIs below $25k, 1.3% for AGIs $25k-50k)
Percentage of individuals using paid preparers for their 2012 taxes: 62.7%
Here:
63%
State:
53%
(% for various income ranges: 58.8% for AGIs below $25k, 65.0% for AGIs $25k-50k, 66.7% for AGIs $50k-75k, 60.0% for AGIs $75k-100k, 75.0% for AGIs $100k-200k)
Averages for the 2004 tax year for zip code 27829, filed in 2005:
Average Adjusted Gross Income (AGI) in 2004: $32,794 (Individual Income Tax Returns)
Here:
$32,794
State:
$45,376
Salary/wage: $30,816 (reported on 85.5% of returns)
Here:
$30,816
State:
$39,442
(% of AGI for various income ranges: 80.5% for AGIs below $10k, 80.8% for AGIs $10k-25k, 86.7% for AGIs $25k-50k, 78.3% for AGIs $50k-75k, 79.3% for AGIs $75k-100k, 65.9% for AGIs over 100k)
Taxable interest for individuals: $1,158 (reported on 33.2% of returns)
This zip code:
$1,158
North Carolina:
$1,515
(% of AGI for various income ranges: 3.9% for AGIs below $10k, 1.9% for AGIs $10k-25k, 0.7% for AGIs $25k-50k, 1.4% for AGIs $50k-75k, 0.8% for AGIs $75k-100k, 0.5% for AGIs over 100k)
Taxable dividends: $2,188 (reported on 11.4% of returns)
Here:
$2,188
State:
$4,016
(% of AGI for various income ranges: 1.3% for AGIs below $10k, 0.3% for AGIs $10k-25k, 1.5% for AGIs $25k-50k, 0.1% for AGIs $50k-75k, 1.4% for AGIs $75k-100k)
Profit/loss from business: +$5,580 (reported on 14.2% of returns)
Here:
+$5,580
State:
+$9,490
(% of AGI for various income ranges: 5.3% for AGIs below $10k, 2.4% for AGIs $10k-25k, 2.2% for AGIs $25k-50k, 4.3% for AGIs $50k-75k)
IRA payment deduction: $2,722 (reported on 2.6% of returns)
27829:
$2,722
North Carolina:
$2,967
Total itemized deductions: $14,718 (26% of AGI, reported on 25.1% of returns)
Here:
$14,718
State:
$19,464
Here:
25.8% of AGI
State:
22.7% of AGI
(% of AGI for various income ranges: 11.2% for AGIs $10k-25k, 8.7% for AGIs $25k-50k, 11.9% for AGIs $50k-75k, 15.9% for AGIs $75k-100k, 14.7% for AGIs over 100k)
Charity contributions deductions: $3,562 (6% of AGI, reported on 22.7% of returns)
Here:
$3,562
State:
$4,035
Here:
6.0% of AGI
State:
4.5% of AGI
(% of AGI for various income ranges: 1.6% for AGIs $10k-25k, 1.7% for AGIs $25k-50k, 3.1% for AGIs $50k-75k, 2.5% for AGIs $75k-100k, 5.3% for AGIs over 100k)
Total tax: $3,824 (reported on 66.9% of returns)
27829:
$3,824
State:
$7,257
(% of AGI for various income ranges: 4.0% for AGIs below $10k, 3.0% for AGIs $10k-25k, 6.0% for AGIs $25k-50k, 9.1% for AGIs $50k-75k, 10.2% for AGIs $75k-100k, 15.7% for AGIs over 100k)
Earned income credit: $1,938 (reported on 27.6% of returns)
Here:
$1,938
State:
$1,851
Percentage of individuals using paid preparers for their 2004 taxes: 71.9%
Here:
72%
State:
62%
(% for various income ranges: 67.4% for AGIs below $10k, 79.0% for AGIs $10k-25k, 70.1% for AGIs $25k-50k, 70.1% for AGIs $50k-75k, 64.9% for AGIs $75k-100k, 66.7% for AGIs over 100k)
Household received Food Stamps/SNAP in the past 12 months: 152 Household did not receive Food Stamps/SNAP in the past 12 months: 716
Women who had a birth in the past 12 months: 10 (5 now married, 4 unmarried) Women who did not have a birth in the past 12 months: 180 (48 now married, 131 unmarried)
Housing units in zip code 27829 with a mortgage: 153 (8 second mortgage, 3 both second mortgage and home equity loan) Median monthly owner costs for units with a mortgage: $1,158 Median monthly owner costs for units without a mortgage: $454
Residents with income below the poverty level in 2022:
This zip code:
16.1%
Whole state:
12.8%
Residents with income below 50% of the poverty level in 2022:
This zip code:
10.7%
Whole state:
6.8%
Median number of rooms in houses and condos:
Here:
5.2
State:
6.4
Median number of rooms in apartments:
Here:
4.7
State:
4.4
Notable locations in this zip code not listed on our city pages
Notable locations in zip code 27829: Town Hall Fire Department (A), Fountain Police Department (B), Fountain Community Police Department (C). Display/hide their locations on the map
Churches in zip code 27829 include: Dildys Chapel (A), Dildas Grove Church (B), Seven Holly Church (C), Saint Peters Church (D), Otter Creek Church (E), Aspen Grove Church (F), Reid Chapel (G), Saint James Church (H). Display/hide their locations on the map
In group quarters: 4 (-1 institutionalized population)
Size of family households: 334 2-persons, 45 3-persons, 10 4-persons, 18 5-persons, 5 6-persons
Size of nonfamily households: 434 1-person, 19 2-persons
28 married couples with children.
66 single-parent households (5 men, 61 women).
All residents speak English at home
Foreign born population: 0 (0.0%)
:
0.0%
Whole state:
8.6%
21%English
19%American
4%Scotch-Irish
4%Scottish
3%European
2%Irish
1%German
Facilities with environmental interests located in this zip code:
BARRUS CONST INACTIVE (HIGHWAY 258 SOUTH in FOUNTAIN, NC)
AIR MINOR (AIRS/AFS) STATE MASTER (North Carolina facility info) - AIR PROGRAM Business SIC classification: WOOD OFFICE AND STORE FIXTURES, PARTITIONS, SHELVING, AND LOCKERS Alternative names: BARRUS CONSTRUCTION FOUNTAIN, BARRUS CONSTRUCTION FOUNTAIN **INACTIVE*
Housing units lacking complete plumbing facilities: 3.5% Housing units lacking complete kitchen facilities: 1.8%
65.5%Electricity
26.8%Bottled, tank, or LP gas
6.8%Utility gas
1.1%Fuel oil, kerosene, etc.
Population in 1990: 1,419. Population change in the 1990s: +241 (+17.0%).
Place of birth for U.S.-born residents:
This state: 1,134
Northeast: 99
Midwest: 45
South: 94
West: 23
75% of the 27829 zip code residents lived in the same house 5 years ago. Out of people who lived in different houses, 65% lived in this county. Out of people who lived in different counties, 50% lived in North Carolina.
89% of the 27829 zip code residents lived in the same house 1 year ago. Out of people who lived in different houses, 35% moved from this county. Out of people who lived in different houses, 19% moved from different county within same state. Out of people who lived in different houses, 47% moved from different state.
Private vs. public school enrollment:
Students in private schools in grades 1 to 8 (elementary and middle school): 11
Here:
32.1%
North Carolina:
13.8%
Students in private schools in grades 9 to 12 (high school): 9
Here:
19.8%
North Carolina:
11.9%
Students in private undergraduate colleges:
Here:
0.0%
North Carolina:
19.3%
Occupation by median earnings in the past 12 months ($)
113,444Health diagnosing and treating practitioners and other technical occupations
68,339Education, training, and library occupations
60,784Installation, maintenance, and repair occupations
38,296Health technologists and technicians
35,921Office and administrative support occupations
35,720Management occupations
Top industries in this zip code by the number of employees in 2005:
Health Care and Social Assistance: Child Day Care Services (20-49 employees: 1 establishment)
Mining: Crushed and Broken Granite Mining and Quarrying (20-49: 1)
Health Care and Social Assistance: Ambulance Services (10-19: 1)
Construction: Siding Contractors (5-9: 1)
Construction: Plumbing, Heating, and Air-Conditioning Contractors (5-9: 1)
Other Services (except Public Administration): Religious Organizations (1-4: 3)
Finance and Insurance: Commercial Banking (1-4: 2)
Accommodation and Food Services: Full-Service Restaurants (1-4: 2)
Fatal accident statistics in 2013:
Fatal accident count: 1
Vehicles involved in fatal accidents: 1
Fatal accidents caused by drunken drivers: 0
Fatalities: 1
Persons involved in fatal accidents: 1
Pedestrians involved in fatal accidents: 0
Home Mortgage Disclosure Act Aggregated Statistics For Year 2009 (Based on 4 partial tracts)
A) FHA, FSA/RHS & VA Home Purchase Loans
B) Conventional Home Purchase Loans
C) Refinancings
D) Home Improvement Loans
F) Non-occupant Loans on < 5 Family Dwellings (A B C & D)
G) Loans On Manufactured Home Dwelling (A B C & D)
Number
Average Value
Number
Average Value
Number
Average Value
Number
Average Value
Number
Average Value
Number
Average Value
LOANS ORIGINATED
5
$79,054
9
$114,901
33
$132,237
2
$59,275
4
$120,930
6
$74,070
APPLICATIONS APPROVED, NOT ACCEPTED
0
$0
1
$31,970
2
$70,640
0
$0
0
$0
1
$31,970
APPLICATIONS DENIED
4
$95,520
1
$24,450
17
$95,541
3
$27,083
1
$169,830
8
$71,212
APPLICATIONS WITHDRAWN
1
$37,960
1
$125,730
6
$107,263
0
$0
0
$0
2
$59,385
FILES CLOSED FOR INCOMPLETENESS
1
$152,510
0
$0
1
$79,920
1
$78,990
0
$0
0
$0
Aggregated Statistics For Year 2008 (Based on 4 partial tracts)
A) FHA, FSA/RHS & VA Home Purchase Loans
B) Conventional Home Purchase Loans
C) Refinancings
D) Home Improvement Loans
F) Non-occupant Loans on < 5 Family Dwellings (A B C & D)
G) Loans On Manufactured Home Dwelling (A B C & D)
Number
Average Value
Number
Average Value
Number
Average Value
Number
Average Value
Number
Average Value
Number
Average Value
LOANS ORIGINATED
5
$100,548
15
$109,498
25
$113,882
2
$74,055
9
$80,442
13
$62,577
APPLICATIONS APPROVED, NOT ACCEPTED
1
$97,240
1
$58,600
4
$118,178
0
$0
0
$0
1
$58,600
APPLICATIONS DENIED
2
$108,485
5
$76,796
20
$82,962
6
$49,170
2
$49,405
10
$59,255
APPLICATIONS WITHDRAWN
2
$88,580
1
$94,370
6
$115,612
1
$72,220
0
$0
2
$93,700
FILES CLOSED FOR INCOMPLETENESS
0
$0
1
$247,430
2
$75,940
0
$0
0
$0
1
$65,090
Aggregated Statistics For Year 2007 (Based on 4 partial tracts)
A) FHA, FSA/RHS & VA Home Purchase Loans
B) Conventional Home Purchase Loans
C) Refinancings
D) Home Improvement Loans
F) Non-occupant Loans on < 5 Family Dwellings (A B C & D)
G) Loans On Manufactured Home Dwelling (A B C & D)
Number
Average Value
Number
Average Value
Number
Average Value
Number
Average Value
Number
Average Value
Number
Average Value
LOANS ORIGINATED
4
$106,028
16
$119,042
27
$103,072
3
$43,540
6
$82,550
13
$56,458
APPLICATIONS APPROVED, NOT ACCEPTED
0
$0
3
$57,587
8
$92,268
1
$60,180
1
$166,540
2
$50,865
APPLICATIONS DENIED
1
$35,470
7
$51,240
28
$112,215
9
$46,829
1
$269,820
11
$57,992
APPLICATIONS WITHDRAWN
1
$133,200
2
$75,205
11
$99,585
1
$55,940
0
$0
3
$41,380
FILES CLOSED FOR INCOMPLETENESS
0
$0
1
$307,690
1
$205,660
0
$0
0
$0
0
$0
Aggregated Statistics For Year 2006 (Based on 4 partial tracts)
A) FHA, FSA/RHS & VA Home Purchase Loans
B) Conventional Home Purchase Loans
C) Refinancings
D) Home Improvement Loans
E) Loans on Dwellings For 5+ Families
F) Non-occupant Loans on < 5 Family Dwellings (A B C & D)
G) Loans On Manufactured Home Dwelling (A B C & D)
Number
Average Value
Number
Average Value
Number
Average Value
Number
Average Value
Number
Average Value
Number
Average Value
Number
Average Value
LOANS ORIGINATED
3
$74,370
21
$106,420
38
$92,691
7
$43,039
1
$2,630,700
4
$64,075
8
$62,536
APPLICATIONS APPROVED, NOT ACCEPTED
0
$0
4
$123,278
7
$116,086
0
$0
0
$0
1
$85,250
2
$47,045
APPLICATIONS DENIED
1
$51,280
9
$46,256
26
$74,144
11
$50,682
0
$0
1
$56,370
11
$54,309
APPLICATIONS WITHDRAWN
0
$0
2
$116,560
11
$77,545
1
$141,640
0
$0
1
$42,620
1
$55,460
FILES CLOSED FOR INCOMPLETENESS
0
$0
0
$0
6
$101,155
0
$0
0
$0
0
$0
0
$0
Aggregated Statistics For Year 2005 (Based on 4 partial tracts)
A) FHA, FSA/RHS & VA Home Purchase Loans
B) Conventional Home Purchase Loans
C) Refinancings
D) Home Improvement Loans
F) Non-occupant Loans on < 5 Family Dwellings (A B C & D)
G) Loans On Manufactured Home Dwelling (A B C & D)
Number
Average Value
Number
Average Value
Number
Average Value
Number
Average Value
Number
Average Value
Number
Average Value
LOANS ORIGINATED
4
$82,250
24
$82,009
28
$77,094
3
$57,060
3
$43,323
11
$70,003
APPLICATIONS APPROVED, NOT ACCEPTED
1
$51,280
2
$38,960
4
$84,128
0
$0
1
$41,960
2
$38,960
APPLICATIONS DENIED
0
$0
6
$62,148
36
$84,588
8
$53,936
3
$80,143
11
$62,464
APPLICATIONS WITHDRAWN
1
$49,280
3
$86,530
12
$129,221
1
$98,160
0
$0
3
$65,263
FILES CLOSED FOR INCOMPLETENESS
0
$0
1
$86,890
5
$121,940
0
$0
1
$70,600
0
$0
Aggregated Statistics For Year 2004 (Based on 4 partial tracts)
A) FHA, FSA/RHS & VA Home Purchase Loans
B) Conventional Home Purchase Loans
C) Refinancings
D) Home Improvement Loans
F) Non-occupant Loans on < 5 Family Dwellings (A B C & D)
G) Loans On Manufactured Home Dwelling (A B C & D)
Number
Average Value
Number
Average Value
Number
Average Value
Number
Average Value
Number
Average Value
Number
Average Value
LOANS ORIGINATED
3
$99,240
29
$92,729
29
$100,896
3
$40,553
7
$71,200
9
$57,334
APPLICATIONS APPROVED, NOT ACCEPTED
0
$0
5
$53,288
8
$86,181
1
$102,380
0
$0
5
$54,946
APPLICATIONS DENIED
1
$56,830
15
$62,263
29
$87,382
11
$76,517
3
$51,947
19
$54,888
APPLICATIONS WITHDRAWN
0
$0
7
$99,176
16
$84,034
2
$16,495
1
$50,620
2
$71,840
FILES CLOSED FOR INCOMPLETENESS
0
$0
1
$57,940
3
$112,053
0
$0
0
$0
1
$44,620
Aggregated Statistics For Year 2003 (Based on 4 partial tracts)
A) FHA, FSA/RHS & VA Home Purchase Loans
B) Conventional Home Purchase Loans
C) Refinancings
D) Home Improvement Loans
F) Non-occupant Loans on < 5 Family Dwellings (A B C & D)
Number
Average Value
Number
Average Value
Number
Average Value
Number
Average Value
Number
Average Value
LOANS ORIGINATED
4
$80,585
27
$78,374
70
$86,536
7
$18,096
7
$45,670
APPLICATIONS APPROVED, NOT ACCEPTED
0
$0
3
$53,290
11
$85,582
1
$61,910
0
$0
APPLICATIONS DENIED
1
$122,540
6
$77,608
33
$76,117
1
$7,990
1
$13,320
APPLICATIONS WITHDRAWN
0
$0
3
$69,243
18
$75,436
1
$11,320
1
$79,920
FILES CLOSED FOR INCOMPLETENESS
0
$0
1
$47,950
2
$113,185
0
$0
0
$0
Aggregated Statistics For Year 2002 (Based on 4 partial tracts)
A) FHA, FSA/RHS & VA Home Purchase Loans
B) Conventional Home Purchase Loans
C) Refinancings
D) Home Improvement Loans
F) Non-occupant Loans on < 5 Family Dwellings (A B C & D)
Number
Average Value
Number
Average Value
Number
Average Value
Number
Average Value
Number
Average Value
LOANS ORIGINATED
3
$103,230
21
$85,025
45
$95,555
3
$19,803
3
$45,530
APPLICATIONS APPROVED, NOT ACCEPTED
0
$0
6
$64,092
7
$61,611
1
$16,650
0
$0
APPLICATIONS DENIED
1
$69,260
20
$41,744
24
$71,203
4
$16,728
0
$0
APPLICATIONS WITHDRAWN
0
$0
4
$78,902
10
$71,563
0
$0
1
$40,630
FILES CLOSED FOR INCOMPLETENESS
0
$0
0
$0
1
$47,950
0
$0
0
$0
Aggregated Statistics For Year 2001 (Based on 4 partial tracts)
A) FHA, FSA/RHS & VA Home Purchase Loans
B) Conventional Home Purchase Loans
C) Refinancings
D) Home Improvement Loans
F) Non-occupant Loans on < 5 Family Dwellings (A B C & D)
Number
Average Value
Number
Average Value
Number
Average Value
Number
Average Value
Number
Average Value
LOANS ORIGINATED
3
$70,157
21
$58,430
32
$73,413
2
$17,360
7
$40,227
APPLICATIONS APPROVED, NOT ACCEPTED
0
$0
11
$54,355
9
$45,129
1
$41,540
2
$109,225
APPLICATIONS DENIED
0
$0
33
$37,115
22
$58,824
5
$26,594
1
$43,310
APPLICATIONS WITHDRAWN
0
$0
4
$37,915
5
$58,754
1
$12,050
1
$44,620
FILES CLOSED FOR INCOMPLETENESS
0
$0
1
$221,780
2
$73,845
0
$0
0
$0
Aggregated Statistics For Year 2000 (Based on 4 partial tracts)
A) FHA, FSA/RHS & VA Home Purchase Loans
B) Conventional Home Purchase Loans
C) Refinancings
D) Home Improvement Loans
F) Non-occupant Loans on < 5 Family Dwellings (A B C & D)
Number
Average Value
Number
Average Value
Number
Average Value
Number
Average Value
Number
Average Value
LOANS ORIGINATED
3
$53,207
21
$48,547
13
$57,791
6
$11,130
4
$23,612
APPLICATIONS APPROVED, NOT ACCEPTED
5
$37,156
8
$36,272
6
$84,343
0
$0
1
$27,310
APPLICATIONS DENIED
3
$36,963
24
$40,057
16
$47,284
1
$45,680
3
$44,987
APPLICATIONS WITHDRAWN
0
$0
1
$31,000
7
$60,409
1
$2,660
0
$0
FILES CLOSED FOR INCOMPLETENESS
0
$0
1
$115,760
2
$80,605
0
$0
0
$0
Aggregated Statistics For Year 1999 (Based on 2 partial tracts)
A) FHA, FSA/RHS & VA Home Purchase Loans
B) Conventional Home Purchase Loans
C) Refinancings
D) Home Improvement Loans
F) Non-occupant Loans on < 5 Family Dwellings (A B C & D)
Detailed PMIC statistics for the following Tracts:0019.00
, 0216.00
2003 - 2018 National Fire Incident Reporting System (NFIRS) incidents
Based on the data from the years 2003 - 2018 the average number of fires per year is 12. The highest number of fires - 29 took place in 2014, and the least - 2 in 2007. The data has a growing trend.
When looking into fire subcategories, the most incidents belonged to: Structure Fires (50.3%), and Outside Fires (31.8%).
Fire incident types reported to NFIRS in Zip Code 27829


 Nearest zip codes: 27852, 27828, 27827, 27864, 27888, 27873.


 Based on the data from the years 2003 - 2018 the average number of fires per year is 12. The highest number of fires - 29 took place in 2014, and the least - 2 in 2007. The data has a growing trend.
 When looking into fire subcategories, the most incidents belonged to: Structure Fires (50.3%), and Outside Fires (31.8%).