Estimated zip code population in 2022: 4,622 Zip code population in 2010: 4,779 Zip code population in 2000: 4,218
Houses and condos: 2,286 Renter-occupied apartments: 692
% of renters here:
35%
State:
33%
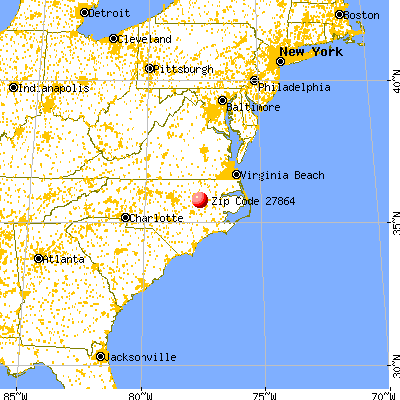
March 2022 cost of living index in zip code 27864: 79.1 (low, U.S. average is 100)
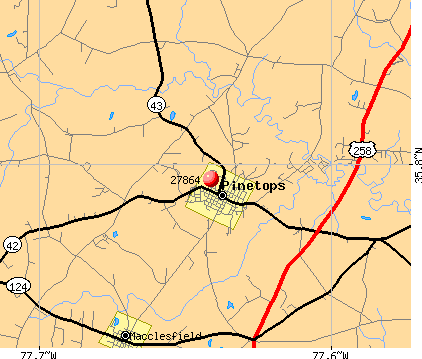
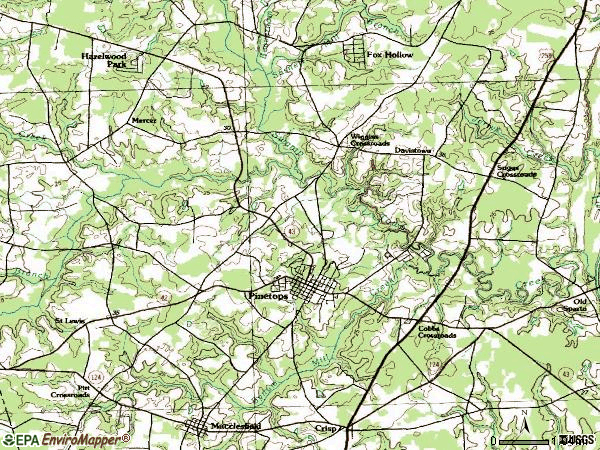
Land area: 40.4 sq. mi. Water area: 0.0 sq. mi.
Population density: 114 people per square mile
(very low).
OSM Map
General Map
Google Map
MSN Map
OSM Map
General Map
Google Map
MSN Map
OSM Map
General Map
Google Map
MSN Map
OSM Map
General Map
Google Map
MSN Map
Please wait while loading the map...
Real estate property taxes paid for housing units in 2022:
This zip code:
0.8% ($1,078)
North Carolina:
0.6% ($1,769)
Median real estate property taxes paid for housing units with mortgages in 2022: $1,173 (0.8%) Median real estate property taxes paid for housing units with no mortgage in 2022: $1,012 (0.9%)
Averages for the 2020 tax year for zip code 27864, filed in 2021:
Average Adjusted Gross Income (AGI) in 2020: $40,606 (Individual Income Tax Returns)
Here:
$40,606
State:
$70,020
Salary/wage: $36,284 (reported on 84.8% of returns)
Here:
$36,284
State:
$58,387
(% of AGI for various income ranges: 1354.5% for AGIs below $25k, 4030.7% for AGIs $25k-50k, 8013.3% for AGIs $50k-75k, 10651.2% for AGIs $75k-100k, 19174.3% for AGIs $100k-200k)
Taxable interest for individuals: $630 (reported on 19.6% of returns)
This zip code:
$630
North Carolina:
$1,479
(% of AGI for various income ranges: 5.2% for AGIs below $25k, 4.5% for AGIs $25k-50k, 18.3% for AGIs $50k-75k, 8.8% for AGIs $75k-100k, 227.1% for AGIs $100k-200k)
Ordinary dividends: $4,189 (reported on 8.8% of returns)
Here:
$4,189
State:
$7,888
(% of AGI for various income ranges: 4.8% for AGIs below $25k, 6.6% for AGIs $25k-50k, 148.3% for AGIs $50k-75k, 610.0% for AGIs $100k-200k)
Net capital gain/loss in AGI: +$5,487 (reported on 7.4% of returns)
Here:
+$5,487
State:
+$23,652
(% of AGI for various income ranges: 7.8% for AGIs below $25k, 41.1% for AGIs $50k-75k, 998.6% for AGIs $100k-200k)
Profit/loss from business: +$3,318 (reported on 13.7% of returns)
Here:
+$3,318
State:
+$11,710
(% of AGI for various income ranges: 44.1% for AGIs below $25k, 68.6% for AGIs $25k-50k, 58.3% for AGIs $50k-75k, 342.9% for AGIs $100k-200k)
Taxable individual retirement arrangement distribution: $12,456 (reported on 7.8% of returns)
27864:
$12,456
North Carolina:
$20,247
(% of AGI for various income ranges: 48.1% for AGIs below $25k, 52.7% for AGIs $25k-50k, 377.8% for AGIs $50k-75k, 1104.3% for AGIs $100k-200k)
Total itemized deductions: $29,500 (reported on 2.9% of returns)
Here:
$29,500
State:
$34,549
(% of AGI for various income ranges: 216.1% for AGIs $25k-50k, 1170.0% for AGIs $100k-200k)
Charity contributions: $10,360 (reported on 2.5% of returns)
Here:
$10,360
State:
$13,360
(% of AGI for various income ranges: 35.9% for AGIs $25k-50k, 514.3% for AGIs $100k-200k)
Taxes paid: $6,467 (reported on 2.9% of returns)
27864:
$6,467
State:
$7,586
(% of AGI for various income ranges: 38.2% for AGIs $25k-50k, 314.3% for AGIs $100k-200k)
Earned income credit: $2,688 (reported on 27.9% of returns)
Here:
$2,688
State:
$2,337
(% of AGI for various income ranges: 164.4% for AGIs below $25k, 109.1% for AGIs $25k-50k)
Percentage of individuals using paid preparers for their 2020 taxes: 91.7%
Here:
92%
State:
93%
(% for various income ranges: 90.1% for AGIs below $25k, 93.1% for AGIs $25k-50k, 92.9% for AGIs $50k-75k, 91.7% for AGIs $75k-100k, 93.3% for AGIs $100k-200k)
Averages for the 2012 tax year for zip code 27864, filed in 2013:
Average Adjusted Gross Income (AGI) in 2012: $34,858 (Individual Income Tax Returns)
Here:
$34,858
State:
$54,937
Salary/wage: $30,167 (reported on 86.4% of returns)
Here:
$30,167
State:
$46,336
(% of AGI for various income ranges: 80.0% for AGIs below $25k, 85.3% for AGIs $25k-50k, 78.3% for AGIs $50k-75k, 73.9% for AGIs $75k-100k, 56.2% for AGIs $100k-200k)
Taxable interest for individuals: $728 (reported on 20.2% of returns)
This zip code:
$728
North Carolina:
$1,298
(% of AGI for various income ranges: 0.6% for AGIs below $25k, 0.3% for AGIs $25k-50k, 0.4% for AGIs $50k-75k, 0.3% for AGIs $75k-100k, 0.5% for AGIs $100k-200k)
Ordinary dividends: $3,500 (reported on 8.0% of returns)
Here:
$3,500
State:
$6,213
(% of AGI for various income ranges: 0.4% for AGIs below $25k, 0.3% for AGIs $25k-50k, 0.8% for AGIs $50k-75k, 0.8% for AGIs $75k-100k, 1.7% for AGIs $100k-200k)
Net capital gain/loss in AGI: +$2,981 (reported on 7.5% of returns)
Here:
+$2,981
State:
+$12,740
(% of AGI for various income ranges: 0.3% for AGIs below $25k, 0.5% for AGIs $25k-50k, 1.2% for AGIs $50k-75k, 0.3% for AGIs $75k-100k, 0.8% for AGIs $100k-200k)
Profit/loss from business: +$4,961 (reported on 13.1% of returns)
Here:
+$4,961
State:
+$10,311
(% of AGI for various income ranges: 5.8% for AGIs below $25k, 1.1% for AGIs $25k-50k, 2.9% for AGIs $75k-100k)
Taxable individual retirement arrangement distribution: $12,267 (reported on 7.0% of returns)
27864:
$12,267
North Carolina:
$15,575
(% of AGI for various income ranges: 2.3% for AGIs below $25k, 0.9% for AGIs $25k-50k, 4.4% for AGIs $50k-75k, 4.4% for AGIs $100k-200k)
Total itemized deductions: $19,328 (24% of AGI, reported on 16.9% of returns)
Here:
$19,328
State:
$23,438
Here:
23.9% of AGI
State:
21.5% of AGI
(% of AGI for various income ranges: 5.3% for AGIs below $25k, 7.1% for AGIs $25k-50k, 10.2% for AGIs $50k-75k, 10.6% for AGIs $75k-100k, 14.3% for AGIs $100k-200k)
Charity contributions: $4,817 (reported on 13.6% of returns)
Here:
$4,817
State:
$4,687
(% of AGI for various income ranges: 0.5% for AGIs below $25k, 1.3% for AGIs $25k-50k, 2.5% for AGIs $50k-75k, 2.1% for AGIs $75k-100k, 3.3% for AGIs $100k-200k)
Taxes paid: $5,803 (reported on 16.9% of returns)
27864:
$5,803
State:
$8,823
(% of AGI for various income ranges: 0.5% for AGIs below $25k, 1.6% for AGIs $25k-50k, 2.7% for AGIs $50k-75k, 3.5% for AGIs $75k-100k, 5.9% for AGIs $100k-200k)
Earned income credit: $2,679 (reported on 36.2% of returns)
Here:
$2,679
State:
$2,376
(% of AGI for various income ranges: 11.3% for AGIs below $25k, 1.6% for AGIs $25k-50k)
Percentage of individuals using paid preparers for their 2012 taxes: 57.3%
Here:
57%
State:
53%
(% for various income ranges: 56.9% for AGIs below $25k, 52.7% for AGIs $25k-50k, 61.9% for AGIs $50k-75k, 63.6% for AGIs $75k-100k, 70.0% for AGIs $100k-200k)
Averages for the 2004 tax year for zip code 27864, filed in 2005:
Average Adjusted Gross Income (AGI) in 2004: $30,075 (Individual Income Tax Returns)
Here:
$30,075
State:
$45,376
Salary/wage: $27,223 (reported on 90.2% of returns)
Here:
$27,223
State:
$39,442
(% of AGI for various income ranges: 100.2% for AGIs below $10k, 88.0% for AGIs $10k-25k, 88.0% for AGIs $25k-50k, 82.3% for AGIs $50k-75k, 85.0% for AGIs $75k-100k, 53.1% for AGIs over 100k)
Taxable interest for individuals: $934 (reported on 24.0% of returns)
This zip code:
$934
North Carolina:
$1,515
(% of AGI for various income ranges: 2.5% for AGIs below $10k, 0.8% for AGIs $10k-25k, 0.5% for AGIs $25k-50k, 0.7% for AGIs $50k-75k, 0.2% for AGIs $75k-100k, 1.1% for AGIs over 100k)
Taxable dividends: $2,284 (reported on 10.8% of returns)
Here:
$2,284
State:
$4,016
(% of AGI for various income ranges: 1.1% for AGIs below $10k, 0.4% for AGIs $10k-25k, 0.8% for AGIs $25k-50k, 1.3% for AGIs $50k-75k, 0.5% for AGIs $75k-100k, 0.9% for AGIs over 100k)
Net capital gain/loss: +$2,686 (reported on 6.0% of returns)
Here:
+$2,686
State:
+$11,152
(% of AGI for various income ranges: -0.0% for AGIs below $10k, -0.1% for AGIs $10k-25k, -0.1% for AGIs $25k-50k, 0.2% for AGIs $50k-75k, -0.1% for AGIs $75k-100k, 3.6% for AGIs over 100k)
Profit/loss from business: +$3,401 (reported on 10.5% of returns)
Here:
+$3,401
State:
+$9,490
(% of AGI for various income ranges: 9.8% for AGIs below $10k, 1.9% for AGIs $10k-25k, 0.6% for AGIs $25k-50k, 0.7% for AGIs $50k-75k, 1.2% for AGIs $75k-100k)
IRA payment deduction: $2,115 (reported on 1.3% of returns)
27864:
$2,115
North Carolina:
$2,967
Total itemized deductions: $15,348 (24% of AGI, reported on 19.4% of returns)
Here:
$15,348
State:
$19,464
Here:
23.8% of AGI
State:
22.7% of AGI
(% of AGI for various income ranges: 9.3% for AGIs below $10k, 4.5% for AGIs $10k-25k, 9.4% for AGIs $25k-50k, 10.7% for AGIs $50k-75k, 14.7% for AGIs $75k-100k, 14.3% for AGIs over 100k)
Charity contributions deductions: $3,584 (5% of AGI, reported on 17.2% of returns)
Here:
$3,584
State:
$4,035
Here:
5.3% of AGI
State:
4.5% of AGI
(% of AGI for various income ranges: 0.6% for AGIs below $10k, 0.8% for AGIs $10k-25k, 1.6% for AGIs $25k-50k, 2.4% for AGIs $50k-75k, 3.0% for AGIs $75k-100k, 3.7% for AGIs over 100k)
Total tax: $3,906 (reported on 59.6% of returns)
27864:
$3,906
State:
$7,257
(% of AGI for various income ranges: 3.0% for AGIs below $10k, 2.4% for AGIs $10k-25k, 5.8% for AGIs $25k-50k, 8.4% for AGIs $50k-75k, 10.6% for AGIs $75k-100k, 17.3% for AGIs over 100k)
Earned income credit: $2,038 (reported on 37.0% of returns)
Here:
$2,038
State:
$1,851
Percentage of individuals using paid preparers for their 2004 taxes: 66.7%
Here:
67%
State:
62%
(% for various income ranges: 64.5% for AGIs below $10k, 69.5% for AGIs $10k-25k, 63.7% for AGIs $25k-50k, 66.5% for AGIs $50k-75k, 70.7% for AGIs $75k-100k, 68.0% for AGIs over 100k)
Household received Food Stamps/SNAP in the past 12 months: 388 Household did not receive Food Stamps/SNAP in the past 12 months: 1,586
Women who had a birth in the past 12 months: 109 (69 now married, 39 unmarried) Women who did not have a birth in the past 12 months: 884 (304 now married, 578 unmarried)
Housing units in zip code 27864 with a mortgage: 605 (26 second mortgage, 5 home equity loan, 20 both second mortgage and home equity loan) Houses without a mortgage: 43
Median monthly owner costs for units with a mortgage: $1,083 Median monthly owner costs for units without a mortgage: $514
Residents with income below the poverty level in 2022:
This zip code:
14.0%
Whole state:
12.8%
Residents with income below 50% of the poverty level in 2022:
This zip code:
4.8%
Whole state:
6.8%
Median number of rooms in houses and condos:
Here:
6.1
State:
6.4
Median number of rooms in apartments:
Here:
5.2
State:
4.4
Notable locations in this zip code not listed on our city pages
Churches in zip code 27864 include: Lower Town Creek Church (A), Eagles Church (B), Faith Church (C), Bethlehem Church (D), Morning Star Church (E), Mount Zion Church (F), Grace Chapel (G). Display/hide their locations on the map
Size of family households: 701 2-persons, 297 3-persons, 233 4-persons, 85 5-persons, 41 6-persons
Size of nonfamily households: 534 1-person, 55 2-persons, 11 3-persons
495 married couples with children.
262 single-parent households (27 men, 235 women).
96.8% of residents of 27864 zip code speak English at home.
2.5% of residents speak Spanish at home (76% very well, 13% not well, 11% not at all).
0.3% of residents speak Asian or Pacific Island language at home (100% very well).
Foreign born population: 48 (1.0%) (32.0% of them are naturalized citizens)
This zip code:
1.0%
Whole state:
8.6%
42%El Salvador
40%Honduras
21%Togo
24%American
6%Irish
4%English
2%German
1%Scotch-Irish
1%Italian
1%Scottish
Year of entry for the foreign-born population
132010 or later
162000 to 2009
111990 to 1999
6Before 1990
Facilities with environmental interests located in this zip code:
ABB POWER T&D COMPANY INCORPORATED (HWY. 43 N. in PINETOPS, NC)
STATE MASTER (North Carolina facility info) - -115DA4YG00M29W84AX3X05HMXJ, WASTEWATER FACILITY National Pollutant Discharge Elimination System NON-MAJOR (Tracking pollutant discharge elimination systems) - permit Conditionally Exempt Small Quantity Generators, less than 100 kg/month of hazardous waste (Resource Conservation and Recovery Act (tracking hazardous waste)) - notification TRI REPORTER (Tracking of toxic chemicals releasing facilities) Business SIC classification: POWER, DISTRIBUTION, AND SPECIALTY TRANSFORMERS Organizations: ABB INC (CONTACT/OWNER)
Alternative names: ABB INC., ABB POWER T&D CO INC-EDGECOMBE
CITY OF WILSON, PINETOPS GENSET (VAN STREET in PINETOPS, NC)
AIR MINOR (AIRS/AFS) STATE MASTER (North Carolina facility info) - AIR PROGRAM CRITERIA AND HAZARDOUS AIR POLLUTANT INVENTORY (Inventory of air pollution sources) Business SIC classification: ELECTRIC SERVICES Business NAICS classification: FOSSIL FUEL ELECTRIC POWER GENERATION.; FOSSIL FUEL ELECTRIC POWER GENERATION.
Housing units lacking complete plumbing facilities: 3.8% Housing units lacking complete kitchen facilities: 2.3%
61.0%Electricity
26.9%Bottled, tank, or LP gas
6.7%Utility gas
4.6%Fuel oil, kerosene, etc.
1.0%No fuel used
Population in 1990: 5,935.
Place of birth for U.S.-born residents:
This state: 3,942
Northeast: 226
Midwest: 46
South: 228
West: 54
63% of the 27864 zip code residents lived in the same house 5 years ago. Out of people who lived in different houses, 72% lived in this county. Out of people who lived in different counties, 50% lived in North Carolina.
97% of the 27864 zip code residents lived in the same house 1 year ago. Out of people who lived in different houses, 66% moved from this county. Out of people who lived in different houses, 34% moved from different county within same state. Out of people who lived in different houses, 23% moved from different state.
Private vs. public school enrollment:
Students in private schools in grades 1 to 8 (elementary and middle school): 15
Here:
4.1%
North Carolina:
13.8%
Students in private schools in grades 9 to 12 (high school):
Here:
0.0%
North Carolina:
11.9%
Students in private undergraduate colleges: 27
Here:
16.5%
North Carolina:
19.3%
Occupation by median earnings in the past 12 months ($)
86,082Computer and mathematical occupations
80,365Health diagnosing and treating practitioners and other technical occupations
64,567Material moving occupations
60,826Installation, maintenance, and repair occupations
55,139Office and administrative support occupations
51,775Management occupations
Companies with federal contracts located in this zip code:
COTTON BELT INC (401 E SATER ST in PINETOPS, NC; small business)
$6,490 with Navy for Household Furniture. Taking place in FL. Signed on 2005-04-12. Completion date: 2005-05-06.
Top industries in this zip code by the number of employees in 2005:
Accommodation and Food Services: Limited-Service Restaurants (20-49 employees: 1 establishment)
Health Care and Social Assistance: Home Health Care Services (20-49: 1)
Other Services (except Public Administration): Religious Organizations (10-19: 1, 5-9: 1, 1-4: 2)
Management of Companies and Enterprises: Corporate, Subsidiary, and Regional Managing Offices (10-19: 1)
Fatal accident statistics in 2014:
Fatal accident count: 2
Vehicles involved in fatal accidents: 3
Fatal accidents caused by drunken drivers: 1
Fatalities: 5
Persons involved in fatal accidents: 8
Pedestrians involved in fatal accidents: 0
Fatal accident statistics in 2012:
Fatal accident count: 1
Vehicles involved in fatal accidents: 2
Fatal accidents caused by drunken drivers: 1
Fatalities: 1
Persons involved in fatal accidents: 4
Pedestrians involved in fatal accidents: 0
Home Mortgage Disclosure Act Aggregated Statistics For Year 2009 (Based on 8 partial tracts)
A) FHA, FSA/RHS & VA Home Purchase Loans
B) Conventional Home Purchase Loans
C) Refinancings
D) Home Improvement Loans
F) Non-occupant Loans on < 5 Family Dwellings (A B C & D)
G) Loans On Manufactured Home Dwelling (A B C & D)
Number
Average Value
Number
Average Value
Number
Average Value
Number
Average Value
Number
Average Value
Number
Average Value
LOANS ORIGINATED
17
$87,846
17
$76,854
69
$112,143
8
$30,638
6
$106,120
19
$67,025
APPLICATIONS APPROVED, NOT ACCEPTED
0
$0
1
$34,610
15
$65,776
3
$29,913
0
$0
5
$56,314
APPLICATIONS DENIED
7
$97,867
6
$85,468
44
$86,776
15
$20,179
0
$0
20
$58,230
APPLICATIONS WITHDRAWN
2
$70,190
5
$77,252
18
$102,401
2
$85,050
2
$50,380
5
$81,112
FILES CLOSED FOR INCOMPLETENESS
0
$0
0
$0
6
$58,935
0
$0
0
$0
2
$52,195
Aggregated Statistics For Year 2008 (Based on 8 partial tracts)
A) FHA, FSA/RHS & VA Home Purchase Loans
B) Conventional Home Purchase Loans
C) Refinancings
D) Home Improvement Loans
F) Non-occupant Loans on < 5 Family Dwellings (A B C & D)
G) Loans On Manufactured Home Dwelling (A B C & D)
Number
Average Value
Number
Average Value
Number
Average Value
Number
Average Value
Number
Average Value
Number
Average Value
LOANS ORIGINATED
19
$91,131
36
$109,156
62
$103,053
10
$71,786
12
$135,324
38
$68,887
APPLICATIONS APPROVED, NOT ACCEPTED
0
$0
4
$87,428
10
$88,617
2
$2,705
1
$137,140
2
$47,780
APPLICATIONS DENIED
5
$76,056
16
$75,499
54
$99,945
16
$24,059
4
$66,660
25
$60,826
APPLICATIONS WITHDRAWN
2
$67,555
5
$73,326
24
$96,445
0
$0
0
$0
9
$86,856
FILES CLOSED FOR INCOMPLETENESS
0
$0
0
$0
3
$85,040
0
$0
0
$0
1
$47,740
Aggregated Statistics For Year 2007 (Based on 8 partial tracts)
A) FHA, FSA/RHS & VA Home Purchase Loans
B) Conventional Home Purchase Loans
C) Refinancings
D) Home Improvement Loans
F) Non-occupant Loans on < 5 Family Dwellings (A B C & D)
G) Loans On Manufactured Home Dwelling (A B C & D)
Number
Average Value
Number
Average Value
Number
Average Value
Number
Average Value
Number
Average Value
Number
Average Value
LOANS ORIGINATED
12
$100,848
35
$84,877
51
$92,327
7
$22,579
15
$56,299
27
$61,206
APPLICATIONS APPROVED, NOT ACCEPTED
3
$121,597
6
$116,075
19
$76,275
3
$21,977
5
$70,656
7
$61,951
APPLICATIONS DENIED
1
$60,650
13
$74,790
76
$82,956
16
$39,515
5
$54,048
21
$65,923
APPLICATIONS WITHDRAWN
0
$0
10
$98,898
23
$90,759
4
$60,868
3
$74,437
6
$61,593
FILES CLOSED FOR INCOMPLETENESS
0
$0
1
$90,640
2
$239,650
0
$0
0
$0
0
$0
Aggregated Statistics For Year 2006 (Based on 8 partial tracts)
A) FHA, FSA/RHS & VA Home Purchase Loans
B) Conventional Home Purchase Loans
C) Refinancings
D) Home Improvement Loans
F) Non-occupant Loans on < 5 Family Dwellings (A B C & D)
G) Loans On Manufactured Home Dwelling (A B C & D)
Number
Average Value
Number
Average Value
Number
Average Value
Number
Average Value
Number
Average Value
Number
Average Value
LOANS ORIGINATED
16
$100,134
40
$88,183
64
$75,011
20
$25,822
10
$75,435
35
$64,196
APPLICATIONS APPROVED, NOT ACCEPTED
1
$78,650
13
$60,792
13
$67,219
1
$6,970
5
$72,958
5
$38,504
APPLICATIONS DENIED
3
$95,363
27
$62,776
93
$74,003
23
$55,816
13
$71,092
36
$60,474
APPLICATIONS WITHDRAWN
2
$102,280
4
$88,285
30
$78,712
4
$52,078
7
$63,249
6
$51,308
FILES CLOSED FOR INCOMPLETENESS
0
$0
0
$0
8
$105,998
0
$0
0
$0
2
$76,060
Aggregated Statistics For Year 2005 (Based on 8 partial tracts)
A) FHA, FSA/RHS & VA Home Purchase Loans
B) Conventional Home Purchase Loans
C) Refinancings
D) Home Improvement Loans
F) Non-occupant Loans on < 5 Family Dwellings (A B C & D)
G) Loans On Manufactured Home Dwelling (A B C & D)
Number
Average Value
Number
Average Value
Number
Average Value
Number
Average Value
Number
Average Value
Number
Average Value
LOANS ORIGINATED
8
$95,855
53
$81,511
59
$82,036
13
$22,162
11
$66,567
33
$60,607
APPLICATIONS APPROVED, NOT ACCEPTED
0
$0
4
$47,195
26
$82,419
0
$0
1
$60,340
6
$49,272
APPLICATIONS DENIED
3
$100,007
43
$59,963
120
$82,925
34
$47,665
13
$59,054
75
$66,479
APPLICATIONS WITHDRAWN
2
$71,345
11
$85,842
25
$79,303
1
$85,030
1
$115,170
5
$82,584
FILES CLOSED FOR INCOMPLETENESS
0
$0
3
$110,950
13
$112,388
1
$34,280
0
$0
3
$114,823
Aggregated Statistics For Year 2004 (Based on 8 partial tracts)
A) FHA, FSA/RHS & VA Home Purchase Loans
B) Conventional Home Purchase Loans
C) Refinancings
D) Home Improvement Loans
F) Non-occupant Loans on < 5 Family Dwellings (A B C & D)
G) Loans On Manufactured Home Dwelling (A B C & D)
Number
Average Value
Number
Average Value
Number
Average Value
Number
Average Value
Number
Average Value
Number
Average Value
LOANS ORIGINATED
8
$81,305
50
$78,863
80
$72,687
12
$14,032
19
$55,706
33
$52,351
APPLICATIONS APPROVED, NOT ACCEPTED
3
$63,607
5
$43,710
15
$71,607
4
$14,508
0
$0
6
$54,397
APPLICATIONS DENIED
3
$105,113
39
$68,404
98
$67,017
23
$44,241
7
$64,986
55
$58,280
APPLICATIONS WITHDRAWN
0
$0
4
$105,550
27
$87,903
4
$54,202
0
$0
7
$81,576
FILES CLOSED FOR INCOMPLETENESS
0
$0
1
$126,070
1
$144,610
0
$0
0
$0
0
$0
Aggregated Statistics For Year 2003 (Based on 8 partial tracts)
A) FHA, FSA/RHS & VA Home Purchase Loans
B) Conventional Home Purchase Loans
C) Refinancings
D) Home Improvement Loans
F) Non-occupant Loans on < 5 Family Dwellings (A B C & D)
Number
Average Value
Number
Average Value
Number
Average Value
Number
Average Value
Number
Average Value
LOANS ORIGINATED
6
$108,095
51
$73,619
124
$79,774
16
$10,639
23
$51,539
APPLICATIONS APPROVED, NOT ACCEPTED
0
$0
5
$45,464
25
$94,018
1
$9,700
2
$59,870
APPLICATIONS DENIED
3
$84,063
29
$46,104
88
$73,326
13
$12,999
2
$54,550
APPLICATIONS WITHDRAWN
0
$0
12
$77,021
32
$71,527
3
$24,927
0
$0
FILES CLOSED FOR INCOMPLETENESS
2
$82,650
0
$0
6
$81,253
0
$0
0
$0
Aggregated Statistics For Year 2002 (Based on 8 partial tracts)
A) FHA, FSA/RHS & VA Home Purchase Loans
B) Conventional Home Purchase Loans
C) Refinancings
D) Home Improvement Loans
F) Non-occupant Loans on < 5 Family Dwellings (A B C & D)
Number
Average Value
Number
Average Value
Number
Average Value
Number
Average Value
Number
Average Value
LOANS ORIGINATED
5
$93,202
43
$65,336
104
$82,397
13
$12,663
10
$51,368
APPLICATIONS APPROVED, NOT ACCEPTED
0
$0
18
$40,677
18
$57,801
0
$0
2
$21,335
APPLICATIONS DENIED
0
$0
52
$43,832
75
$67,179
12
$15,659
3
$40,963
APPLICATIONS WITHDRAWN
0
$0
5
$83,368
30
$69,823
3
$28,813
2
$61,345
FILES CLOSED FOR INCOMPLETENESS
0
$0
0
$0
4
$59,478
0
$0
0
$0
Aggregated Statistics For Year 2001 (Based on 8 partial tracts)
A) FHA, FSA/RHS & VA Home Purchase Loans
B) Conventional Home Purchase Loans
C) Refinancings
D) Home Improvement Loans
F) Non-occupant Loans on < 5 Family Dwellings (A B C & D)
Number
Average Value
Number
Average Value
Number
Average Value
Number
Average Value
Number
Average Value
LOANS ORIGINATED
9
$68,117
59
$65,853
91
$84,584
17
$13,543
15
$55,742
APPLICATIONS APPROVED, NOT ACCEPTED
2
$48,430
24
$42,660
16
$65,121
0
$0
1
$44,520
APPLICATIONS DENIED
0
$0
125
$52,238
69
$62,639
10
$14,210
9
$69,006
APPLICATIONS WITHDRAWN
0
$0
1
$87,640
25
$76,992
3
$7,877
3
$60,640
FILES CLOSED FOR INCOMPLETENESS
0
$0
2
$64,400
6
$67,725
0
$0
0
$0
Aggregated Statistics For Year 2000 (Based on 8 partial tracts)
A) FHA, FSA/RHS & VA Home Purchase Loans
B) Conventional Home Purchase Loans
C) Refinancings
D) Home Improvement Loans
F) Non-occupant Loans on < 5 Family Dwellings (A B C & D)
Number
Average Value
Number
Average Value
Number
Average Value
Number
Average Value
Number
Average Value
LOANS ORIGINATED
9
$57,743
77
$51,537
46
$59,384
18
$8,753
10
$63,069
APPLICATIONS APPROVED, NOT ACCEPTED
9
$38,539
29
$39,903
18
$62,348
1
$13,800
0
$0
APPLICATIONS DENIED
15
$47,146
133
$43,680
53
$54,511
9
$16,210
11
$53,320
APPLICATIONS WITHDRAWN
3
$39,367
6
$55,485
29
$61,783
1
$12,340
0
$0
FILES CLOSED FOR INCOMPLETENESS
0
$0
0
$0
1
$93,640
0
$0
0
$0
Aggregated Statistics For Year 1999 (Based on 4 partial tracts)
A) FHA, FSA/RHS & VA Home Purchase Loans
B) Conventional Home Purchase Loans
C) Refinancings
D) Home Improvement Loans
F) Non-occupant Loans on < 5 Family Dwellings (A B C & D)
2002 - 2018 National Fire Incident Reporting System (NFIRS) incidents
Based on the data from the years 2002 - 2018 the average number of fires per year is 10. The highest number of reported fire incidents - 26 took place in 2004, and the least - 0 in 2010. The data has an increasing trend.
When looking into fire subcategories, the most incidents belonged to: Structure Fires (58.8%), and Outside Fires (27.7%).
Fire incident types reported to NFIRS in Zip Code 27864


 Nearest zip codes: 27852, 27829, 27801, 27886, 27827, 27822.


 Based on the data from the years 2002 - 2018 the average number of fires per year is 10. The highest number of reported fire incidents - 26 took place in 2004, and the least - 0 in 2010. The data has an increasing trend.
 When looking into fire subcategories, the most incidents belonged to: Structure Fires (58.8%), and Outside Fires (27.7%).