Estimated median house/condo value in 2022: $95,564
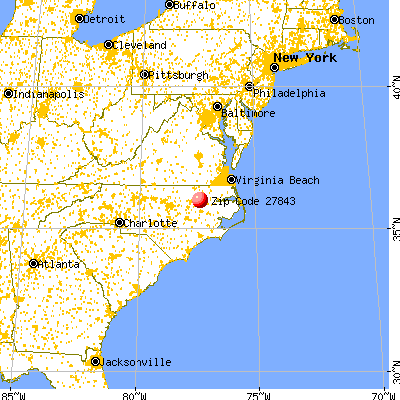
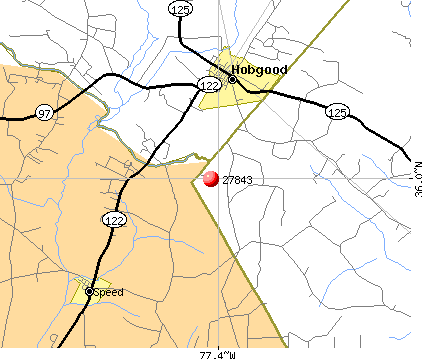
27843:
$95,564
North Carolina:
$280,600
Median resident age:
This zip code:
44.3 years
North Carolina median age:
39.2 years
Average household size:
This zip code:
2.8 people
North Carolina:
2.4 people
Averages for the 2020 tax year for zip code 27843, filed in 2021:
Average Adjusted Gross Income (AGI) in 2020: $37,491 (Individual Income Tax Returns)
Here:
$37,491
State:
$70,020
Salary/wage: $37,379 (reported on 75.6% of returns)
Here:
$37,379
State:
$58,387
(% of AGI for various income ranges: 1212.9% for AGIs below $25k, 3700.0% for AGIs $25k-50k, 8790.0% for AGIs $50k-75k, 4956.7% for AGIs $75k-100k)
Taxable interest for individuals: $209 (reported on 24.4% of returns)
This zip code:
$209
North Carolina:
$1,479
(% of AGI for various income ranges: 3.6% for AGIs below $25k, 10.0% for AGIs $25k-50k, 23.3% for AGIs $75k-100k)
Ordinary dividends: $900 (reported on 6.7% of returns)
Here:
$900
State:
$7,888
(% of AGI for various income ranges: 24.5% for AGIs $25k-50k)
Net capital gain/loss in AGI: +$4,350 (reported on 4.4% of returns)
Here:
+$4,350
State:
+$23,652
(% of AGI for various income ranges: 62.1% for AGIs below $25k)
Earned income credit: $2,569 (reported on 28.9% of returns)
Here:
$2,569
State:
$2,337
(% of AGI for various income ranges: 149.3% for AGIs below $25k, 113.6% for AGIs $25k-50k)
Percentage of individuals using paid preparers for their 2020 taxes: 84.4%
Here:
84%
State:
93%
(% for various income ranges: 84.2% for AGIs below $25k, 85.7% for AGIs $25k-50k, 83.3% for AGIs $50k-75k, 66.7% for AGIs $75k-100k, 100.0% for AGIs $100k-200k)
Averages for the 2012 tax year for zip code 27843, filed in 2013:
Average Adjusted Gross Income (AGI) in 2012: $35,054 (Individual Income Tax Returns)
Here:
$35,054
State:
$54,937
Salary/wage: $32,723 (reported on 85.4% of returns)
Here:
$32,723
State:
$46,336
(% of AGI for various income ranges: 79.2% for AGIs below $25k, 81.6% for AGIs $25k-50k, 88.7% for AGIs $50k-75k, 70.5% for AGIs $75k-100k)
Taxable interest for individuals: $550 (reported on 19.5% of returns)
This zip code:
$550
North Carolina:
$1,298
(% of AGI for various income ranges: 0.9% for AGIs below $25k, 0.3% for AGIs $25k-50k, 0.2% for AGIs $75k-100k)
Ordinary dividends: $1,233 (reported on 7.3% of returns)
Here:
$1,233
State:
$6,213
Profit/loss from business: +$2,733 (reported on 7.3% of returns)
Here:
+$2,733
State:
+$10,311
Total itemized deductions: $15,450 (27% of AGI, reported on 19.5% of returns)
Here:
$15,450
State:
$23,438
Here:
27.1% of AGI
State:
21.5% of AGI
(% of AGI for various income ranges: 16.4% for AGIs $25k-50k, 12.9% for AGIs $75k-100k)
Charity contributions: $3,917 (reported on 14.6% of returns)
Here:
$3,917
State:
$4,687
(% of AGI for various income ranges: 3.7% for AGIs $25k-50k, 1.8% for AGIs $75k-100k)
Taxes paid: $4,525 (reported on 19.5% of returns)
27843:
$4,525
State:
$8,823
(% of AGI for various income ranges: 3.6% for AGIs $25k-50k, 5.1% for AGIs $75k-100k)
Earned income credit: $2,586 (reported on 34.1% of returns)
Here:
$2,586
State:
$2,376
(% of AGI for various income ranges: 11.1% for AGIs below $25k, 1.3% for AGIs $25k-50k)
Percentage of individuals using paid preparers for their 2012 taxes: 53.7%
Here:
54%
State:
53%
(% for various income ranges: 52.6% for AGIs below $25k, 46.2% for AGIs $25k-50k, 60.0% for AGIs $50k-75k, 75.0% for AGIs $75k-100k)
Averages for the 2004 tax year for zip code 27843, filed in 2005:
Average Adjusted Gross Income (AGI) in 2004: $27,601 (Individual Income Tax Returns)
Here:
$27,601
State:
$45,376
Salary/wage: $25,550 (reported on 85.7% of returns)
Here:
$25,550
State:
$39,442
(% of AGI for various income ranges: 82.9% for AGIs below $10k, 86.4% for AGIs $10k-25k, 85.9% for AGIs $25k-50k, 74.3% for AGIs $50k-75k, 65.3% for AGIs $75k-100k)
Taxable interest for individuals: $1,397 (reported on 26.9% of returns)
This zip code:
$1,397
North Carolina:
$1,515
(% of AGI for various income ranges: 8.2% for AGIs below $10k, 1.4% for AGIs $10k-25k, 1.6% for AGIs $25k-50k, 0.8% for AGIs $50k-75k, 0.3% for AGIs $75k-100k)
Taxable dividends: $1,111 (reported on 9.6% of returns)
Here:
$1,111
State:
$4,016
Net capital gain/loss: +$1,875 (reported on 5.1% of returns)
Here:
+$1,875
State:
+$11,152
Total itemized deductions: $12,598 (26% of AGI, reported on 17.5% of returns)
Here:
$12,598
State:
$19,464
Here:
25.5% of AGI
State:
22.7% of AGI
(% of AGI for various income ranges: 5.9% for AGIs $10k-25k, 7.7% for AGIs $25k-50k, 11.3% for AGIs $50k-75k, 8.9% for AGIs $75k-100k)
Charity contributions deductions: $2,936 (6% of AGI, reported on 16.6% of returns)
Here:
$2,936
State:
$4,035
Here:
5.8% of AGI
State:
4.5% of AGI
(% of AGI for various income ranges: 1.4% for AGIs $10k-25k, 2.1% for AGIs $25k-50k, 2.2% for AGIs $50k-75k, 1.6% for AGIs $75k-100k)
Total tax: $3,312 (reported on 55.4% of returns)
27843:
$3,312
State:
$7,257
(% of AGI for various income ranges: 1.7% for AGIs below $10k, 2.4% for AGIs $10k-25k, 5.3% for AGIs $25k-50k, 7.9% for AGIs $50k-75k, 13.8% for AGIs $75k-100k)
Earned income credit: $1,963 (reported on 40.3% of returns)
Here:
$1,963
State:
$1,851
Percentage of individuals using paid preparers for their 2004 taxes: 65.0%
Here:
65%
State:
62%
(% for various income ranges: 63.3% for AGIs below $10k, 69.1% for AGIs $10k-25k, 59.4% for AGIs $25k-50k, 66.7% for AGIs $50k-75k, 61.5% for AGIs $75k-100k)
Household received Food Stamps/SNAP in the past 12 months: 78 Household did not receive Food Stamps/SNAP in the past 12 months: 291
Women who had a birth in the past 12 months: 2 (2 now married, 0 unmarried) Women who did not have a birth in the past 12 months: 126 (43 now married, 82 unmarried)
Housing units in zip code 27843 with a mortgage: 129 Median monthly owner costs for units with a mortgage: $814 Median monthly owner costs for units without a mortgage: $470
Residents with income below the poverty level in 2022:
This zip code:
24.6%
Whole state:
12.8%
Residents with income below 50% of the poverty level in 2022:
This zip code:
14.9%
Whole state:
6.8%
Median number of rooms in houses and condos:
Here:
5.6
State:
6.4
Median number of rooms in apartments:
Here:
4.8
State:
4.4
Notable locations in this zip code not listed on our city pages
Cemeteries: Bell Cemetery (1), Bland Cemetery (2), Mizell Cemetery (3), Fields Cemetery (4), Joyner Cemetery (5), Hogun Cemetery (6), Williams Cemetery (7). Display/hide their locations on the map
Size of family households: 105 2-persons, 10 3-persons, 102 4-persons, 22 5-persons
Size of nonfamily households: 94 1-person, 28 2-persons
114 married couples with children.
52 single-parent households (52 women).
98.8% of residents of 27843 zip code speak English at home.
1.0% of residents speak Spanish at home (100% very well).
Foreign born population: 11 (1.1%) (9.7% of them are naturalized citizens)
This zip code:
1.1%
Whole state:
8.6%
64%Honduras
27%Guatemala
32%American
2%European
1%English
1%Irish
0%German
0%Scottish
Year of entry for the foreign-born population
22010 or later
52000 to 2009
21990 to 1999
0Before 1990
Facilities with environmental interests located in this zip code:
COTTON SERVICES INC (NC STATE ROAD 97 in HOBGOOD, NC)
AIR MINOR (AIRS/AFS) STATE MASTER (North Carolina facility info) - AIR PROGRAM CRITERIA AND HAZARDOUS AIR POLLUTANT INVENTORY (Inventory of air pollution sources) Business SIC and NAICS classification: COTTON GINNING
Housing units lacking complete plumbing facilities: 5.3% Housing units lacking complete kitchen facilities: 4.4%
66.6%Electricity
27.0%Bottled, tank, or LP gas
4.3%Fuel oil, kerosene, etc.
1.4%Utility gas
1.4%Wood
Population in 1990: 2,408.
Place of birth for U.S.-born residents:
This state: 937
Northeast: 8
Midwest: 10
South: 40
West: 4
72% of the 27843 zip code residents lived in the same house 5 years ago. Out of people who lived in different houses, 59% lived in this county. Out of people who lived in different counties, 50% lived in North Carolina.
95% of the 27843 zip code residents lived in the same house 1 year ago. Out of people who lived in different houses, 2% moved from this county. Out of people who lived in different houses, 112% moved from different county within same state.
Private vs. public school enrollment:
Students in private schools in grades 1 to 8 (elementary and middle school): 8
Here:
12.5%
North Carolina:
13.8%
Students in private schools in grades 9 to 12 (high school): 36
Here:
92.2%
North Carolina:
11.9%
Students in private undergraduate colleges: 6
Here:
23.9%
North Carolina:
19.3%
Occupation by median earnings in the past 12 months ($)
61,181Management occupations
39,263Construction and extraction occupations
31,756Office and administrative support occupations
24,183Production occupations
11,662Food preparation and serving related occupations
2,627Sales and related occupations
Companies with federal contracts located in this zip code:
BRADDY, PHILLIP (306 S POPLAR ST in HOBGOOD, NC; small business)
$5,200 with Army for Program Review/Development Services. Taking place in SC. Signed on 2002-05-30. Completion date: 2002-08-30.
Top industries in this zip code by the number of employees in 2005:
Educational Services: Elementary and Secondary Schools (20-49 employees: 1 establishment)
Health Care and Social Assistance: Child Day Care Services (5-9: 1)
Construction: Water and Sewer Line and Related Structures Construction (5-9: 1)
Other Services (except Public Administration): Other Similar Organizations (except Business, Professional, Labor, and Political Organizations) (1-4: 1)
Construction: Plumbing, Heating, and Air-Conditioning Contractors (1-4: 1)
Construction: Commercial and Institutional Building Construction (1-4: 1)
Administrative and Support and Waste Management and Remediation Services: Landscaping Services (1-4: 1)
Fatal accident statistics in 2014:
Fatal accident count: 1
Vehicles involved in fatal accidents: 1
Fatal accidents caused by drunken drivers: 1
Fatalities: 1
Persons involved in fatal accidents: 1
Pedestrians involved in fatal accidents: 0
Home Mortgage Disclosure Act Aggregated Statistics For Year 2009 (Based on 2 partial tracts)
A) FHA, FSA/RHS & VA Home Purchase Loans
B) Conventional Home Purchase Loans
C) Refinancings
D) Home Improvement Loans
G) Loans On Manufactured Home Dwelling (A B C & D)
Number
Average Value
Number
Average Value
Number
Average Value
Number
Average Value
Number
Average Value
LOANS ORIGINATED
1
$42,930
3
$58,920
8
$112,652
1
$10,400
2
$43,265
APPLICATIONS APPROVED, NOT ACCEPTED
0
$0
0
$0
1
$96,930
0
$0
1
$35,220
APPLICATIONS DENIED
0
$0
0
$0
7
$96,500
1
$36,890
3
$55,900
APPLICATIONS WITHDRAWN
0
$0
1
$92,570
1
$100,960
0
$0
0
$0
FILES CLOSED FOR INCOMPLETENESS
0
$0
0
$0
1
$51,650
0
$0
0
$0
Aggregated Statistics For Year 2008 (Based on 2 partial tracts)
A) FHA, FSA/RHS & VA Home Purchase Loans
B) Conventional Home Purchase Loans
C) Refinancings
D) Home Improvement Loans
F) Non-occupant Loans on < 5 Family Dwellings (A B C & D)
G) Loans On Manufactured Home Dwelling (A B C & D)
Number
Average Value
Number
Average Value
Number
Average Value
Number
Average Value
Number
Average Value
Number
Average Value
LOANS ORIGINATED
2
$78,820
2
$117,725
6
$107,383
1
$83,850
3
$104,643
2
$66,910
APPLICATIONS APPROVED, NOT ACCEPTED
0
$0
0
$0
1
$77,480
0
$0
0
$0
0
$0
APPLICATIONS DENIED
1
$73,450
2
$86,870
5
$92,234
1
$50,980
0
$0
4
$78,568
APPLICATIONS WITHDRAWN
0
$0
0
$0
2
$59,365
0
$0
0
$0
1
$75,130
FILES CLOSED FOR INCOMPLETENESS
0
$0
0
$0
0
$0
0
$0
0
$0
0
$0
Aggregated Statistics For Year 2007 (Based on 2 partial tracts)
A) FHA, FSA/RHS & VA Home Purchase Loans
B) Conventional Home Purchase Loans
C) Refinancings
D) Home Improvement Loans
F) Non-occupant Loans on < 5 Family Dwellings (A B C & D)
G) Loans On Manufactured Home Dwelling (A B C & D)
Number
Average Value
Number
Average Value
Number
Average Value
Number
Average Value
Number
Average Value
Number
Average Value
LOANS ORIGINATED
1
$54,330
4
$107,495
8
$72,740
1
$8,720
2
$45,110
3
$65,513
APPLICATIONS APPROVED, NOT ACCEPTED
0
$0
0
$0
2
$69,765
0
$0
0
$0
1
$30,860
APPLICATIONS DENIED
0
$0
1
$92,230
6
$74,570
2
$55,510
0
$0
5
$64,464
APPLICATIONS WITHDRAWN
0
$0
0
$0
3
$94,583
0
$0
0
$0
1
$57,690
FILES CLOSED FOR INCOMPLETENESS
0
$0
0
$0
1
$109,340
0
$0
0
$0
0
$0
Aggregated Statistics For Year 2006 (Based on 2 partial tracts)
A) FHA, FSA/RHS & VA Home Purchase Loans
B) Conventional Home Purchase Loans
C) Refinancings
D) Home Improvement Loans
F) Non-occupant Loans on < 5 Family Dwellings (A B C & D)
G) Loans On Manufactured Home Dwelling (A B C & D)
Number
Average Value
Number
Average Value
Number
Average Value
Number
Average Value
Number
Average Value
Number
Average Value
LOANS ORIGINATED
1
$138,520
2
$99,445
5
$80,764
1
$26,500
1
$66,410
3
$67,863
APPLICATIONS APPROVED, NOT ACCEPTED
0
$0
1
$45,610
0
$0
0
$0
0
$0
1
$21,470
APPLICATIONS DENIED
0
$0
1
$67,420
9
$88,471
3
$41,477
1
$96,260
5
$58,560
APPLICATIONS WITHDRAWN
0
$0
0
$0
2
$57,690
0
$0
1
$42,600
1
$23,480
FILES CLOSED FOR INCOMPLETENESS
0
$0
0
$0
0
$0
0
$0
0
$0
0
$0
Aggregated Statistics For Year 2005 (Based on 2 partial tracts)
A) FHA, FSA/RHS & VA Home Purchase Loans
B) Conventional Home Purchase Loans
C) Refinancings
D) Home Improvement Loans
F) Non-occupant Loans on < 5 Family Dwellings (A B C & D)
G) Loans On Manufactured Home Dwelling (A B C & D)
Number
Average Value
Number
Average Value
Number
Average Value
Number
Average Value
Number
Average Value
Number
Average Value
LOANS ORIGINATED
1
$84,860
3
$56,013
5
$87,406
2
$37,565
2
$56,180
5
$51,384
APPLICATIONS APPROVED, NOT ACCEPTED
0
$0
1
$37,560
2
$70,100
0
$0
0
$0
0
$0
APPLICATIONS DENIED
0
$0
4
$66,075
11
$85,253
2
$51,485
1
$34,880
8
$61,169
APPLICATIONS WITHDRAWN
0
$0
1
$47,630
4
$97,265
0
$0
0
$0
1
$85,860
FILES CLOSED FOR INCOMPLETENESS
0
$0
0
$0
1
$67,420
0
$0
0
$0
0
$0
Aggregated Statistics For Year 2004 (Based on 2 partial tracts)
A) FHA, FSA/RHS & VA Home Purchase Loans
B) Conventional Home Purchase Loans
C) Refinancings
D) Home Improvement Loans
F) Non-occupant Loans on < 5 Family Dwellings (A B C & D)
G) Loans On Manufactured Home Dwelling (A B C & D)
Number
Average Value
Number
Average Value
Number
Average Value
Number
Average Value
Number
Average Value
Number
Average Value
LOANS ORIGINATED
1
$57,020
4
$63,308
8
$73,830
1
$6,710
1
$90,560
2
$66,240
APPLICATIONS APPROVED, NOT ACCEPTED
0
$0
1
$48,630
3
$73,230
0
$0
0
$0
1
$25,490
APPLICATIONS DENIED
0
$0
5
$66,678
10
$81,804
4
$32,785
0
$0
7
$45,759
APPLICATIONS WITHDRAWN
1
$34,210
1
$101,630
4
$77,310
1
$16,100
1
$37,560
1
$72,450
FILES CLOSED FOR INCOMPLETENESS
0
$0
1
$61,380
1
$59,700
0
$0
1
$55,680
0
$0
Aggregated Statistics For Year 2003 (Based on 2 partial tracts)
A) FHA, FSA/RHS & VA Home Purchase Loans
B) Conventional Home Purchase Loans
C) Refinancings
D) Home Improvement Loans
F) Non-occupant Loans on < 5 Family Dwellings (A B C & D)
Number
Average Value
Number
Average Value
Number
Average Value
Number
Average Value
Number
Average Value
LOANS ORIGINATED
1
$97,270
4
$62,132
13
$63,416
2
$8,050
1
$37,900
APPLICATIONS APPROVED, NOT ACCEPTED
0
$0
2
$36,055
1
$81,840
1
$5,370
0
$0
APPLICATIONS DENIED
1
$61,710
11
$52,353
7
$56,634
2
$31,025
0
$0
APPLICATIONS WITHDRAWN
0
$0
0
$0
2
$70,935
1
$26,830
0
$0
FILES CLOSED FOR INCOMPLETENESS
0
$0
0
$0
0
$0
0
$0
0
$0
Aggregated Statistics For Year 2002 (Based on 2 partial tracts)
B) Conventional Home Purchase Loans
C) Refinancings
D) Home Improvement Loans
Number
Average Value
Number
Average Value
Number
Average Value
LOANS ORIGINATED
3
$1,616,850
6
$70,490
1
$7,040
APPLICATIONS APPROVED, NOT ACCEPTED
2
$53,495
1
$63,060
0
$0
APPLICATIONS DENIED
4
$46,202
7
$48,106
3
$36,447
APPLICATIONS WITHDRAWN
1
$82,170
4
$52,405
0
$0
FILES CLOSED FOR INCOMPLETENESS
0
$0
0
$0
0
$0
Aggregated Statistics For Year 2001 (Based on 2 partial tracts)
B) Conventional Home Purchase Loans
C) Refinancings
D) Home Improvement Loans
F) Non-occupant Loans on < 5 Family Dwellings (A B C & D)
Number
Average Value
Number
Average Value
Number
Average Value
Number
Average Value
LOANS ORIGINATED
7
$56,923
5
$81,904
2
$11,570
1
$33,880
APPLICATIONS APPROVED, NOT ACCEPTED
2
$48,465
2
$47,125
0
$0
0
$0
APPLICATIONS DENIED
9
$50,422
4
$92,402
3
$21,467
0
$0
APPLICATIONS WITHDRAWN
1
$39,580
3
$76,137
0
$0
0
$0
FILES CLOSED FOR INCOMPLETENESS
0
$0
0
$0
0
$0
0
$0
Aggregated Statistics For Year 2000 (Based on 2 partial tracts)
A) FHA, FSA/RHS & VA Home Purchase Loans
B) Conventional Home Purchase Loans
C) Refinancings
D) Home Improvement Loans
Number
Average Value
Number
Average Value
Number
Average Value
Number
Average Value
LOANS ORIGINATED
0
$0
5
$65,268
6
$60,483
2
$8,890
APPLICATIONS APPROVED, NOT ACCEPTED
0
$0
1
$46,290
0
$0
0
$0
APPLICATIONS DENIED
1
$19,450
8
$35,218
4
$37,230
1
$14,090
APPLICATIONS WITHDRAWN
0
$0
2
$50,645
2
$57,020
0
$0
FILES CLOSED FOR INCOMPLETENESS
0
$0
0
$0
0
$0
0
$0
Aggregated Statistics For Year 1999 (Based on 1 partial tract)
Detailed PMIC statistics for the following Tracts:0208.00
2004 - 2017 National Fire Incident Reporting System (NFIRS) incidents
According to the data from the years 2004 - 2017 the average number of fires per year is 10. The highest number of fires - 18 took place in 2016, and the least - 3 in 2004. The data has a growing trend.
When looking into fire subcategories, the most incidents belonged to: Structure Fires (46.2%), and Outside Fires (29.0%).
Fire incident types reported to NFIRS in Zip Code 27843


 Nearest zip codes: 27881, 27857, 27874, 27886, 27841, 27812.


 According to the data from the years 2004 - 2017 the average number of fires per year is 10. The highest number of fires - 18 took place in 2016, and the least - 3 in 2004. The data has a growing trend.
 When looking into fire subcategories, the most incidents belonged to: Structure Fires (46.2%), and Outside Fires (29.0%).