Estimated zip code population in 2022: 1,175 Zip code population in 2010: 1,544 Zip code population in 2000: 1,654
Houses and condos: 583 Renter-occupied apartments: 124
% of renters here:
23%
State:
33%
March 2022 cost of living index in zip code 27849: 80.0 (low, U.S. average is 100)
Land area: 76.5 sq. mi. Water area: 0.7 sq. mi.
Population density: 15 people per square mile
(very low).
OSM Map
General Map
Google Map
MSN Map
OSM Map
General Map
Google Map
MSN Map
OSM Map
General Map
Google Map
MSN Map
OSM Map
General Map
Google Map
MSN Map
Please wait while loading the map...
Real estate property taxes paid for housing units in 2022:
This zip code:
0.7% ($871)
North Carolina:
0.6% ($1,769)
Median real estate property taxes paid for housing units with mortgages in 2022: $1,518 (1.0%) Median real estate property taxes paid for housing units with no mortgage in 2022: $622 (0.9%)
Business Search- 14 Million verified businesses
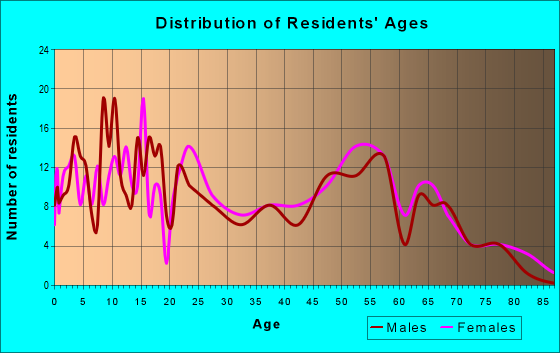
Males: 530
(45.2%)
Females: 644
(54.8%)
For population 25 years and over in 27849:
High school or higher: 77.0%
Bachelor's degree or higher: 18.0%
Graduate or professional degree: 10.3%
Unemployed: 7.1%
Mean travel time to work (commute): 35.6 minutes
For population 15 years and over in 27849:
Never married: 30.8%
Now married: 39.9%
Separated: 2.0%
Widowed: 10.5%
Divorced: 16.9%
Zip code 27849 compared to state average:
Median household income below state average.
Median house value significantly below state average.
Unemployed percentage above state average.
Black race population percentage significantly above state average.
Hispanic race population percentage significantly below state average.
Foreign-born population percentage significantly below state average.
Length of stay since moving in above state average.
House age above state average.
Number of college students significantly below state average.
Percentage of population with a bachelor's degree or higher below state average.
Estimated median house/condo value in 2022: $118,499
27849:
$118,499
North Carolina:
$280,600
According to our research of North Carolina and other state lists, there were 7 registered sex offenders living in 27849 zip code as of May 28, 2024. The ratio of all residents to sex offenders in zip code 27849 is 231 to 1.
Median resident age:
This zip code:
40.0 years
North Carolina median age:
39.2 years
Average household size:
This zip code:
2.2 people
North Carolina:
2.4 people
Averages for the 2020 tax year for zip code 27849, filed in 2021:
Average Adjusted Gross Income (AGI) in 2020: $34,541 (Individual Income Tax Returns)
Here:
$34,541
State:
$70,020
Salary/wage: $32,883 (reported on 88.1% of returns)
Here:
$32,883
State:
$58,387
(% of AGI for various income ranges: 1372.5% for AGIs below $25k, 4434.7% for AGIs $25k-50k, 7895.0% for AGIs $50k-75k, 7576.7% for AGIs $75k-100k)
Taxable interest for individuals: $100 (reported on 11.9% of returns)
This zip code:
$100
North Carolina:
$1,479
(% of AGI for various income ranges: 2.5% for AGIs below $25k, 5.0% for AGIs $50k-75k)
Profit/loss from business: +$971 (reported on 11.9% of returns)
Here:
+$971
State:
+$11,710
(% of AGI for various income ranges: 43.5% for AGIs below $25k)
Total itemized deductions: $23,300 (reported on 5.1% of returns)
Here:
$23,300
State:
$34,549
(% of AGI for various income ranges: 466.0% for AGIs $25k-50k)
Charity contributions: $8,200 (reported on 3.4% of returns)
Here:
$8,200
State:
$13,360
(% of AGI for various income ranges: 109.3% for AGIs $25k-50k)
Taxes paid: $4,750 (reported on 3.4% of returns)
27849:
$4,750
State:
$7,586
(% of AGI for various income ranges: 63.3% for AGIs $25k-50k)
Earned income credit: $2,510 (reported on 35.6% of returns)
Here:
$2,510
State:
$2,337
(% of AGI for various income ranges: 176.0% for AGIs below $25k, 116.7% for AGIs $25k-50k)
Percentage of individuals using paid preparers for their 2020 taxes: 89.8%
Here:
90%
State:
93%
(% for various income ranges: 92.3% for AGIs below $25k, 85.7% for AGIs $25k-50k, 85.7% for AGIs $50k-75k, 166.7% for AGIs $75k-100k, 0.0% for AGIs $100k-200k)
Averages for the 2012 tax year for zip code 27849, filed in 2013:
Average Adjusted Gross Income (AGI) in 2012: $28,643 (Individual Income Tax Returns)
Here:
$28,643
State:
$54,937
Salary/wage: $25,583 (reported on 92.9% of returns)
Here:
$25,583
State:
$46,336
(% of AGI for various income ranges: 85.8% for AGIs below $25k, 87.8% for AGIs $25k-50k, 83.3% for AGIs $50k-75k, 70.7% for AGIs $75k-100k)
Taxable interest for individuals: $290 (reported on 14.3% of returns)
This zip code:
$290
North Carolina:
$1,298
(% of AGI for various income ranges: 0.2% for AGIs below $25k, 0.2% for AGIs $25k-50k, 0.2% for AGIs $75k-100k)
Ordinary dividends: $250 (reported on 2.9% of returns)
Here:
$250
State:
$6,213
Profit/loss from business: +$2,838 (reported on 11.4% of returns)
Here:
+$2,838
State:
+$10,311
Total itemized deductions: $17,115 (32% of AGI, reported on 18.6% of returns)
Here:
$17,115
State:
$23,438
Here:
31.8% of AGI
State:
21.5% of AGI
(% of AGI for various income ranges: 6.5% for AGIs below $25k, 12.0% for AGIs $25k-50k, 11.5% for AGIs $50k-75k, 15.3% for AGIs $75k-100k)
Charity contributions: $4,791 (reported on 15.7% of returns)
Here:
$4,791
State:
$4,687
(% of AGI for various income ranges: 2.0% for AGIs below $25k, 3.9% for AGIs $25k-50k, 3.6% for AGIs $75k-100k)
Taxes paid: $3,746 (reported on 18.6% of returns)
27849:
$3,746
State:
$8,823
(% of AGI for various income ranges: 0.8% for AGIs below $25k, 1.9% for AGIs $25k-50k, 2.3% for AGIs $50k-75k, 5.5% for AGIs $75k-100k)
Earned income credit: $2,891 (reported on 45.7% of returns)
Here:
$2,891
State:
$2,376
(% of AGI for various income ranges: 14.1% for AGIs below $25k, 2.1% for AGIs $25k-50k)
Percentage of individuals using paid preparers for their 2012 taxes: 42.9%
Here:
43%
State:
53%
(% for various income ranges: 45.0% for AGIs below $25k, 35.0% for AGIs $25k-50k, 50.0% for AGIs $50k-75k, 50.0% for AGIs $75k-100k)
Averages for the 2004 tax year for zip code 27849, filed in 2005:
Average Adjusted Gross Income (AGI) in 2004: $23,869 (Individual Income Tax Returns)
Here:
$23,869
State:
$45,376
Salary/wage: $22,483 (reported on 93.7% of returns)
Here:
$22,483
State:
$39,442
(% of AGI for various income ranges: 126.3% for AGIs below $10k, 90.8% for AGIs $10k-25k, 92.0% for AGIs $25k-50k, 79.0% for AGIs $50k-75k, 76.4% for AGIs $75k-100k, 71.5% for AGIs over 100k)
Taxable interest for individuals: $750 (reported on 14.4% of returns)
This zip code:
$750
North Carolina:
$1,515
(% of AGI for various income ranges: 0.2% for AGIs $10k-25k, 0.6% for AGIs $25k-50k, 0.7% for AGIs $50k-75k, 1.1% for AGIs $75k-100k)
Taxable dividends: $3,710 (reported on 4.1% of returns)
Here:
$3,710
State:
$4,016
Profit/loss from business: +$744 (reported on 5.2% of returns)
Here:
+$744
State:
+$9,490
Total itemized deductions: $16,130 (30% of AGI, reported on 14.4% of returns)
Here:
$16,130
State:
$19,464
Here:
29.7% of AGI
State:
22.7% of AGI
(% of AGI for various income ranges: 3.2% for AGIs $10k-25k, 10.5% for AGIs $25k-50k, 18.2% for AGIs $50k-75k, 36.7% for AGIs $75k-100k)
Charity contributions deductions: $4,869 (9% of AGI, reported on 13.2% of returns)
Here:
$4,869
State:
$4,035
Here:
9.2% of AGI
State:
4.5% of AGI
(% of AGI for various income ranges: 0.8% for AGIs $10k-25k, 3.0% for AGIs $25k-50k, 5.0% for AGIs $50k-75k, 10.5% for AGIs $75k-100k)
Total tax: $2,551 (reported on 47.3% of returns)
27849:
$2,551
State:
$7,257
(% of AGI for various income ranges: 0.7% for AGIs below $10k, 1.7% for AGIs $10k-25k, 4.5% for AGIs $25k-50k, 7.8% for AGIs $50k-75k, 7.6% for AGIs $75k-100k, 16.2% for AGIs over 100k)
Earned income credit: $2,153 (reported on 53.9% of returns)
Here:
$2,153
State:
$1,851
Percentage of individuals using paid preparers for their 2004 taxes: 59.7%
Here:
60%
State:
62%
(% for various income ranges: 59.0% for AGIs below $10k, 65.4% for AGIs $10k-25k, 49.2% for AGIs $25k-50k, 61.0% for AGIs $50k-75k, 93.8% for AGIs $75k-100k)
Household received Food Stamps/SNAP in the past 12 months: 200 Household did not receive Food Stamps/SNAP in the past 12 months: 349
Women who had a birth in the past 12 months: 12 (2 now married, 9 unmarried) Women who did not have a birth in the past 12 months: 216 (59 now married, 155 unmarried)
Housing units in zip code 27849 with a mortgage: 214 (2 second mortgage, 2 both second mortgage and home equity loan) Houses without a mortgage: 41
Median monthly owner costs for units with a mortgage: $1,042 Median monthly owner costs for units without a mortgage: $420
Residents with income below the poverty level in 2022:
This zip code:
18.1%
Whole state:
12.8%
Residents with income below 50% of the poverty level in 2022:
This zip code:
9.5%
Whole state:
6.8%
Median number of rooms in houses and condos:
Here:
5.9
State:
6.4
Median number of rooms in apartments:
Here:
4.2
State:
4.4
Notable locations in this zip code not listed on our city pages
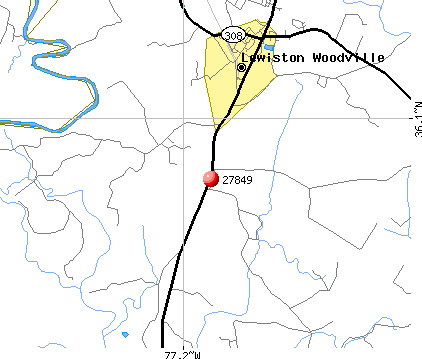
Notable locations in zip code 27849: Apple Tree Landing (A), Flag Run Landing (B), Devereaux Landing (C), Peanut Belt Research Station (D), Lewiston Woodville Police Department (E). Display/hide their locations on the map
Churches in zip code 27849 include: Beautiful Zion Church (A), Village Gate Church (B), Weeping Mary Church (C), Mount Joy Church (D), Saint Lukes Church (E), Spring Hill Church (F). Display/hide their locations on the map
In group quarters: 6 (-1 institutionalized population)
Size of family households: 75 2-persons, 97 3-persons, 90 4-persons, 11 5-persons, 9 6-persons
Size of nonfamily households: 237 1-person, 10 3-persons
119 married couples with children.
106 single-parent households (23 men, 83 women).
94.9% of residents of 27849 zip code speak English at home.
1.9% of residents speak Spanish at home (100% very well).
1.9% of residents speak other Indo-European language at home (100% very well).
1.0% of residents speak Asian or Pacific Island language at home (70% very well, 30% not well).
Foreign born population: 7 (0.6%) (44.7% of them are naturalized citizens)
This zip code:
0.6%
Whole state:
8.6%
43%Bhutan
10%American
6%English
0%Scotch-Irish
0%Scottish
Year of entry for the foreign-born population
42010 or later
02000 to 2009
21990 to 1999
0Before 1990
Housing units lacking complete plumbing facilities: 1.5% Housing units lacking complete kitchen facilities: 1.5%
73.8%Electricity
18.2%Bottled, tank, or LP gas
6.7%Fuel oil, kerosene, etc.
1.2%Utility gas
0.6%Wood
Population in 1990: 634. Population change in the 1990s: +1,020 (+160.9%).
Place of birth for U.S.-born residents:
This state: 984
Northeast: 54
South: 109
74% of the 27849 zip code residents lived in the same house 5 years ago. Out of people who lived in different houses, 59% lived in this county. Out of people who lived in different counties, 50% lived in North Carolina.
77% of the 27849 zip code residents lived in the same house 1 year ago. Out of people who lived in different houses, 12% moved from this county. Out of people who lived in different houses, 84% moved from different county within same state. Out of people who lived in different houses, 3% moved from different state.
Private vs. public school enrollment:
Students in private schools in grades 1 to 8 (elementary and middle school): 26
Here:
19.7%
North Carolina:
13.8%
Students in private schools in grades 9 to 12 (high school):
Here:
0.0%
North Carolina:
11.9%
Students in private undergraduate colleges:
Here:
0.0%
North Carolina:
19.3%
Occupation by median earnings in the past 12 months ($)
62,620Management occupations
41,510Material moving occupations
31,435Food preparation and serving related occupations
19,986Production occupations
4,932Office and administrative support occupations
Top industries in this zip code by the number of employees in 2005:
Accommodation and Food Services: Food Service Contractors (20-49 employees: 1 establishment)
Health Care and Social Assistance: Home Health Care Services (20-49: 1)
Real Estate and Rental and Leasing: Video Tape and Disc Rental (20-49: 1)
Other Services (except Public Administration): Religious Organizations (10-19: 1, 1-4: 3)
People in group quarters in 2010:
6 people in group homes intended for adults
People in group quarters in 2000:
5 people in other noninstitutional group quarters
3 people in homes for the mentally retarded
Fatal accident statistics in 2012:
Fatal accident count: 1
Vehicles involved in fatal accidents: 3
Fatal accidents caused by drunken drivers: 0
Fatalities: 1
Persons involved in fatal accidents: 4
Pedestrians involved in fatal accidents: 0
Fatal accident statistics in 2011:
Fatal accident count: 1
Vehicles involved in fatal accidents: 1
Fatal accidents caused by drunken drivers: 1
Fatalities: 1
Persons involved in fatal accidents: 1
Pedestrians involved in fatal accidents: 0
2006 - 2018 National Fire Incident Reporting System (NFIRS) incidents
According to the data from the years 2006 - 2018 the average number of fire incidents per year is 12. The highest number of reported fires - 25 took place in 2017, and the least - 3 in 2009. The data has a growing trend.
When looking into fire subcategories, the most incidents belonged to: Structure Fires (41.6%), and Outside Fires (31.1%).
Fire incident types reported to NFIRS in Zip Code 27849


 Nearest zip codes: 27840, 27847, 27872, 27857, 27841, 27805.


 According to the data from the years 2006 - 2018 the average number of fire incidents per year is 12. The highest number of reported fires - 25 took place in 2017, and the least - 3 in 2009. The data has a growing trend.
 When looking into fire subcategories, the most incidents belonged to: Structure Fires (41.6%), and Outside Fires (31.1%).