Estimated zip code population in 2022: 11,448 Zip code population in 2010: 11,909 Zip code population in 2000: 10,211
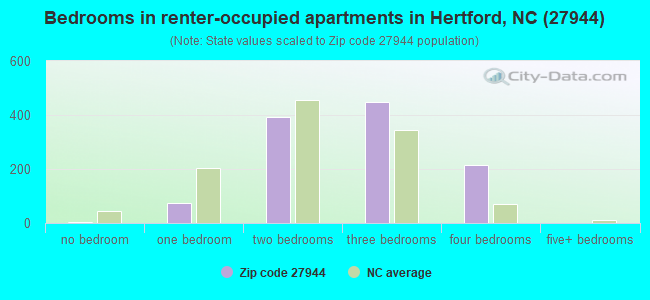
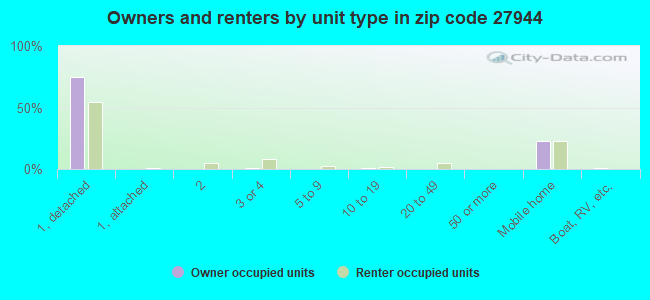
Houses and condos: 6,183 Renter-occupied apartments: 1,124
% of renters here:
22%
State:
33%
March 2022 cost of living index in zip code 27944: 82.0 (low, U.S. average is 100)
Land area: 185.1 sq. mi. Water area: 26.8 sq. mi.
Population density: 62 people per square mile
(very low).
OSM Map
General Map
Google Map
MSN Map
OSM Map
General Map
Google Map
MSN Map
OSM Map
General Map
Google Map
MSN Map
OSM Map
General Map
Google Map
MSN Map
Please wait while loading the map...
Real estate property taxes paid for housing units in 2022:
This zip code:
0.5% ($1,408)
North Carolina:
0.6% ($1,769)
Median real estate property taxes paid for housing units with mortgages in 2022: $1,499 (0.5%) Median real estate property taxes paid for housing units with no mortgage in 2022: $1,128 (0.5%)
Averages for the 2020 tax year for zip code 27944, filed in 2021:
Average Adjusted Gross Income (AGI) in 2020: $57,639 (Individual Income Tax Returns)
Here:
$57,639
State:
$70,020
Salary/wage: $45,710 (reported on 74.3% of returns)
Here:
$45,710
State:
$58,387
(% of AGI for various income ranges: 1097.0% for AGIs below $25k, 3555.8% for AGIs $25k-50k, 6327.3% for AGIs $50k-75k, 8485.0% for AGIs $75k-100k, 14032.1% for AGIs $100k-200k, 69530.0% for AGIs over 200k)
Taxable interest for individuals: $1,107 (reported on 34.3% of returns)
This zip code:
$1,107
North Carolina:
$1,479
(% of AGI for various income ranges: 16.0% for AGIs below $25k, 21.6% for AGIs $25k-50k, 51.5% for AGIs $50k-75k, 70.6% for AGIs $75k-100k, 183.9% for AGIs $100k-200k, 1413.3% for AGIs over 200k)
Ordinary dividends: $5,049 (reported on 16.9% of returns)
Here:
$5,049
State:
$7,888
(% of AGI for various income ranges: 19.7% for AGIs below $25k, 40.1% for AGIs $25k-50k, 101.5% for AGIs $50k-75k, 210.0% for AGIs $75k-100k, 510.3% for AGIs $100k-200k, 2616.7% for AGIs over 200k)
Net capital gain/loss in AGI: +$9,305 (reported on 15.5% of returns)
Here:
+$9,305
State:
+$23,652
(% of AGI for various income ranges: 5.9% for AGIs below $25k, 28.4% for AGIs $25k-50k, 104.0% for AGIs $50k-75k, 183.4% for AGIs $75k-100k, 697.1% for AGIs $100k-200k, 12100.0% for AGIs over 200k)
Profit/loss from business: +$10,502 (reported on 17.2% of returns)
Here:
+$10,502
State:
+$11,710
(% of AGI for various income ranges: 103.5% for AGIs below $25k, 111.0% for AGIs $25k-50k, 222.7% for AGIs $50k-75k, 181.6% for AGIs $75k-100k, 531.1% for AGIs $100k-200k, 11660.0% for AGIs over 200k)
Taxable individual retirement arrangement distribution: $20,220 (reported on 12.4% of returns)
27944:
$20,220
North Carolina:
$20,247
(% of AGI for various income ranges: 52.4% for AGIs below $25k, 98.3% for AGIs $25k-50k, 344.8% for AGIs $50k-75k, 499.7% for AGIs $75k-100k, 1367.1% for AGIs $100k-200k, 10733.3% for AGIs over 200k)
Total itemized deductions: $29,425 (reported on 6.7% of returns)
Here:
$29,425
State:
$34,549
(% of AGI for various income ranges: 40.8% for AGIs below $25k, 116.6% for AGIs $25k-50k, 385.6% for AGIs $50k-75k, 344.7% for AGIs $75k-100k, 955.3% for AGIs $100k-200k, 7703.3% for AGIs over 200k)
Charity contributions: $8,820 (reported on 5.6% of returns)
Here:
$8,820
State:
$13,360
(% of AGI for various income ranges: 29.4% for AGIs $25k-50k, 60.2% for AGIs $50k-75k, 73.8% for AGIs $75k-100k, 240.8% for AGIs $100k-200k, 3060.0% for AGIs over 200k)
Taxes paid: $6,344 (reported on 6.7% of returns)
27944:
$6,344
State:
$7,586
(% of AGI for various income ranges: 6.6% for AGIs below $25k, 17.2% for AGIs $25k-50k, 61.0% for AGIs $50k-75k, 68.8% for AGIs $75k-100k, 253.7% for AGIs $100k-200k, 1826.7% for AGIs over 200k)
Earned income credit: $2,438 (reported on 19.9% of returns)
Here:
$2,438
State:
$2,337
(% of AGI for various income ranges: 133.5% for AGIs below $25k, 78.5% for AGIs $25k-50k)
Percentage of individuals using paid preparers for their 2020 taxes: 92.1%
Here:
92%
State:
93%
(% for various income ranges: 91.3% for AGIs below $25k, 93.2% for AGIs $25k-50k, 89.5% for AGIs $50k-75k, 94.2% for AGIs $75k-100k, 93.2% for AGIs $100k-200k, 93.8% for AGIs over 200k)
Averages for the 2012 tax year for zip code 27944, filed in 2013:
Average Adjusted Gross Income (AGI) in 2012: $49,971 (Individual Income Tax Returns)
Here:
$49,971
State:
$54,937
Salary/wage: $38,223 (reported on 76.7% of returns)
Here:
$38,223
State:
$46,336
(% of AGI for various income ranges: 70.1% for AGIs below $25k, 69.9% for AGIs $25k-50k, 66.7% for AGIs $50k-75k, 58.1% for AGIs $75k-100k, 47.1% for AGIs $100k-200k, 46.1% for AGIs over 200k)
Taxable interest for individuals: $955 (reported on 39.2% of returns)
This zip code:
$955
North Carolina:
$1,298
(% of AGI for various income ranges: 1.1% for AGIs below $25k, 0.8% for AGIs $25k-50k, 0.7% for AGIs $50k-75k, 0.7% for AGIs $75k-100k, 0.6% for AGIs $100k-200k, 0.9% for AGIs over 200k)
Ordinary dividends: $4,340 (reported on 19.2% of returns)
Here:
$4,340
State:
$6,213
(% of AGI for various income ranges: 1.1% for AGIs below $25k, 1.0% for AGIs $25k-50k, 1.0% for AGIs $50k-75k, 1.7% for AGIs $75k-100k, 2.7% for AGIs $100k-200k, 2.0% for AGIs over 200k)
Net capital gain/loss in AGI: +$5,832 (reported on 14.1% of returns)
Here:
+$5,832
State:
+$12,740
(% of AGI for various income ranges: 0.2% for AGIs $25k-50k, 0.2% for AGIs $50k-75k, 0.9% for AGIs $75k-100k, 1.8% for AGIs $100k-200k, 7.4% for AGIs over 200k)
Profit/loss from business: +$7,401 (reported on 15.7% of returns)
Here:
+$7,401
State:
+$10,311
(% of AGI for various income ranges: 5.9% for AGIs below $25k, 2.5% for AGIs $25k-50k, 1.8% for AGIs $50k-75k, 2.2% for AGIs $75k-100k, 1.7% for AGIs $100k-200k, 1.4% for AGIs over 200k)
Taxable individual retirement arrangement distribution: $16,646 (reported on 13.3% of returns)
27944:
$16,646
North Carolina:
$15,575
(% of AGI for various income ranges: 2.8% for AGIs below $25k, 3.1% for AGIs $25k-50k, 3.0% for AGIs $50k-75k, 4.3% for AGIs $75k-100k, 7.1% for AGIs $100k-200k, 4.7% for AGIs over 200k)
Self-employment retirement plans: $13,900 (reported on 0.6% of returns)
27944:
$13,900
North Carolina:
$21,078
Total itemized deductions: $21,824 (24% of AGI, reported on 31.6% of returns)
Here:
$21,824
State:
$23,438
Here:
23.8% of AGI
State:
21.5% of AGI
(% of AGI for various income ranges: 10.9% for AGIs below $25k, 11.0% for AGIs $25k-50k, 13.6% for AGIs $50k-75k, 16.5% for AGIs $75k-100k, 16.2% for AGIs $100k-200k, 12.6% for AGIs over 200k)
Charity contributions: $4,069 (reported on 26.3% of returns)
Here:
$4,069
State:
$4,687
(% of AGI for various income ranges: 1.0% for AGIs below $25k, 1.4% for AGIs $25k-50k, 2.0% for AGIs $50k-75k, 3.0% for AGIs $75k-100k, 3.0% for AGIs $100k-200k, 1.7% for AGIs over 200k)
Taxes paid: $6,599 (reported on 31.6% of returns)
27944:
$6,599
State:
$8,823
(% of AGI for various income ranges: 1.4% for AGIs below $25k, 2.1% for AGIs $25k-50k, 3.2% for AGIs $50k-75k, 4.4% for AGIs $75k-100k, 5.9% for AGIs $100k-200k, 6.8% for AGIs over 200k)
Earned income credit: $2,513 (reported on 22.7% of returns)
Here:
$2,513
State:
$2,376
(% of AGI for various income ranges: 8.7% for AGIs below $25k, 1.3% for AGIs $25k-50k)
Percentage of individuals using paid preparers for their 2012 taxes: 48.2%
Here:
48%
State:
53%
(% for various income ranges: 41.2% for AGIs below $25k, 43.6% for AGIs $25k-50k, 56.8% for AGIs $50k-75k, 55.3% for AGIs $75k-100k, 63.6% for AGIs $100k-200k, 77.8% for AGIs over 200k)
Averages for the 2004 tax year for zip code 27944, filed in 2005:
Average Adjusted Gross Income (AGI) in 2004: $38,020 (Individual Income Tax Returns)
Here:
$38,020
State:
$45,376
Salary/wage: $30,515 (reported on 79.8% of returns)
Here:
$30,515
State:
$39,442
(% of AGI for various income ranges: 147.6% for AGIs below $10k, 70.9% for AGIs $10k-25k, 72.2% for AGIs $25k-50k, 68.6% for AGIs $50k-75k, 59.2% for AGIs $75k-100k, 47.4% for AGIs over 100k)
Taxable interest for individuals: $1,365 (reported on 44.3% of returns)
This zip code:
$1,365
North Carolina:
$1,515
(% of AGI for various income ranges: 10.9% for AGIs below $10k, 2.2% for AGIs $10k-25k, 1.5% for AGIs $25k-50k, 1.0% for AGIs $50k-75k, 1.4% for AGIs $75k-100k, 1.4% for AGIs over 100k)
Taxable dividends: $2,637 (reported on 19.6% of returns)
Here:
$2,637
State:
$4,016
(% of AGI for various income ranges: 2.5% for AGIs below $10k, 1.3% for AGIs $10k-25k, 0.7% for AGIs $25k-50k, 0.8% for AGIs $50k-75k, 1.7% for AGIs $75k-100k, 2.2% for AGIs over 100k)
Net capital gain/loss: +$13,890 (reported on 17.5% of returns)
Here:
+$13,890
State:
+$11,152
(% of AGI for various income ranges: -2.3% for AGIs below $10k, 0.9% for AGIs $10k-25k, 1.7% for AGIs $25k-50k, 1.7% for AGIs $50k-75k, 2.7% for AGIs $75k-100k, 19.8% for AGIs over 100k)
Profit/loss from business: +$7,434 (reported on 16.8% of returns)
Here:
+$7,434
State:
+$9,490
(% of AGI for various income ranges: 7.7% for AGIs below $10k, 6.2% for AGIs $10k-25k, 3.1% for AGIs $25k-50k, 2.7% for AGIs $50k-75k, 3.4% for AGIs $75k-100k, 2.2% for AGIs over 100k)
Profit/loss from farming: +$6,071 (reported on 2.2% of returns)
Here:
+$6,071
State:
-$3,231
(% of AGI for various income ranges: -0.2% for AGIs $10k-25k, 0.7% for AGIs $25k-50k, 1.0% for AGIs $50k-75k, 0.1% for AGIs $75k-100k)
IRA payment deduction: $3,176 (reported on 2.7% of returns)
27944:
$3,176
North Carolina:
$2,967
(% of AGI for various income ranges: 0.2% for AGIs $10k-25k, 0.2% for AGIs $25k-50k, 0.3% for AGIs $50k-75k, 0.3% for AGIs $75k-100k, 0.2% for AGIs over 100k)
Self-employed pension: $8,706 (reported on 0.4% of returns)
Here:
$8,706
North Carolina:
$14,754
Total itemized deductions: $17,076 (23% of AGI, reported on 27.5% of returns)
Here:
$17,076
State:
$19,464
Here:
23.2% of AGI
State:
22.7% of AGI
(% of AGI for various income ranges: 15.2% for AGIs below $10k, 8.3% for AGIs $10k-25k, 9.6% for AGIs $25k-50k, 13.7% for AGIs $50k-75k, 15.7% for AGIs $75k-100k, 13.5% for AGIs over 100k)
Charity contributions deductions: $3,480 (5% of AGI, reported on 24.7% of returns)
Here:
$3,480
State:
$4,035
Here:
4.6% of AGI
State:
4.5% of AGI
(% of AGI for various income ranges: 1.3% for AGIs below $10k, 1.2% for AGIs $10k-25k, 1.4% for AGIs $25k-50k, 2.7% for AGIs $50k-75k, 2.9% for AGIs $75k-100k, 2.9% for AGIs over 100k)
Total tax: $5,273 (reported on 70.8% of returns)
27944:
$5,273
State:
$7,257
(% of AGI for various income ranges: 4.3% for AGIs below $10k, 3.6% for AGIs $10k-25k, 6.5% for AGIs $25k-50k, 8.8% for AGIs $50k-75k, 10.8% for AGIs $75k-100k, 16.5% for AGIs over 100k)
Earned income credit: $1,904 (reported on 21.3% of returns)
Here:
$1,904
State:
$1,851
Percentage of individuals using paid preparers for their 2004 taxes: 60.9%
Here:
61%
State:
62%
(% for various income ranges: 56.7% for AGIs below $10k, 61.1% for AGIs $10k-25k, 57.7% for AGIs $25k-50k, 67.9% for AGIs $50k-75k, 60.9% for AGIs $75k-100k, 72.8% for AGIs over 100k)
Household received Food Stamps/SNAP in the past 12 months: 679 Household did not receive Food Stamps/SNAP in the past 12 months: 4,477
Women who had a birth in the past 12 months: 20 (21 now married, 0 unmarried) Women who did not have a birth in the past 12 months: 1,969 (891 now married, 1,078 unmarried)
Housing units in zip code 27944 with a mortgage: 2,255 (229 second mortgage, 224 both second mortgage and home equity loan) Houses without a mortgage: 8
Median monthly owner costs for units with a mortgage: $1,467 Median monthly owner costs for units without a mortgage: $475
Residents with income below the poverty level in 2022:
This zip code:
13.3%
Whole state:
12.8%
Residents with income below 50% of the poverty level in 2022:
This zip code:
6.9%
Whole state:
6.8%
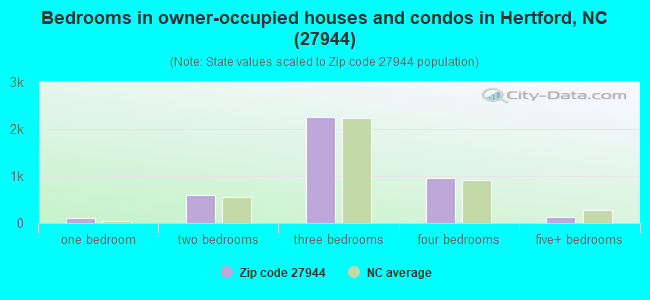
Median number of rooms in houses and condos:
Here:
6.3
State:
6.4
Median number of rooms in apartments:
Here:
5.4
State:
4.4
Notable locations in this zip code not listed on our city pages
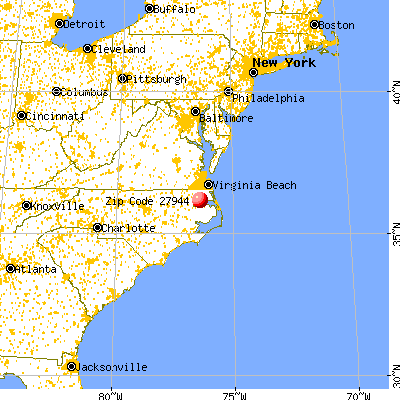
Notable locations in zip code 27944: Newby Landing (A), New Hope (B), Hertford Beach (C), Philips Landing (D), Redbank Landing (E), Hertford Wastewater Treatment Plant (F), Municipal Building (G), Perquimans County Courthouse (H), Newbold-White (I), Brian Center Health and Rehabilitation of Hertford (J), South Haven Manor (K), Winfall Police Department (L), Hertford Police Department (M), Winfall Police Department (N). Display/hide their locations on the map
Churches in zip code 27944 include: First Baptist Church of Hertford (A), Love Fellowship Church (B), Galatia Church (C), Woodland Church (D), Berea Church (E), First Gospel Tabernacle (F), Mount Sinai Church (G), Poplar Run Church (H), Cedar Grove Church (I). Display/hide their locations on the map
Cemeteries: Harvey Cemetery (1), Nixon Cemetery (2), Godfrey Cemetery (3), Wilson Cemetery (4), Jackson Cemetery (5), Cedarwood Cemetery (6), Philips Cemetery (7). Display/hide their locations on the map
Streams, rivers, and creeks: Deep Creek (A), Great Run Swamp (B), Bethel Creek (C), Raccoon Creek (D), Sutton Creek (E), Yeopim Creek (F), Bagley Swamp (G), Goodwin Creek (H), Middleton Creek (I). Display/hide their locations on the map
In group quarters: 95 (-1 institutionalized population)
Size of family households: 2,332 2-persons, 562 3-persons, 407 4-persons, 189 5-persons, 72 6-persons, 26 7-or-more-persons
Size of nonfamily households: 1,485 1-person, 70 2-persons, 26 3-persons
885 married couples with children.
667 single-parent households (226 men, 441 women).
96.4% of residents of 27944 zip code speak English at home.
2.8% of residents speak Spanish at home (100% very well).
0.7% of residents speak other Indo-European language at home (89% very well, 11% well).
0.5% of residents speak Asian or Pacific Island language at home (35% very well, 33% well, 33% not well).
0.1% of residents speak other language at home (25% very well, 33% well, 42% not well).
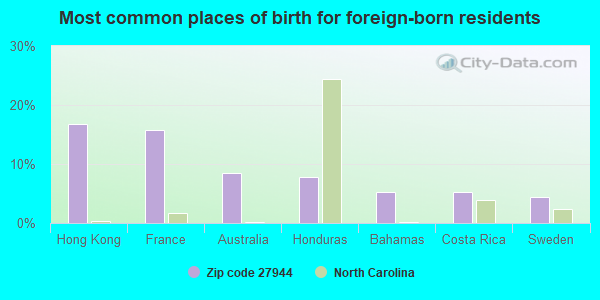
Foreign born population: 319 (2.8%) (64.5% of them are naturalized citizens)
This zip code:
2.8%
Whole state:
8.6%
16%Costa Rica
15%France
13%Sweden
12%Australia
10%Hong Kong
10%Honduras
4%United Kingdom, excluding England and Scotland
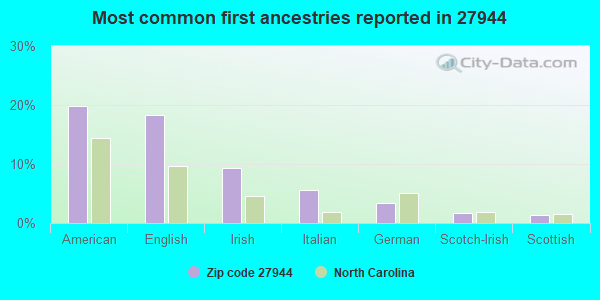
20%American
18%English
9%Irish
6%Italian
3%German
2%Scotch-Irish
1%Scottish
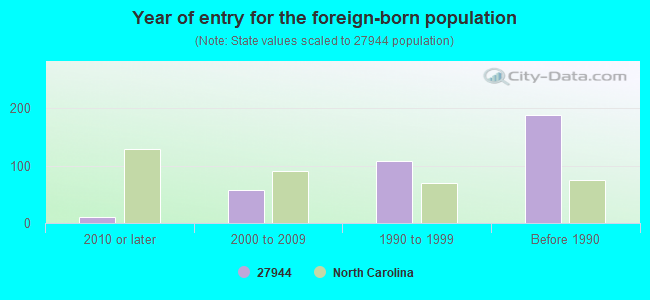
Year of entry for the foreign-born population
112010 or later
582000 to 2009
1081990 to 1999
188Before 1990
Facilities with environmental interests located in this zip code:
ALBEMARLE FERTILIZER INACTIVE (ALBEMARLE STREET in WINFALL, NC)
AIR MINOR (AIRS/AFS) STATE MASTER (North Carolina facility info) - AIR PROGRAM Business SIC classification: FERTILIZERS, MIXING ONLY Business NAICS classification: FERTILIZER (MIXING ONLY) MANUFACTURING.
C B & DOG SUPPLY (125 CHURCH ST in HERTFORD, NC)
(Integrated Compliance Information System) - ICIS-04-2001-0162, FORMAL ENFORCEMENT ACTION COMPLIANCE ACTIVITY (Tracking inspections of insecticide, fungicide, and rodenticide, and toxic substances) Alternative names: CB & DOG SUPPLY
BENGE ENTERPRISE (GRUBB ST EXT in HERTFORD, NC)
(Resource Conservation and Recovery Act (tracking hazardous waste))
Housing units lacking complete plumbing facilities: 2.0% Housing units lacking complete kitchen facilities: 1.6%
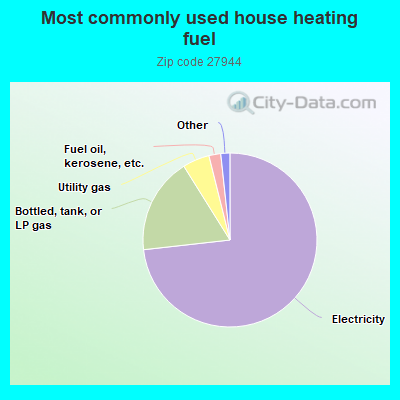
73.3%Electricity
17.9%Bottled, tank, or LP gas
5.0%Utility gas
2.2%Fuel oil, kerosene, etc.
0.8%Other fuel
0.7%Wood
Population in 1990: 9,357. Population change in the 1990s: +854 (+9.1%).
Place of birth for U.S.-born residents:
This state: 5,935
Northeast: 1,672
Midwest: 707
South: 2,536
West: 200
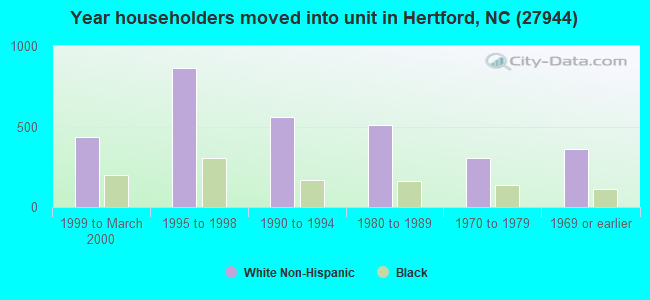
59% of the 27944 zip code residents lived in the same house 5 years ago. Out of people who lived in different houses, 35% lived in this county. Out of people who lived in different counties, 50% lived in North Carolina.
85% of the 27944 zip code residents lived in the same house 1 year ago. Out of people who lived in different houses, 20% moved from this county. Out of people who lived in different houses, 35% moved from different county within same state. Out of people who lived in different houses, 47% moved from different state. Out of people who lived in different houses, 0% moved from abroad.
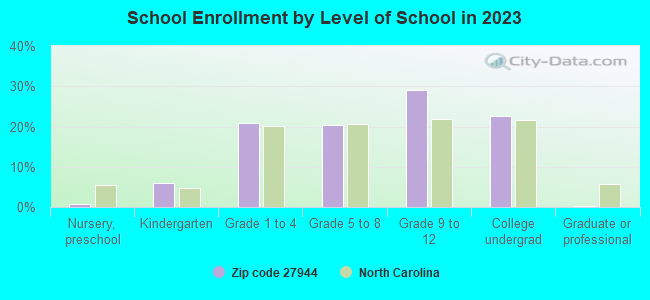
Private vs. public school enrollment:
Students in private schools in grades 1 to 8 (elementary and middle school): 140
Here:
17.3%
North Carolina:
13.8%
Students in private schools in grades 9 to 12 (high school): 18
Here:
4.3%
North Carolina:
11.9%
Students in private undergraduate colleges: 3
Here:
0.9%
North Carolina:
19.3%
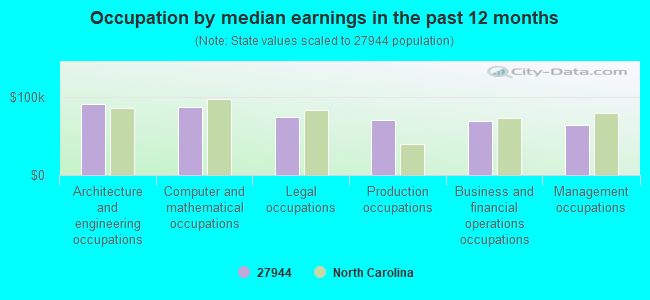
Occupation by median earnings in the past 12 months ($)
91,454Architecture and engineering occupations
87,737Computer and mathematical occupations
75,092Legal occupations
70,814Production occupations
69,908Business and financial operations occupations
64,514Management occupations
Companies with federal contracts located in this zip code:
CECIL JAMES CONCRETE CONTRACTO (434 WOODWILL RD in HERTFORD, NC; small business) 2 employees, $120000 revenue. Small Disadvantaged Business
$5,000 with United States Coast Guard (disused code: now 7008) for Maintenance, Repair or Alteration of Real Property -- Other Non-Building Facilities. Signed on 2001-07-15. Completion date: 2001-08-15.
Top industries in this zip code by the number of employees in 2005:
Health Care and Social Assistance: Child Day Care Services (20-49: 1, 5-9: 1, 1-4: 2)
Other Services (except Public Administration): Religious Organizations (5-9: 4, 1-4: 7)
People in group quarters in 2010:
62 people in nursing facilities/skilled-nursing facilities
12 people in workers' group living quarters and job corps centers
10 people in correctional facilities intended for juveniles
People in group quarters in 2000:
103 people in nursing homes
6 people in other group homes
6 people in other nonhousehold living situations
Fatal accident statistics in 2013:
Fatal accident count: 3
Vehicles involved in fatal accidents: 5
Fatal accidents caused by drunken drivers: 1
Fatalities: 5
Persons involved in fatal accidents: 7
Pedestrians involved in fatal accidents: 0
Fatal accident statistics in 2011:
Fatal accident count: 2
Vehicles involved in fatal accidents: 3
Fatal accidents caused by drunken drivers: 1
Fatalities: 2
Persons involved in fatal accidents: 4
Pedestrians involved in fatal accidents: 0
2002 - 2018 National Fire Incident Reporting System (NFIRS) incidents
According to the data from the years 2002 - 2018 the average number of fires per year is 49. The highest number of reported fire incidents - 78 took place in 2008, and the least - 10 in 2002. The data has a rising trend.
When looking into fire subcategories, the most reports belonged to: Structure Fires (42.8%), and Outside Fires (35.8%).
Fire incident types reported to NFIRS in Zip Code 27944


+$6,071
-$3,231
(% of AGI for various income ranges: -0.2% for AGIs $10k-25k, 0.7% for AGIs $25k-50k, 1.0% for AGIs $50k-75k, 0.1% for AGIs $75k-100k) Nearest zip codes: 27985, 27919, 27909, 27932, 27980, 27946.


 According to the data from the years 2002 - 2018 the average number of fires per year is 49. The highest number of reported fire incidents - 78 took place in 2008, and the least - 10 in 2002. The data has a rising trend.
 When looking into fire subcategories, the most reports belonged to: Structure Fires (42.8%), and Outside Fires (35.8%).