Estimated zip code population in 2022: 4,614 Zip code population in 2010: 5,562 Zip code population in 2000: 5,432
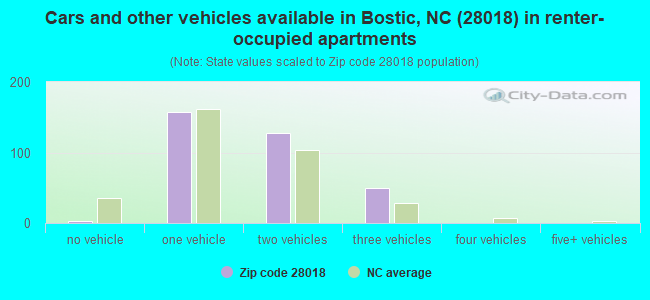
Houses and condos: 2,717 Renter-occupied apartments: 334
% of renters here:
15%
State:
33%
March 2022 cost of living index in zip code 28018: 79.5 (low, U.S. average is 100)
Land area: 99.3 sq. mi. Water area: 0.1 sq. mi.
Population density: 46 people per square mile
(very low).
OSM Map
General Map
Google Map
MSN Map
OSM Map
General Map
Google Map
MSN Map
OSM Map
General Map
Google Map
MSN Map
OSM Map
General Map
Google Map
MSN Map
Please wait while loading the map...
Real estate property taxes paid for housing units in 2022:
This zip code:
0.6% ($1,009)
North Carolina:
0.6% ($1,769)
Median real estate property taxes paid for housing units with mortgages in 2022: $1,300 (0.6%) Median real estate property taxes paid for housing units with no mortgage in 2022: $677 (0.5%)
Averages for the 2020 tax year for zip code 28018, filed in 2021:
Average Adjusted Gross Income (AGI) in 2020: $50,057 (Individual Income Tax Returns)
Here:
$50,057
State:
$70,020
Salary/wage: $44,790 (reported on 80.1% of returns)
Here:
$44,790
State:
$58,387
(% of AGI for various income ranges: 1122.3% for AGIs below $25k, 3662.6% for AGIs $25k-50k, 6434.6% for AGIs $50k-75k, 10100.7% for AGIs $75k-100k, 15012.5% for AGIs $100k-200k)
Taxable interest for individuals: $773 (reported on 31.6% of returns)
This zip code:
$773
North Carolina:
$1,479
(% of AGI for various income ranges: 16.5% for AGIs below $25k, 21.1% for AGIs $25k-50k, 64.6% for AGIs $50k-75k, 82.9% for AGIs $75k-100k, 47.5% for AGIs $100k-200k)
Ordinary dividends: $3,300 (reported on 12.1% of returns)
Here:
$3,300
State:
$7,888
(% of AGI for various income ranges: 12.5% for AGIs below $25k, 35.1% for AGIs $25k-50k, 30.8% for AGIs $50k-75k, 180.7% for AGIs $75k-100k, 223.1% for AGIs $100k-200k)
Net capital gain/loss in AGI: +$6,058 (reported on 11.3% of returns)
Here:
+$6,058
State:
+$23,652
(% of AGI for various income ranges: 0.5% for AGIs below $25k, 29.4% for AGIs $25k-50k, 48.8% for AGIs $50k-75k, 191.4% for AGIs $75k-100k, 655.6% for AGIs $100k-200k)
Profit/loss from business: +$6,359 (reported on 16.0% of returns)
Here:
+$6,359
State:
+$11,710
(% of AGI for various income ranges: 108.3% for AGIs below $25k, 76.4% for AGIs $25k-50k, 122.9% for AGIs $50k-75k, 97.9% for AGIs $75k-100k, 570.0% for AGIs $100k-200k)
Taxable individual retirement arrangement distribution: $15,648 (reported on 11.7% of returns)
28018:
$15,648
North Carolina:
$20,247
(% of AGI for various income ranges: 99.3% for AGIs below $25k, 115.5% for AGIs $25k-50k, 310.4% for AGIs $50k-75k, 307.1% for AGIs $75k-100k, 1194.4% for AGIs $100k-200k)
Total itemized deductions: $30,888 (reported on 3.5% of returns)
Here:
$30,888
State:
$34,549
(% of AGI for various income ranges: 397.9% for AGIs $50k-75k, 947.5% for AGIs $100k-200k)
Charity contributions: $11,571 (reported on 3.0% of returns)
Here:
$11,571
State:
$13,360
(% of AGI for various income ranges: 70.4% for AGIs $50k-75k, 400.6% for AGIs $100k-200k)
Taxes paid: $7,088 (reported on 3.5% of returns)
28018:
$7,088
State:
$7,586
(% of AGI for various income ranges: 74.2% for AGIs $50k-75k, 243.1% for AGIs $100k-200k)
Earned income credit: $2,280 (reported on 19.5% of returns)
Here:
$2,280
State:
$2,337
(% of AGI for various income ranges: 104.0% for AGIs below $25k, 85.5% for AGIs $25k-50k)
Percentage of individuals using paid preparers for their 2020 taxes: 93.9%
Here:
94%
State:
93%
(% for various income ranges: 92.9% for AGIs below $25k, 93.4% for AGIs $25k-50k, 94.4% for AGIs $50k-75k, 95.5% for AGIs $75k-100k, 96.0% for AGIs $100k-200k, 100.0% for AGIs over 200k)
Averages for the 2012 tax year for zip code 28018, filed in 2013:
Average Adjusted Gross Income (AGI) in 2012: $39,337 (Individual Income Tax Returns)
Here:
$39,337
State:
$54,937
Salary/wage: $36,647 (reported on 78.8% of returns)
Here:
$36,647
State:
$46,336
(% of AGI for various income ranges: 65.1% for AGIs below $25k, 78.6% for AGIs $25k-50k, 78.6% for AGIs $50k-75k, 75.0% for AGIs $75k-100k, 66.1% for AGIs $100k-200k)
Taxable interest for individuals: $887 (reported on 33.7% of returns)
This zip code:
$887
North Carolina:
$1,298
(% of AGI for various income ranges: 1.5% for AGIs below $25k, 0.7% for AGIs $25k-50k, 0.5% for AGIs $50k-75k, 0.3% for AGIs $75k-100k, 1.0% for AGIs $100k-200k)
Ordinary dividends: $3,304 (reported on 12.5% of returns)
Here:
$3,304
State:
$6,213
(% of AGI for various income ranges: 1.5% for AGIs below $25k, 0.5% for AGIs $25k-50k, 0.8% for AGIs $50k-75k, 0.4% for AGIs $75k-100k, 2.2% for AGIs $100k-200k)
Net capital gain/loss in AGI: +$740 (reported on 9.6% of returns)
Here:
+$740
State:
+$12,740
(% of AGI for various income ranges: 0.3% for AGIs $25k-50k, 0.2% for AGIs $75k-100k, 0.6% for AGIs $100k-200k)
Profit/loss from business: +$7,838 (reported on 15.4% of returns)
Here:
+$7,838
State:
+$10,311
(% of AGI for various income ranges: 8.9% for AGIs below $25k, 1.4% for AGIs $25k-50k, 1.8% for AGIs $50k-75k, 3.7% for AGIs $75k-100k, 1.9% for AGIs $100k-200k)
Taxable individual retirement arrangement distribution: $11,522 (reported on 13.0% of returns)
28018:
$11,522
North Carolina:
$15,575
(% of AGI for various income ranges: 6.3% for AGIs below $25k, 3.0% for AGIs $25k-50k, 2.4% for AGIs $50k-75k, 3.8% for AGIs $75k-100k, 4.6% for AGIs $100k-200k)
Total itemized deductions: $19,790 (26% of AGI, reported on 24.0% of returns)
Here:
$19,790
State:
$23,438
Here:
26.2% of AGI
State:
21.5% of AGI
(% of AGI for various income ranges: 9.3% for AGIs below $25k, 8.3% for AGIs $25k-50k, 11.6% for AGIs $50k-75k, 14.0% for AGIs $75k-100k, 17.1% for AGIs $100k-200k)
Charity contributions: $4,933 (reported on 20.2% of returns)
Here:
$4,933
State:
$4,687
(% of AGI for various income ranges: 1.7% for AGIs below $25k, 1.4% for AGIs $25k-50k, 2.5% for AGIs $50k-75k, 3.0% for AGIs $75k-100k, 4.0% for AGIs $100k-200k)
Taxes paid: $5,794 (reported on 24.0% of returns)
28018:
$5,794
State:
$8,823
(% of AGI for various income ranges: 1.2% for AGIs below $25k, 2.1% for AGIs $25k-50k, 3.0% for AGIs $50k-75k, 4.2% for AGIs $75k-100k, 6.7% for AGIs $100k-200k)
Earned income credit: $2,236 (reported on 24.0% of returns)
Here:
$2,236
State:
$2,376
(% of AGI for various income ranges: 7.3% for AGIs below $25k, 1.5% for AGIs $25k-50k)
Percentage of individuals using paid preparers for their 2012 taxes: 63.5%
Here:
63%
State:
53%
(% for various income ranges: 60.2% for AGIs below $25k, 63.0% for AGIs $25k-50k, 67.7% for AGIs $50k-75k, 72.2% for AGIs $75k-100k, 66.7% for AGIs $100k-200k)
Averages for the 2004 tax year for zip code 28018, filed in 2005:
Average Adjusted Gross Income (AGI) in 2004: $33,766 (Individual Income Tax Returns)
Here:
$33,766
State:
$45,376
Salary/wage: $31,752 (reported on 84.5% of returns)
Here:
$31,752
State:
$39,442
(% of AGI for various income ranges: 104.1% for AGIs below $10k, 74.2% for AGIs $10k-25k, 83.2% for AGIs $25k-50k, 83.0% for AGIs $50k-75k, 85.1% for AGIs $75k-100k, 56.4% for AGIs over 100k)
Taxable interest for individuals: $1,048 (reported on 37.9% of returns)
This zip code:
$1,048
North Carolina:
$1,515
(% of AGI for various income ranges: 4.4% for AGIs below $10k, 1.8% for AGIs $10k-25k, 0.7% for AGIs $25k-50k, 0.9% for AGIs $50k-75k, 0.6% for AGIs $75k-100k, 2.3% for AGIs over 100k)
Taxable dividends: $1,781 (reported on 15.6% of returns)
Here:
$1,781
State:
$4,016
(% of AGI for various income ranges: 3.1% for AGIs below $10k, 1.2% for AGIs $10k-25k, 0.5% for AGIs $25k-50k, 0.7% for AGIs $50k-75k, 0.4% for AGIs $75k-100k, 1.6% for AGIs over 100k)
Net capital gain/loss: +$5,305 (reported on 11.2% of returns)
Here:
+$5,305
State:
+$11,152
(% of AGI for various income ranges: -0.3% for AGIs below $10k, 0.7% for AGIs $10k-25k, 0.5% for AGIs $25k-50k, 1.1% for AGIs $50k-75k, 0.5% for AGIs $75k-100k, 9.7% for AGIs over 100k)
Profit/loss from business: +$4,970 (reported on 18.1% of returns)
Here:
+$4,970
State:
+$9,490
(% of AGI for various income ranges: -14.5% for AGIs below $10k, 6.5% for AGIs $10k-25k, 3.0% for AGIs $25k-50k, 2.7% for AGIs $50k-75k, 0.8% for AGIs $75k-100k, 2.6% for AGIs over 100k)
IRA payment deduction: $2,900 (reported on 1.5% of returns)
28018:
$2,900
North Carolina:
$2,967
Total itemized deductions: $15,290 (25% of AGI, reported on 26.4% of returns)
Here:
$15,290
State:
$19,464
Here:
25.0% of AGI
State:
22.7% of AGI
(% of AGI for various income ranges: 14.7% for AGIs below $10k, 6.8% for AGIs $10k-25k, 9.9% for AGIs $25k-50k, 12.8% for AGIs $50k-75k, 15.9% for AGIs $75k-100k, 16.0% for AGIs over 100k)
Charity contributions deductions: $4,175 (6% of AGI, reported on 22.3% of returns)
Here:
$4,175
State:
$4,035
Here:
6.5% of AGI
State:
4.5% of AGI
(% of AGI for various income ranges: 1.1% for AGIs $10k-25k, 2.1% for AGIs $25k-50k, 3.4% for AGIs $50k-75k, 3.6% for AGIs $75k-100k, 4.5% for AGIs over 100k)
Total tax: $3,822 (reported on 71.4% of returns)
28018:
$3,822
State:
$7,257
(% of AGI for various income ranges: 3.6% for AGIs below $10k, 3.7% for AGIs $10k-25k, 5.9% for AGIs $25k-50k, 8.5% for AGIs $50k-75k, 9.8% for AGIs $75k-100k, 16.7% for AGIs over 100k)
Earned income credit: $1,665 (reported on 21.5% of returns)
Here:
$1,665
State:
$1,851
Percentage of individuals using paid preparers for their 2004 taxes: 71.1%
Here:
71%
State:
62%
(% for various income ranges: 66.1% for AGIs below $10k, 72.6% for AGIs $10k-25k, 70.6% for AGIs $25k-50k, 74.2% for AGIs $50k-75k, 71.2% for AGIs $75k-100k, 84.3% for AGIs over 100k)
Household received Food Stamps/SNAP in the past 12 months: 243 Household did not receive Food Stamps/SNAP in the past 12 months: 1,923
Women who had a birth in the past 12 months: 20 (21 now married, 0 unmarried) Women who did not have a birth in the past 12 months: 660 (387 now married, 274 unmarried)
Housing units in zip code 28018 with a mortgage: 761 (125 second mortgage, 62 both second mortgage and home equity loan) Houses without a mortgage: 67
Median monthly owner costs for units with a mortgage: $1,127 Median monthly owner costs for units without a mortgage: $323
Residents with income below the poverty level in 2022:
This zip code:
10.6%
Whole state:
12.8%
Residents with income below 50% of the poverty level in 2022:
This zip code:
6.3%
Whole state:
6.8%
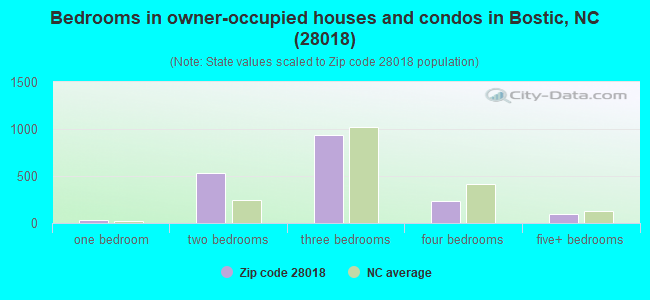
Median number of rooms in houses and condos:
Here:
6.0
State:
6.4
Median number of rooms in apartments:
Here:
4.9
State:
4.4
Notable locations in this zip code not listed on our city pages
Churches in zip code 28018 include: Missionary Church (A), Mount View Church (B), New Vernon Church (C), Carson Chapel (D), Cherry Mountain Church (E), Cooper Springs Church (F), Concord Baptist Church (G), Walls Church (H), Salem Church (I). Display/hide their locations on the map
Cemeteries: Bostic Cemetery (1), Fortune Cemetery (2), Salem Cemetery (3), Walls Cemetery (4), Mount Lebanon Cemetery (5), Golden Valley Cemetery (6). Display/hide their locations on the map
Streams, rivers, and creeks: Devils Fork (A), Collins Creek (B), Buck Hollow Branch (C), Buck Branch (D), Big Branch (E), Allen Branch (F), Three Springs Branch (G), Sudlow Branch (H), South Creek (I). Display/hide their locations on the map
In group quarters: 61 (-1 institutionalized population)
Size of family households: 1,037 2-persons, 262 3-persons, 157 4-persons, 39 5-persons, 42 6-persons
Size of nonfamily households: 529 1-person, 112 2-persons
396 married couples with children.
254 single-parent households (168 men, 86 women).
97.9% of residents of 28018 zip code speak English at home.
2.3% of residents speak Spanish at home (69% very well, 31% well).
0.1% of residents speak Asian or Pacific Island language at home (40% very well, 60% well).
0.1% of residents speak other language at home (75% very well, 25% well).
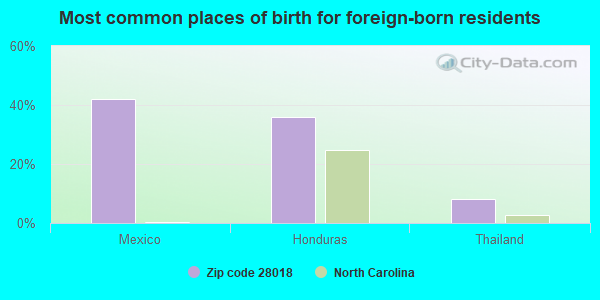
Foreign born population: 52 (1.1%) (84.3% of them are naturalized citizens)
This zip code:
1.1%
Whole state:
8.6%
42%Mexico
36%Honduras
8%Thailand
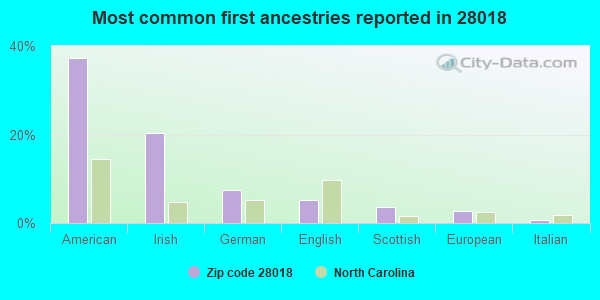
37%American
20%Irish
8%German
5%English
4%Scottish
3%European
1%Italian
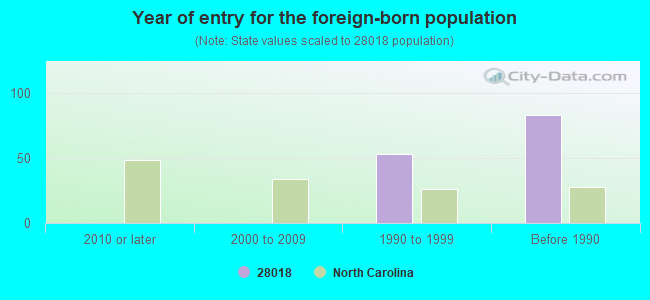
Year of entry for the foreign-born population
02010 or later
02000 to 2009
531990 to 1999
83Before 1990
Housing units lacking complete plumbing facilities: 4.7% Housing units lacking complete kitchen facilities: 3.2%
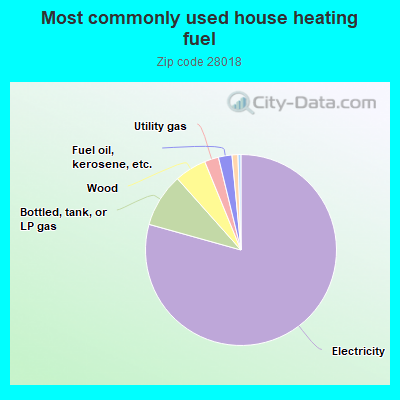
79.5%Electricity
9.1%Bottled, tank, or LP gas
5.4%Wood
2.4%Utility gas
2.3%Fuel oil, kerosene, etc.
1.0%No fuel used
Population in 1990: 3,094. Population change in the 1990s: +2,338 (+75.6%).
Place of birth for U.S.-born residents:
This state: 3,196
Northeast: 207
Midwest: 296
South: 590
West: 137
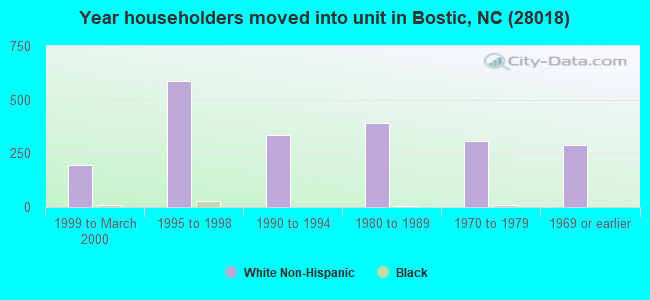
63% of the 28018 zip code residents lived in the same house 5 years ago. Out of people who lived in different houses, 75% lived in this county. Out of people who lived in different counties, 50% lived in North Carolina.
93% of the 28018 zip code residents lived in the same house 1 year ago. Out of people who lived in different houses, 21% moved from this county. Out of people who lived in different houses, 59% moved from different county within same state. Out of people who lived in different houses, 30% moved from different state.
Private vs. public school enrollment:
Students in private schools in grades 1 to 8 (elementary and middle school): 115
Here:
37.7%
North Carolina:
13.8%
Students in private schools in grades 9 to 12 (high school): 20
Here:
22.1%
North Carolina:
11.9%
Students in private undergraduate colleges: 1
Here:
1.7%
North Carolina:
19.3%
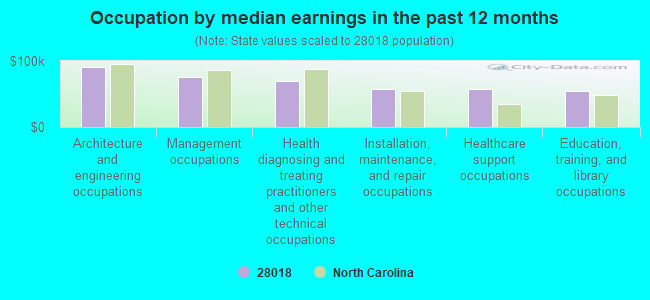
Occupation by median earnings in the past 12 months ($)
91,058Architecture and engineering occupations
75,314Management occupations
69,786Health diagnosing and treating practitioners and other technical occupations
58,309Installation, maintenance, and repair occupations
58,189Healthcare support occupations
54,212Education, training, and library occupations
Top industries in this zip code by the number of employees in 2005:
Health Care and Social Assistance: Nursing Care Facilities (50-99 employees: 1 establishment)
Other Services (except Public Administration): Religious Organizations (5-9: 4, 1-4: 10)
Administrative and Support and Waste Management and Remediation Services: Janitorial Services (10-19: 1, 1-4: 1)
Construction: New Single-Family Housing Construction (except Operative Builders) (5-9: 1, 1-4: 2)
Construction: Poured Concrete Foundation and Structure Contractors (5-9: 1)
People in group quarters in 2010:
63 people in nursing facilities/skilled-nursing facilities
People in group quarters in 2000:
101 people in nursing homes
Fatal accident statistics in 2014:
Fatal accident count: 2
Vehicles involved in fatal accidents: 3
Fatal accidents caused by drunken drivers: 1
Fatalities: 2
Persons involved in fatal accidents: 3
Pedestrians involved in fatal accidents: 0
Fatal accident statistics in 2013:
Fatal accident count: 2
Vehicles involved in fatal accidents: 2
Fatal accidents caused by drunken drivers: 0
Fatalities: 2
Persons involved in fatal accidents: 3
Pedestrians involved in fatal accidents: 0
2003 - 2018 National Fire Incident Reporting System (NFIRS) incidents
According to the data from the years 2003 - 2018 the average number of fire incidents per year is 35. The highest number of fire incidents - 66 took place in 2016, and the least - 0 in 2004. The data has a growing trend.
When looking into fire subcategories, the most reports belonged to: Outside Fires (45.6%), and Structure Fires (42.0%).
Fire incident types reported to NFIRS in Zip Code 28018

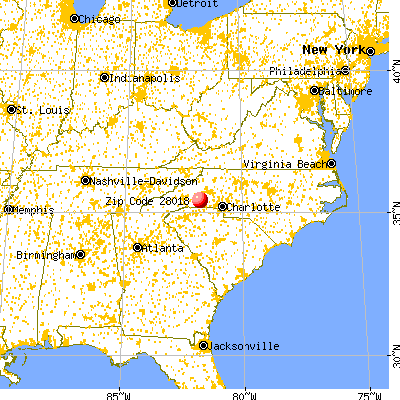


 Nearest zip codes: 28040, 28020, 28167, 28160, 28043, 28019.
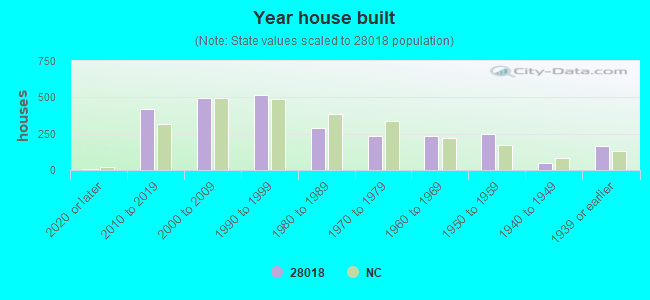


 According to the data from the years 2003 - 2018 the average number of fire incidents per year is 35. The highest number of fire incidents - 66 took place in 2016, and the least - 0 in 2004. The data has a growing trend.
 When looking into fire subcategories, the most reports belonged to: Outside Fires (45.6%), and Structure Fires (42.0%).