Estimated zip code population in 2022: 2,503 Zip code population in 2010: 2,322 Zip code population in 2000: 2,419
Houses and condos: 1,027 Renter-occupied apartments: 160
% of renters here:
21%
State:
33%
March 2022 cost of living index in zip code 28020: 80.6 (low, U.S. average is 100)
Land area: 43.6 sq. mi. Water area: 0.0 sq. mi.
Population density: 57 people per square mile
(very low).
OSM Map
General Map
Google Map
MSN Map
OSM Map
General Map
Google Map
MSN Map
OSM Map
General Map
Google Map
MSN Map
OSM Map
General Map
Google Map
MSN Map
Please wait while loading the map...
Real estate property taxes paid for housing units in 2022:
This zip code:
0.7% ($1,067)
North Carolina:
0.6% ($1,769)
Median real estate property taxes paid for housing units with mortgages in 2022: $1,100 (0.6%) Median real estate property taxes paid for housing units with no mortgage in 2022: $1,057 (1.0%)
Estimated median house/condo value in 2022: $156,128
28020:
$156,128
North Carolina:
$280,600
According to our research of North Carolina and other state lists, there were 5 registered sex offenders living in 28020 zip code as of May 28, 2024. The ratio of all residents to sex offenders in zip code 28020 is 348 to 1.
Median resident age:
This zip code:
31.9 years
North Carolina median age:
39.2 years
Average household size:
This zip code:
3.2 people
North Carolina:
2.4 people
Averages for the 2020 tax year for zip code 28020, filed in 2021:
Average Adjusted Gross Income (AGI) in 2020: $45,484 (Individual Income Tax Returns)
Here:
$45,484
State:
$70,020
Salary/wage: $44,063 (reported on 78.8% of returns)
Here:
$44,063
State:
$58,387
(% of AGI for various income ranges: 1230.4% for AGIs below $25k, 3838.2% for AGIs $25k-50k, 6120.0% for AGIs $50k-75k, 10134.3% for AGIs $75k-100k, 16751.7% for AGIs $100k-200k)
Taxable interest for individuals: $576 (reported on 27.9% of returns)
This zip code:
$576
North Carolina:
$1,479
(% of AGI for various income ranges: 5.8% for AGIs below $25k, 28.2% for AGIs $25k-50k, 20.8% for AGIs $50k-75k, 64.3% for AGIs $75k-100k, 33.3% for AGIs $100k-200k)
Ordinary dividends: $1,167 (reported on 8.7% of returns)
Here:
$1,167
State:
$7,888
(% of AGI for various income ranges: 37.7% for AGIs $25k-50k, 31.4% for AGIs $75k-100k)
Net capital gain/loss in AGI: +$4,100 (reported on 8.7% of returns)
Here:
+$4,100
State:
+$23,652
(% of AGI for various income ranges: 16.5% for AGIs below $25k, 103.3% for AGIs $50k-75k, 336.7% for AGIs $100k-200k)
Profit/loss from business: +$5,638 (reported on 12.5% of returns)
Here:
+$5,638
State:
+$11,710
(% of AGI for various income ranges: 176.9% for AGIs below $25k, 87.3% for AGIs $25k-50k, 115.7% for AGIs $75k-100k)
Taxable individual retirement arrangement distribution: $12,500 (reported on 11.5% of returns)
28020:
$12,500
North Carolina:
$20,247
(% of AGI for various income ranges: 78.5% for AGIs below $25k, 160.5% for AGIs $25k-50k, 335.8% for AGIs $50k-75k, 771.4% for AGIs $75k-100k)
Earned income credit: $2,485 (reported on 19.2% of returns)
Here:
$2,485
State:
$2,337
(% of AGI for various income ranges: 125.0% for AGIs below $25k, 78.2% for AGIs $25k-50k)
Percentage of individuals using paid preparers for their 2020 taxes: 94.2%
Here:
94%
State:
93%
(% for various income ranges: 89.5% for AGIs below $25k, 93.3% for AGIs $25k-50k, 100.0% for AGIs $50k-75k, 100.0% for AGIs $75k-100k, 100.0% for AGIs $100k-200k)
Averages for the 2012 tax year for zip code 28020, filed in 2013:
Average Adjusted Gross Income (AGI) in 2012: $39,015 (Individual Income Tax Returns)
Here:
$39,015
State:
$54,937
Salary/wage: $34,668 (reported on 81.2% of returns)
Here:
$34,668
State:
$46,336
(% of AGI for various income ranges: 65.7% for AGIs below $25k, 77.2% for AGIs $25k-50k, 78.9% for AGIs $50k-75k, 70.2% for AGIs $75k-100k, 63.3% for AGIs $100k-200k)
Taxable interest for individuals: $633 (reported on 31.2% of returns)
This zip code:
$633
North Carolina:
$1,298
(% of AGI for various income ranges: 1.0% for AGIs below $25k, 0.7% for AGIs $25k-50k, 0.3% for AGIs $50k-75k, 0.4% for AGIs $75k-100k, 0.2% for AGIs $100k-200k)
Ordinary dividends: $1,025 (reported on 8.3% of returns)
Here:
$1,025
State:
$6,213
Net capital gain/loss in AGI: +$3,900 (reported on 6.2% of returns)
Here:
+$3,900
State:
+$12,740
Profit/loss from business: +$6,673 (reported on 15.6% of returns)
Here:
+$6,673
State:
+$10,311
(% of AGI for various income ranges: 9.9% for AGIs below $25k, 2.4% for AGIs $25k-50k, 2.5% for AGIs $50k-75k)
Taxable individual retirement arrangement distribution: $12,810 (reported on 10.4% of returns)
28020:
$12,810
North Carolina:
$15,575
(% of AGI for various income ranges: 3.2% for AGIs below $25k, 4.9% for AGIs $25k-50k, 10.1% for AGIs $75k-100k)
Total itemized deductions: $17,133 (25% of AGI, reported on 21.9% of returns)
Here:
$17,133
State:
$23,438
Here:
25.2% of AGI
State:
21.5% of AGI
(% of AGI for various income ranges: 8.3% for AGIs below $25k, 6.8% for AGIs $25k-50k, 7.5% for AGIs $50k-75k, 12.9% for AGIs $75k-100k, 14.2% for AGIs $100k-200k)
Charity contributions: $3,944 (reported on 16.7% of returns)
Here:
$3,944
State:
$4,687
(% of AGI for various income ranges: 1.7% for AGIs $25k-50k, 1.4% for AGIs $50k-75k, 2.3% for AGIs $75k-100k, 2.9% for AGIs $100k-200k)
Taxes paid: $4,810 (reported on 21.9% of returns)
28020:
$4,810
State:
$8,823
(% of AGI for various income ranges: 1.0% for AGIs below $25k, 1.3% for AGIs $25k-50k, 2.3% for AGIs $50k-75k, 3.9% for AGIs $75k-100k, 5.3% for AGIs $100k-200k)
Earned income credit: $2,304 (reported on 25.0% of returns)
Here:
$2,304
State:
$2,376
(% of AGI for various income ranges: 7.8% for AGIs below $25k, 1.5% for AGIs $25k-50k)
Percentage of individuals using paid preparers for their 2012 taxes: 64.6%
Here:
65%
State:
53%
(% for various income ranges: 57.1% for AGIs below $25k, 65.4% for AGIs $25k-50k, 73.3% for AGIs $50k-75k, 75.0% for AGIs $75k-100k, 80.0% for AGIs $100k-200k)
Averages for the 2004 tax year for zip code 28020, filed in 2005:
Average Adjusted Gross Income (AGI) in 2004: $31,579 (Individual Income Tax Returns)
Here:
$31,579
State:
$45,376
Salary/wage: $30,983 (reported on 84.7% of returns)
Here:
$30,983
State:
$39,442
(% of AGI for various income ranges: 102.1% for AGIs below $10k, 76.4% for AGIs $10k-25k, 84.4% for AGIs $25k-50k, 88.9% for AGIs $50k-75k, 82.2% for AGIs $75k-100k, 59.9% for AGIs over 100k)
Taxable interest for individuals: $678 (reported on 37.2% of returns)
This zip code:
$678
North Carolina:
$1,515
(% of AGI for various income ranges: 3.8% for AGIs below $10k, 1.8% for AGIs $10k-25k, 0.4% for AGIs $25k-50k, 0.5% for AGIs $50k-75k, 1.1% for AGIs $75k-100k, 0.2% for AGIs over 100k)
Taxable dividends: $904 (reported on 10.7% of returns)
Here:
$904
State:
$4,016
(% of AGI for various income ranges: 0.3% for AGIs below $10k, 0.6% for AGIs $10k-25k, 0.3% for AGIs $25k-50k, 0.1% for AGIs $50k-75k, 0.7% for AGIs $75k-100k)
Net capital gain/loss: +$1,451 (reported on 6.7% of returns)
Here:
+$1,451
State:
+$11,152
(% of AGI for various income ranges: 0.2% for AGIs $10k-25k, 0.3% for AGIs $25k-50k, 0.1% for AGIs $50k-75k, 1.1% for AGIs $75k-100k)
Profit/loss from business: +$6,400 (reported on 17.4% of returns)
Here:
+$6,400
State:
+$9,490
(% of AGI for various income ranges: 3.4% for AGIs below $10k, 6.9% for AGIs $10k-25k, 2.9% for AGIs $25k-50k, 1.4% for AGIs $50k-75k, 7.4% for AGIs $75k-100k)
IRA payment deduction: $1,600 (reported on 0.9% of returns)
28020:
$1,600
North Carolina:
$2,967
Total itemized deductions: $14,091 (24% of AGI, reported on 21.8% of returns)
Here:
$14,091
State:
$19,464
Here:
24.5% of AGI
State:
22.7% of AGI
(% of AGI for various income ranges: 6.2% for AGIs $10k-25k, 7.0% for AGIs $25k-50k, 12.3% for AGIs $50k-75k, 14.0% for AGIs $75k-100k, 14.2% for AGIs over 100k)
Charity contributions deductions: $3,264 (5% of AGI, reported on 18.6% of returns)
Here:
$3,264
State:
$4,035
Here:
5.4% of AGI
State:
4.5% of AGI
(% of AGI for various income ranges: 0.8% for AGIs $10k-25k, 1.3% for AGIs $25k-50k, 2.4% for AGIs $50k-75k, 3.1% for AGIs $75k-100k, 3.9% for AGIs over 100k)
Total tax: $3,350 (reported on 73.0% of returns)
28020:
$3,350
State:
$7,257
(% of AGI for various income ranges: 4.1% for AGIs below $10k, 3.8% for AGIs $10k-25k, 6.5% for AGIs $25k-50k, 8.4% for AGIs $50k-75k, 11.0% for AGIs $75k-100k, 15.5% for AGIs over 100k)
Earned income credit: $1,683 (reported on 22.6% of returns)
Here:
$1,683
State:
$1,851
Percentage of individuals using paid preparers for their 2004 taxes: 75.5%
Here:
75%
State:
62%
(% for various income ranges: 67.5% for AGIs below $10k, 78.1% for AGIs $10k-25k, 76.9% for AGIs $25k-50k, 76.6% for AGIs $50k-75k, 74.1% for AGIs $75k-100k, 100.0% for AGIs over 100k)
Household received Food Stamps/SNAP in the past 12 months: 209 Household did not receive Food Stamps/SNAP in the past 12 months: 580
Women who had a birth in the past 12 months: 79 (82 now married, 0 unmarried) Women who did not have a birth in the past 12 months: 543 (278 now married, 265 unmarried)
Housing units in zip code 28020 with a mortgage: 193 (8 second mortgage, 8 both second mortgage and home equity loan) Houses without a mortgage: 4
Median monthly owner costs for units with a mortgage: $1,168 Median monthly owner costs for units without a mortgage: $365
Residents with income below the poverty level in 2022:
This zip code:
13.4%
Whole state:
12.8%
Residents with income below 50% of the poverty level in 2022:
This zip code:
5.9%
Whole state:
6.8%
Median number of rooms in houses and condos:
Here:
6.1
State:
6.4
Median number of rooms in apartments:
Here:
4.4
State:
4.4
Notable locations in this zip code not listed on our city pages
Churches in zip code 28020 include: Lee Chapel (A), Mount Moriah Church (B), Mount Pleasant Church (C), Mount Zion Church (D), New Home Church (E), Zoar Church (F), Corinth Church (G), Pisgah Church (H), Morris Memorial Church (I). Display/hide their locations on the map
Streams, rivers, and creeks: Cox Creek (A), Brier Creek (B), Bald Knob Creek (C), Tim Creek (D), No Business Creek (E), Parker Branch (F), Mountain Creek (G). Display/hide their locations on the map
In group quarters: 1 (-1 institutionalized population)
Size of family households: 315 2-persons, 111 3-persons, 117 4-persons, 48 5-persons, 16 7-or-more-persons
Size of nonfamily households: 145 1-person, 3 2-persons, 18 4-persons
419 married couples with children.
70 single-parent households (9 men, 61 women).
98.6% of residents of 28020 zip code speak English at home.
0.7% of residents speak Spanish at home (100% very well).
Foreign born population: 0 (0.0%)
:
0.0%
Whole state:
8.6%
36%American
23%Irish
10%European
10%English
5%Polish
3%German
2%Scotch-Irish
Facilities with environmental interests located in this zip code:
CASAR ELEM SCH OF THE ARTS (436 SCHOOLHOUSE RD in CASAR, NC)
(National Center for Education Statistics) - STATE ID-320 Organizations: CLEVELAND COUNTY SCHOOLS (SCHOOL DISTRICT)
CASAR ELEMENTARY SCHOOL WWTP (436 SCHOOL HOUSE RD in CASAR, NC)
National Pollutant Discharge Elimination System NON-MAJOR (Tracking pollutant discharge elimination systems) - permit Business SIC classification: ELEMENTARY AND SECONDARY SCHOOLS Alternative names: CLEVELAND CO. SCH-CASAR ELEM
Housing units lacking complete plumbing facilities: 0.2% Housing units lacking complete kitchen facilities: 0.2%
78.9%Electricity
10.9%Fuel oil, kerosene, etc.
9.2%Wood
1.1%Bottled, tank, or LP gas
Population in 1990: 1,646. Population change in the 1990s: +773 (+47.0%).
Place of birth for U.S.-born residents:
This state: 2,113
Northeast: 93
Midwest: 38
South: 192
West: 24
66% of the 28020 zip code residents lived in the same house 5 years ago. Out of people who lived in different houses, 68% lived in this county. Out of people who lived in different counties, 50% lived in North Carolina.
95% of the 28020 zip code residents lived in the same house 1 year ago. Out of people who lived in different houses, 30% moved from this county. Out of people who lived in different houses, 65% moved from different county within same state. Out of people who lived in different houses, 16% moved from different state.
Private vs. public school enrollment:
Students in private schools in grades 1 to 8 (elementary and middle school): 164
Here:
54.5%
North Carolina:
13.8%
Students in private schools in grades 9 to 12 (high school): 19
Here:
18.4%
North Carolina:
11.9%
Students in private undergraduate colleges:
Here:
3.3%
North Carolina:
19.3%
Occupation by median earnings in the past 12 months ($)
88,857Management occupations
71,372Health diagnosing and treating practitioners and other technical occupations
70,136Education, training, and library occupations
49,056Production occupations
35,052Transportation occupations
34,789Material moving occupations
Top industries in this zip code by the number of employees in 2005:
Wholesale Trade: Recyclable Material Merchant Wholesalers (20-49 employees: 1 establishment)
Administrative and Support and Waste Management and Remediation Services: All Other Support Services (10-19: 1)
Other Services (except Public Administration): Religious Organizations (1-4: 5)
Accommodation and Food Services: Recreational and Vacation Camps (except Campgrounds) (1-4: 1)
Fatal accident statistics in 2011:
Fatal accident count: 1
Vehicles involved in fatal accidents: 1
Fatal accidents caused by drunken drivers: 0
Fatalities: 1
Persons involved in fatal accidents: 2
Pedestrians involved in fatal accidents: 0
Fatal accident statistics in 2010:
Fatal accident count: 1
Vehicles involved in fatal accidents: 2
Fatal accidents caused by drunken drivers: 0
Fatalities: 1
Persons involved in fatal accidents: 5
Pedestrians involved in fatal accidents: 0
2002 - 2018 National Fire Incident Reporting System (NFIRS) incidents
According to the data from the years 2002 - 2018 the average number of fire incidents per year is 20. The highest number of reported fire incidents - 41 took place in 2006, and the least - 2 in 2017. The data has a declining trend.
When looking into fire subcategories, the most reports belonged to: Outside Fires (48.8%), and Structure Fires (33.7%).
Fire incident types reported to NFIRS in Zip Code 28020

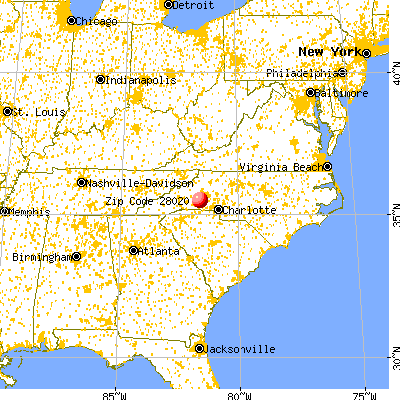


 Nearest zip codes: 28090, 28018, 28612, 28040, 28150, 28089.


 According to the data from the years 2002 - 2018 the average number of fire incidents per year is 20. The highest number of reported fire incidents - 41 took place in 2006, and the least - 2 in 2017. The data has a declining trend.
 When looking into fire subcategories, the most reports belonged to: Outside Fires (48.8%), and Structure Fires (33.7%).