Estimated zip code population in 2022: 16,046 Zip code population in 2010: 14,175 Zip code population in 2000: 12,941
Houses and condos: 6,912 Renter-occupied apartments: 1,346
% of renters here:
21%
State:
33%
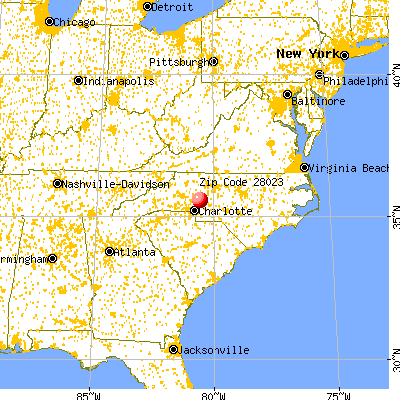
March 2022 cost of living index in zip code 28023: 81.4 (low, U.S. average is 100)
Land area: 46.3 sq. mi. Water area: 0.1 sq. mi.
Population density: 346 people per square mile
(very low).
OSM Map
General Map
Google Map
MSN Map
OSM Map
General Map
Google Map
MSN Map
OSM Map
General Map
Google Map
MSN Map
OSM Map
General Map
Google Map
MSN Map
Please wait while loading the map...
Real estate property taxes paid for housing units in 2022:
This zip code:
0.6% ($1,301)
North Carolina:
0.6% ($1,769)
Median real estate property taxes paid for housing units with mortgages in 2022: $1,477 (0.6%) Median real estate property taxes paid for housing units with no mortgage in 2022: $955 (0.6%)
Business Search- 14 Million verified businesses
Males: 7,908
(49.3%)
Females: 8,136
(50.7%)
For population 25 years and over in 28023:
High school or higher: 84.9%
Bachelor's degree or higher: 17.5%
Graduate or professional degree: 4.9%
Unemployed: 4.4%
Mean travel time to work (commute): 27.0 minutes
For population 15 years and over in 28023:
Never married: 28.1%
Now married: 53.2%
Separated: 1.3%
Widowed: 5.4%
Divorced: 12.0%
Zip code 28023 compared to state average:
Black race population percentage significantly below state average.
Renting percentage below state average.
Length of stay since moving in significantly above state average.
Percentage of population with a bachelor's degree or higher below state average.
Averages for the 2020 tax year for zip code 28023, filed in 2021:
Average Adjusted Gross Income (AGI) in 2020: $54,686 (Individual Income Tax Returns)
Here:
$54,686
State:
$70,020
Salary/wage: $49,180 (reported on 84.2% of returns)
Here:
$49,180
State:
$58,387
(% of AGI for various income ranges: 1212.7% for AGIs below $25k, 3681.1% for AGIs $25k-50k, 6823.9% for AGIs $50k-75k, 9901.3% for AGIs $75k-100k, 18345.8% for AGIs $100k-200k, 63158.0% for AGIs over 200k)
Taxable interest for individuals: $831 (reported on 26.0% of returns)
This zip code:
$831
North Carolina:
$1,479
(% of AGI for various income ranges: 10.6% for AGIs below $25k, 15.9% for AGIs $25k-50k, 27.1% for AGIs $50k-75k, 52.4% for AGIs $75k-100k, 83.8% for AGIs $100k-200k, 508.0% for AGIs over 200k)
Ordinary dividends: $2,889 (reported on 13.1% of returns)
Here:
$2,889
State:
$7,888
(% of AGI for various income ranges: 16.5% for AGIs below $25k, 20.4% for AGIs $25k-50k, 58.1% for AGIs $50k-75k, 118.2% for AGIs $75k-100k, 126.0% for AGIs $100k-200k, 1036.0% for AGIs over 200k)
Net capital gain/loss in AGI: +$8,788 (reported on 11.7% of returns)
Here:
+$8,788
State:
+$23,652
(% of AGI for various income ranges: 3.1% for AGIs below $25k, 24.8% for AGIs $25k-50k, 75.7% for AGIs $50k-75k, 143.3% for AGIs $75k-100k, 451.0% for AGIs $100k-200k, 7098.0% for AGIs over 200k)
Profit/loss from business: +$9,069 (reported on 14.9% of returns)
Here:
+$9,069
State:
+$11,710
(% of AGI for various income ranges: 137.9% for AGIs below $25k, 113.2% for AGIs $25k-50k, 154.9% for AGIs $50k-75k, 188.0% for AGIs $75k-100k, 445.4% for AGIs $100k-200k, 2404.0% for AGIs over 200k)
Taxable individual retirement arrangement distribution: $15,929 (reported on 8.5% of returns)
28023:
$15,929
North Carolina:
$20,247
(% of AGI for various income ranges: 58.9% for AGIs below $25k, 80.7% for AGIs $25k-50k, 217.7% for AGIs $50k-75k, 403.1% for AGIs $75k-100k, 600.6% for AGIs $100k-200k, 1846.0% for AGIs over 200k)
Total itemized deductions: $30,873 (reported on 5.6% of returns)
Here:
$30,873
State:
$34,549
(% of AGI for various income ranges: 101.4% for AGIs $25k-50k, 201.3% for AGIs $50k-75k, 357.3% for AGIs $75k-100k, 985.8% for AGIs $100k-200k, 5666.0% for AGIs over 200k)
Charity contributions: $11,058 (reported on 4.9% of returns)
Here:
$11,058
State:
$13,360
(% of AGI for various income ranges: 16.1% for AGIs $25k-50k, 29.9% for AGIs $50k-75k, 84.2% for AGIs $75k-100k, 341.2% for AGIs $100k-200k, 2708.0% for AGIs over 200k)
Taxes paid: $7,024 (reported on 5.6% of returns)
28023:
$7,024
State:
$7,586
(% of AGI for various income ranges: 12.9% for AGIs $25k-50k, 33.5% for AGIs $50k-75k, 86.9% for AGIs $75k-100k, 260.6% for AGIs $100k-200k, 1360.0% for AGIs over 200k)
Earned income credit: $2,244 (reported on 17.6% of returns)
Here:
$2,244
State:
$2,337
(% of AGI for various income ranges: 97.9% for AGIs below $25k, 68.0% for AGIs $25k-50k, 1.4% for AGIs $50k-75k)
Percentage of individuals using paid preparers for their 2020 taxes: 93.3%
Here:
93%
State:
93%
(% for various income ranges: 91.5% for AGIs below $25k, 95.2% for AGIs $25k-50k, 93.6% for AGIs $50k-75k, 94.1% for AGIs $75k-100k, 93.5% for AGIs $100k-200k, 93.8% for AGIs over 200k)
Averages for the 2012 tax year for zip code 28023, filed in 2013:
Average Adjusted Gross Income (AGI) in 2012: $44,467 (Individual Income Tax Returns)
Here:
$44,467
State:
$54,937
Salary/wage: $40,231 (reported on 85.6% of returns)
Here:
$40,231
State:
$46,336
(% of AGI for various income ranges: 72.2% for AGIs below $25k, 83.4% for AGIs $25k-50k, 78.8% for AGIs $50k-75k, 81.4% for AGIs $75k-100k, 76.2% for AGIs $100k-200k, 62.3% for AGIs over 200k)
Taxable interest for individuals: $758 (reported on 30.7% of returns)
This zip code:
$758
North Carolina:
$1,298
(% of AGI for various income ranges: 0.8% for AGIs below $25k, 0.6% for AGIs $25k-50k, 0.4% for AGIs $50k-75k, 0.4% for AGIs $75k-100k, 0.5% for AGIs $100k-200k, 0.7% for AGIs over 200k)
Ordinary dividends: $1,993 (reported on 15.2% of returns)
Here:
$1,993
State:
$6,213
(% of AGI for various income ranges: 1.0% for AGIs below $25k, 0.4% for AGIs $25k-50k, 0.6% for AGIs $50k-75k, 0.6% for AGIs $75k-100k, 0.6% for AGIs $100k-200k, 1.4% for AGIs over 200k)
Net capital gain/loss in AGI: +$5,443 (reported on 11.0% of returns)
Here:
+$5,443
State:
+$12,740
(% of AGI for various income ranges: 0.2% for AGIs below $25k, 0.2% for AGIs $50k-75k, 0.3% for AGIs $75k-100k, 0.5% for AGIs $100k-200k, 13.0% for AGIs over 200k)
Profit/loss from business: +$6,713 (reported on 16.5% of returns)
Here:
+$6,713
State:
+$10,311
(% of AGI for various income ranges: 8.4% for AGIs below $25k, 1.9% for AGIs $25k-50k, 1.5% for AGIs $50k-75k, 1.1% for AGIs $75k-100k, 2.8% for AGIs $100k-200k)
Taxable individual retirement arrangement distribution: $11,986 (reported on 10.5% of returns)
28023:
$11,986
North Carolina:
$15,575
(% of AGI for various income ranges: 3.8% for AGIs below $25k, 2.3% for AGIs $25k-50k, 2.9% for AGIs $50k-75k, 2.8% for AGIs $75k-100k, 4.0% for AGIs $100k-200k)
Total itemized deductions: $19,246 (24% of AGI, reported on 31.2% of returns)
Here:
$19,246
State:
$23,438
Here:
23.8% of AGI
State:
21.5% of AGI
(% of AGI for various income ranges: 8.2% for AGIs below $25k, 10.2% for AGIs $25k-50k, 13.6% for AGIs $50k-75k, 15.8% for AGIs $75k-100k, 17.6% for AGIs $100k-200k, 13.4% for AGIs over 200k)
Charity contributions: $4,433 (reported on 27.3% of returns)
Here:
$4,433
State:
$4,687
(% of AGI for various income ranges: 1.3% for AGIs below $25k, 1.7% for AGIs $25k-50k, 2.6% for AGIs $50k-75k, 3.4% for AGIs $75k-100k, 3.8% for AGIs $100k-200k, 3.4% for AGIs over 200k)
Taxes paid: $6,314 (reported on 31.2% of returns)
28023:
$6,314
State:
$8,823
(% of AGI for various income ranges: 1.3% for AGIs below $25k, 2.2% for AGIs $25k-50k, 3.8% for AGIs $50k-75k, 5.3% for AGIs $75k-100k, 7.0% for AGIs $100k-200k, 7.3% for AGIs over 200k)
Earned income credit: $2,306 (reported on 21.6% of returns)
Here:
$2,306
State:
$2,376
(% of AGI for various income ranges: 7.1% for AGIs below $25k, 1.4% for AGIs $25k-50k)
Percentage of individuals using paid preparers for their 2012 taxes: 63.9%
Here:
64%
State:
53%
(% for various income ranges: 63.0% for AGIs below $25k, 60.9% for AGIs $25k-50k, 67.8% for AGIs $50k-75k, 64.4% for AGIs $75k-100k, 67.4% for AGIs $100k-200k, 87.5% for AGIs over 200k)
Averages for the 2004 tax year for zip code 28023, filed in 2005:
Average Adjusted Gross Income (AGI) in 2004: $38,232 (Individual Income Tax Returns)
Here:
$38,232
State:
$45,376
Salary/wage: $35,738 (reported on 87.0% of returns)
Here:
$35,738
State:
$39,442
(% of AGI for various income ranges: 105.1% for AGIs below $10k, 74.9% for AGIs $10k-25k, 83.5% for AGIs $25k-50k, 84.7% for AGIs $50k-75k, 86.6% for AGIs $75k-100k, 69.3% for AGIs over 100k)
Taxable interest for individuals: $969 (reported on 37.2% of returns)
This zip code:
$969
North Carolina:
$1,515
(% of AGI for various income ranges: 3.4% for AGIs below $10k, 1.6% for AGIs $10k-25k, 0.7% for AGIs $25k-50k, 0.6% for AGIs $50k-75k, 0.9% for AGIs $75k-100k, 1.1% for AGIs over 100k)
Taxable dividends: $1,329 (reported on 18.7% of returns)
Here:
$1,329
State:
$4,016
(% of AGI for various income ranges: 2.8% for AGIs below $10k, 0.7% for AGIs $10k-25k, 0.4% for AGIs $25k-50k, 0.4% for AGIs $50k-75k, 0.7% for AGIs $75k-100k, 1.0% for AGIs over 100k)
Net capital gain/loss: +$4,523 (reported on 12.8% of returns)
Here:
+$4,523
State:
+$11,152
(% of AGI for various income ranges: -0.6% for AGIs below $10k, -0.1% for AGIs $10k-25k, 0.4% for AGIs $25k-50k, 0.9% for AGIs $50k-75k, 0.7% for AGIs $75k-100k, 6.1% for AGIs over 100k)
Profit/loss from business: +$6,637 (reported on 15.8% of returns)
Here:
+$6,637
State:
+$9,490
(% of AGI for various income ranges: 0.8% for AGIs below $10k, 4.7% for AGIs $10k-25k, 3.4% for AGIs $25k-50k, 1.7% for AGIs $50k-75k, 1.2% for AGIs $75k-100k, 3.8% for AGIs over 100k)
IRA payment deduction: $2,720 (reported on 2.1% of returns)
28023:
$2,720
North Carolina:
$2,967
(% of AGI for various income ranges: 0.2% for AGIs $10k-25k, 0.2% for AGIs $25k-50k, 0.1% for AGIs $50k-75k, 0.1% for AGIs $75k-100k, 0.2% for AGIs over 100k)
Self-employed pension: $13,182 (reported on 0.2% of returns)
Here:
$13,182
North Carolina:
$14,754
Total itemized deductions: $16,065 (25% of AGI, reported on 37.2% of returns)
Here:
$16,065
State:
$19,464
Here:
25.2% of AGI
State:
22.7% of AGI
(% of AGI for various income ranges: 12.4% for AGIs below $10k, 9.4% for AGIs $10k-25k, 14.6% for AGIs $25k-50k, 17.7% for AGIs $50k-75k, 18.1% for AGIs $75k-100k, 16.3% for AGIs over 100k)
Charity contributions deductions: $3,549 (5% of AGI, reported on 33.1% of returns)
Here:
$3,549
State:
$4,035
Here:
5.4% of AGI
State:
4.5% of AGI
(% of AGI for various income ranges: 1.4% for AGIs below $10k, 1.5% for AGIs $10k-25k, 2.5% for AGIs $25k-50k, 3.3% for AGIs $50k-75k, 3.7% for AGIs $75k-100k, 4.2% for AGIs over 100k)
Total tax: $4,443 (reported on 73.3% of returns)
28023:
$4,443
State:
$7,257
(% of AGI for various income ranges: 3.1% for AGIs below $10k, 3.6% for AGIs $10k-25k, 6.0% for AGIs $25k-50k, 8.0% for AGIs $50k-75k, 9.7% for AGIs $75k-100k, 15.5% for AGIs over 100k)
Earned income credit: $1,724 (reported on 17.3% of returns)
Here:
$1,724
State:
$1,851
Percentage of individuals using paid preparers for their 2004 taxes: 69.1%
Here:
69%
State:
62%
(% for various income ranges: 60.8% for AGIs below $10k, 71.1% for AGIs $10k-25k, 70.2% for AGIs $25k-50k, 71.6% for AGIs $50k-75k, 72.6% for AGIs $75k-100k, 70.6% for AGIs over 100k)
Household received Food Stamps/SNAP in the past 12 months: 1,112 Household did not receive Food Stamps/SNAP in the past 12 months: 5,386
Women who had a birth in the past 12 months: 176 (88 now married, 85 unmarried) Women who did not have a birth in the past 12 months: 3,469 (1,661 now married, 1,812 unmarried)
Housing units in zip code 28023 with a mortgage: 2,875 (267 second mortgage, 7 home equity loan, 264 both second mortgage and home equity loan) Houses without a mortgage: 119
Median monthly owner costs for units with a mortgage: $1,177 Median monthly owner costs for units without a mortgage: $342
Residents with income below the poverty level in 2022:
This zip code:
12.9%
Whole state:
12.8%
Residents with income below 50% of the poverty level in 2022:
This zip code:
10.5%
Whole state:
6.8%
Median number of rooms in houses and condos:
Here:
5.7
State:
6.4
Median number of rooms in apartments:
Here:
4.4
State:
4.4
Notable locations in this zip code not listed on our city pages
Churches in zip code 28023 include: Immanuel Church (A), Mount Moriah Church (B), Mount Zion Church (C), Oak Grove Church (D), Concordia Church (E), Pine Ridge Church (F), Ebenezer Church (G). Display/hide their locations on the map
In group quarters: 185 (-1 institutionalized population)
Size of family households: 1,591 2-persons, 1,536 3-persons, 558 4-persons, 280 5-persons, 174 6-persons, 98 7-or-more-persons
Size of nonfamily households: 1,718 1-person, 399 2-persons, 121 3-persons
1,824 married couples with children.
575 single-parent households (96 men, 479 women).
85.2% of residents of 28023 zip code speak English at home.
13.8% of residents speak Spanish at home (60% very well, 15% well, 13% not well, 12% not at all).
0.3% of residents speak other Indo-European language at home (100% very well).
0.2% of residents speak Asian or Pacific Island language at home (50% very well, 50% well).
0.1% of residents speak other language at home (100% very well).
Foreign born population: 1,164 (7.3%) (34.8% of them are naturalized citizens)
This zip code:
7.3%
Whole state:
8.6%
52%Honduras
11%Costa Rica
8%France
8%El Salvador
4%Brazil
3%Ethiopia
1%United Kingdom, excluding England and Scotland
18%American
15%English
14%German
5%Scotch-Irish
4%Irish
3%European
1%Scottish
Year of entry for the foreign-born population
4792010 or later
4432000 to 2009
3021990 to 1999
198Before 1990
Facilities with environmental interests located in this zip code:
CHINA GROVE MIDDLE SCHOOL (1013 NORTH MAIN STREET in CHINA GROVE, NC)
STATE MASTER (North Carolina facility info) - UNDERGROUND STORAGE TANK PROGRAM (National Center for Education Statistics) - STATE ID-320 Business SIC classification: NONCLASSIFIABLE ESTABLISHMENTS Organizations: ROWAN-SALISBURY SCHOOLS (SCHOOL DISTRICT)
B & L CUSTOM CABINETS INCORPORATED (2515 US HIGHWAY 29 SOUTH in CHINA GROVE, NC)
AIR MINOR (AIRS/AFS) STATE MASTER (North Carolina facility info) - AIR PROGRAM CRITERIA AND HAZARDOUS AIR POLLUTANT INVENTORY (Inventory of air pollution sources) Conditionally Exempt Small Quantity Generators, less than 100 kg/month of hazardous waste (Resource Conservation and Recovery Act (tracking hazardous waste)) - notification Business SIC classification: WOOD KITCHEN CABINETS Organizations: GREGORY A & ELLEN D BROWN (CONTACT/OWNER)
, LINDA H CAISON (CONTACT/OWNER)
Alternative names: B & E CUSTOM CABINETS INC, B & LCUSTOM CABINETS
CHINA GROVE ROLLER MILL (308 NORTH MAIN STREET in CHINA GROVE, NC)
AIR MINOR (AIRS/AFS) STATE MASTER (North Carolina facility info) - AIR PROGRAM Business SIC classification: FARM MACHINERY AND EQUIPMENT; GRAIN AND FIELD BEANS
BOSTIAN ELEMENTARY (4245 OLD BEATTY FORD RD in CHINA GROVE, NC)
(National Center for Education Statistics) - STATE ID-312 Organizations: ROWAN-SALISBURY SCHOOLS (SCHOOL DISTRICT)
CHINA GROVE ELEMENTARY (514 S FRANKLIN ST in CHINA GROVE, NC)
(National Center for Education Statistics) - STATE ID-316 Organizations: ROWAN-SALISBURY SCHOOLS (SCHOOL DISTRICT)
C & D RAD SOURCE (101 JOHN STREET in CHINA GROVE, NC)
SUPERFUND (Superfund database)
Housing units lacking complete plumbing facilities: 2.1% Housing units lacking complete kitchen facilities: 1.2%
79.3%Electricity
12.8%Utility gas
3.2%Wood
2.7%Bottled, tank, or LP gas
1.0%Fuel oil, kerosene, etc.
0.7%No fuel used
Population in 1990: 13,040.
Place of birth for U.S.-born residents:
This state: 10,157
Northeast: 991
Midwest: 487
South: 2,528
West: 364
67% of the 28023 zip code residents lived in the same house 5 years ago. Out of people who lived in different houses, 59% lived in this county. Out of people who lived in different counties, 50% lived in North Carolina.
93% of the 28023 zip code residents lived in the same house 1 year ago. Out of people who lived in different houses, 37% moved from this county. Out of people who lived in different houses, 20% moved from different county within same state. Out of people who lived in different houses, 35% moved from different state. Out of people who lived in different houses, 15% moved from abroad.
Private vs. public school enrollment:
Students in private schools in grades 1 to 8 (elementary and middle school): 135
Here:
11.0%
North Carolina:
13.8%
Students in private schools in grades 9 to 12 (high school): 91
Here:
13.9%
North Carolina:
11.9%
Students in private undergraduate colleges: 214
Here:
38.2%
North Carolina:
19.3%
Occupation by median earnings in the past 12 months ($)
94,828Business and financial operations occupations
85,855Computer and mathematical occupations
68,555Health diagnosing and treating practitioners and other technical occupations
56,610Management occupations
55,292Fire fighting and prevention, and other protective service workers including supervisors
53,940Education, training, and library occupations
Companies with federal contracts located in this zip code:
DELL COMPUTER SA (0000) (CALLE BASAURI, 17 in MADRID, ) 300 employees, $3050480000 revenue: $26,351 in 12 contractsin 2006
Contracts for ADPE System Configuration, ADP Supplies, , ADP Support Equipment, and moreby ENERGY, Department of, Bureau of Prisoners/Federal Prison System, Department of Veterans Affairs Signed by year:2000: $0; 2001: $0; 2002: $0; 2003: $0; 2004: $0; 2005: $0; 2006: $26,351.
Biggest contracts:
$8,322 with ENERGY, Department of for ADPE System Configuration. Taking place in OH. Signed on 2006-08-31. Completion date: 2006-09-27.
$4,806 with ENERGY, Department of for ADP Supplies. Taking place in OH. Signed on 2006-07-13. Completion date: 2006-07-13.
$4,794 with Bureau of Prisoners/Federal Prison System for . Taking place in IL. Signed on 2006-08-17. Completion date: 2006-09-15.
$3,591 with ENERGY, Department of for ADPE System Configuration. Taking place in OH. Signed on 2006-08-21. Completion date: 2006-08-21.
PATTERSON FARM INC (3060 MILLBRIDGE RD in CHINA GROVE, NC; small business) : $21,363 in 2 contractsin 2005
$11,563 with Defense Logistics Agency for Fruits and Vegetables. Signed on 2005-09-10. Completion date: 2005-09-10.
$9,800, same as above.Signed on 2005-09-24. Completion date: 2005-09-24.
Top industries in this zip code by the number of employees in 2005:
2003 - 2018 National Fire Incident Reporting System (NFIRS) incidents
According to the data from the years 2003 - 2018 the average number of fires per year is 56. The highest number of fire incidents - 96 took place in 2015, and the least - 9 in 2003. The data has a rising trend.
When looking into fire subcategories, the most reports belonged to: Structure Fires (52.7%), and Outside Fires (29.0%).
Fire incident types reported to NFIRS in Zip Code 28023


 Nearest zip codes: 28088, 28083, 28081, 28147, 28125, 28072.


 According to the data from the years 2003 - 2018 the average number of fires per year is 56. The highest number of fire incidents - 96 took place in 2015, and the least - 9 in 2003. The data has a rising trend.
 When looking into fire subcategories, the most reports belonged to: Structure Fires (52.7%), and Outside Fires (29.0%).