Estimated zip code population in 2022: 2,988 Zip code population in 2010: 3,105 Zip code population in 2000: 2,443
Houses and condos: 1,642 Renter-occupied apartments: 356
% of renters here:
24%
State:
33%
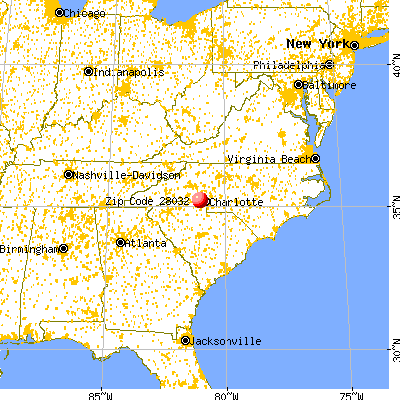
March 2022 cost of living index in zip code 28032: 91.3 (less than average, U.S. average is 100)
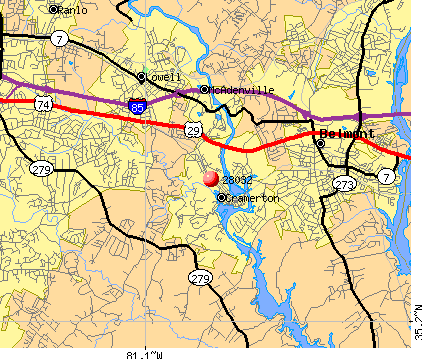
Land area: 2.3 sq. mi. Water area: 0.2 sq. mi.
Population density: 1,282 people per square mile
(low).
OSM Map
General Map
Google Map
MSN Map
OSM Map
General Map
Google Map
MSN Map
OSM Map
General Map
Google Map
MSN Map
OSM Map
General Map
Google Map
MSN Map
Please wait while loading the map...
Real estate property taxes paid for housing units in 2022:
This zip code:
1.0% ($2,679)
North Carolina:
0.6% ($1,769)
Median real estate property taxes paid for housing units with mortgages in 2022: $2,632 (0.9%) Median real estate property taxes paid for housing units with no mortgage in 2022: $2,745 (1.0%)
Estimated median house/condo value in 2022: $277,494
28032:
$277,494
North Carolina:
$280,600
According to our research of North Carolina and other state lists, there were 6 registered sex offenders living in 28032 zip code as of May 28, 2024. The ratio of all residents to sex offenders in zip code 28032 is 557 to 1. The ratio of registered sex offenders to all residents in this zip code is near the state average.
Median resident age:
This zip code:
42.3 years
North Carolina median age:
39.2 years
Average household size:
This zip code:
2.0 people
North Carolina:
2.4 people
Averages for the 2020 tax year for zip code 28032, filed in 2021:
Average Adjusted Gross Income (AGI) in 2020: $82,358 (Individual Income Tax Returns)
Here:
$82,358
State:
$70,020
Salary/wage: $72,452 (reported on 84.8% of returns)
Here:
$72,452
State:
$58,387
(% of AGI for various income ranges: 1205.0% for AGIs below $25k, 3819.4% for AGIs $25k-50k, 6986.0% for AGIs $50k-75k, 10154.4% for AGIs $75k-100k, 19216.9% for AGIs $100k-200k, 80240.0% for AGIs over 200k)
Taxable interest for individuals: $1,466 (reported on 31.0% of returns)
This zip code:
$1,466
North Carolina:
$1,479
(% of AGI for various income ranges: 11.9% for AGIs below $25k, 14.4% for AGIs $25k-50k, 28.5% for AGIs $50k-75k, 12.2% for AGIs $75k-100k, 107.7% for AGIs $100k-200k, 964.0% for AGIs over 200k)
Ordinary dividends: $8,079 (reported on 19.9% of returns)
Here:
$8,079
State:
$7,888
(% of AGI for various income ranges: 29.1% for AGIs below $25k, 31.2% for AGIs $25k-50k, 139.0% for AGIs $50k-75k, 21.1% for AGIs $75k-100k, 483.8% for AGIs $100k-200k, 3244.0% for AGIs over 200k)
Net capital gain/loss in AGI: +$11,530 (reported on 17.5% of returns)
Here:
+$11,530
State:
+$23,652
(% of AGI for various income ranges: 25.3% for AGIs below $25k, 42.4% for AGIs $25k-50k, 53.0% for AGIs $50k-75k, 81.1% for AGIs $75k-100k, 729.2% for AGIs $100k-200k, 4214.0% for AGIs over 200k)
Profit/loss from business: +$11,059 (reported on 15.8% of returns)
Here:
+$11,059
State:
+$11,710
(% of AGI for various income ranges: 121.9% for AGIs below $25k, 149.1% for AGIs $25k-50k, 132.0% for AGIs $50k-75k, 115.6% for AGIs $75k-100k, 675.4% for AGIs $100k-200k, 1686.0% for AGIs over 200k)
Taxable individual retirement arrangement distribution: $25,062 (reported on 9.4% of returns)
28032:
$25,062
North Carolina:
$20,247
(% of AGI for various income ranges: 63.4% for AGIs below $25k, 79.4% for AGIs $25k-50k, 431.0% for AGIs $50k-75k, 2057.7% for AGIs $100k-200k)
Total itemized deductions: $34,223 (reported on 12.9% of returns)
Here:
$34,223
State:
$34,549
(% of AGI for various income ranges: 158.4% for AGIs below $25k, 237.5% for AGIs $50k-75k, 563.3% for AGIs $75k-100k, 1465.4% for AGIs $100k-200k, 8270.0% for AGIs over 200k)
Charity contributions: $16,263 (reported on 11.1% of returns)
Here:
$16,263
State:
$13,360
(% of AGI for various income ranges: 33.1% for AGIs below $25k, 106.5% for AGIs $50k-75k, 376.9% for AGIs $100k-200k, 4562.0% for AGIs over 200k)
Taxes paid: $8,114 (reported on 12.9% of returns)
28032:
$8,114
State:
$7,586
(% of AGI for various income ranges: 34.7% for AGIs below $25k, 63.0% for AGIs $50k-75k, 184.4% for AGIs $75k-100k, 463.8% for AGIs $100k-200k, 1558.0% for AGIs over 200k)
Earned income credit: $1,852 (reported on 13.5% of returns)
Here:
$1,852
State:
$2,337
(% of AGI for various income ranges: 72.2% for AGIs below $25k, 57.4% for AGIs $25k-50k)
Percentage of individuals using paid preparers for their 2020 taxes: 94.2%
Here:
94%
State:
93%
(% for various income ranges: 93.8% for AGIs below $25k, 93.0% for AGIs $25k-50k, 96.4% for AGIs $50k-75k, 100.0% for AGIs $75k-100k, 91.7% for AGIs $100k-200k, 93.3% for AGIs over 200k)
Averages for the 2012 tax year for zip code 28032, filed in 2013:
Average Adjusted Gross Income (AGI) in 2012: $82,241 (Individual Income Tax Returns)
Here:
$82,241
State:
$54,937
Salary/wage: $62,682 (reported on 86.2% of returns)
Here:
$62,682
State:
$46,336
(% of AGI for various income ranges: 71.3% for AGIs below $25k, 83.6% for AGIs $25k-50k, 82.1% for AGIs $50k-75k, 81.5% for AGIs $75k-100k, 70.0% for AGIs $100k-200k, 53.5% for AGIs over 200k)
Taxable interest for individuals: $1,604 (reported on 33.3% of returns)
This zip code:
$1,604
North Carolina:
$1,298
(% of AGI for various income ranges: 0.8% for AGIs below $25k, 0.5% for AGIs $25k-50k, 0.4% for AGIs $50k-75k, 0.1% for AGIs $75k-100k, 0.8% for AGIs $100k-200k, 0.7% for AGIs over 200k)
Ordinary dividends: $5,897 (reported on 21.0% of returns)
Here:
$5,897
State:
$6,213
(% of AGI for various income ranges: 1.2% for AGIs below $25k, 1.2% for AGIs $25k-50k, 0.4% for AGIs $50k-75k, 0.5% for AGIs $75k-100k, 2.0% for AGIs $100k-200k, 1.8% for AGIs over 200k)
Net capital gain/loss in AGI: +$10,900 (reported on 15.9% of returns)
Here:
+$10,900
State:
+$12,740
(% of AGI for various income ranges: 0.5% for AGIs $100k-200k, 4.3% for AGIs over 200k)
Profit/loss from business: +$18,487 (reported on 16.7% of returns)
Here:
+$18,487
State:
+$10,311
(% of AGI for various income ranges: 11.2% for AGIs below $25k, 3.1% for AGIs $25k-50k, 4.3% for AGIs $50k-75k, 5.0% for AGIs $100k-200k, 3.0% for AGIs over 200k)
Taxable individual retirement arrangement distribution: $18,650 (reported on 10.1% of returns)
28032:
$18,650
North Carolina:
$15,575
(% of AGI for various income ranges: 4.1% for AGIs below $25k, 1.6% for AGIs $25k-50k, 5.7% for AGIs $50k-75k, 7.5% for AGIs $100k-200k)
Total itemized deductions: $28,321 (17% of AGI, reported on 40.6% of returns)
Here:
$28,321
State:
$23,438
Here:
17.5% of AGI
State:
21.5% of AGI
(% of AGI for various income ranges: 15.4% for AGIs below $25k, 12.0% for AGIs $25k-50k, 16.5% for AGIs $50k-75k, 18.5% for AGIs $75k-100k, 18.8% for AGIs $100k-200k, 11.4% for AGIs over 200k)
Charity contributions: $5,378 (reported on 36.2% of returns)
Here:
$5,378
State:
$4,687
(% of AGI for various income ranges: 1.8% for AGIs below $25k, 2.0% for AGIs $25k-50k, 2.4% for AGIs $50k-75k, 2.7% for AGIs $75k-100k, 2.5% for AGIs $100k-200k, 2.4% for AGIs over 200k)
Taxes paid: $12,273 (reported on 40.6% of returns)
28032:
$12,273
State:
$8,823
(% of AGI for various income ranges: 2.5% for AGIs below $25k, 3.1% for AGIs $25k-50k, 5.1% for AGIs $50k-75k, 7.1% for AGIs $75k-100k, 8.6% for AGIs $100k-200k, 6.3% for AGIs over 200k)
Earned income credit: $2,127 (reported on 18.8% of returns)
Here:
$2,127
State:
$2,376
(% of AGI for various income ranges: 6.1% for AGIs below $25k, 1.2% for AGIs $25k-50k)
Percentage of individuals using paid preparers for their 2012 taxes: 56.5%
Here:
57%
State:
53%
(% for various income ranges: 56.0% for AGIs below $25k, 52.6% for AGIs $25k-50k, 50.0% for AGIs $50k-75k, 55.6% for AGIs $75k-100k, 64.3% for AGIs $100k-200k, 77.8% for AGIs over 200k)
Averages for the 2004 tax year for zip code 28032, filed in 2005:
Average Adjusted Gross Income (AGI) in 2004: $65,584 (Individual Income Tax Returns)
Here:
$65,584
State:
$45,376
Salary/wage: $59,352 (reported on 89.1% of returns)
Here:
$59,352
State:
$39,442
(% of AGI for various income ranges: 114.5% for AGIs below $10k, 83.0% for AGIs $10k-25k, 88.7% for AGIs $25k-50k, 85.2% for AGIs $50k-75k, 84.8% for AGIs $75k-100k, 76.5% for AGIs over 100k)
Taxable interest for individuals: $1,629 (reported on 36.6% of returns)
This zip code:
$1,629
North Carolina:
$1,515
(% of AGI for various income ranges: 6.8% for AGIs below $10k, 1.3% for AGIs $10k-25k, 0.9% for AGIs $25k-50k, 0.9% for AGIs $50k-75k, 0.7% for AGIs $75k-100k, 0.8% for AGIs over 100k)
Taxable dividends: $3,717 (reported on 24.5% of returns)
Here:
$3,717
State:
$4,016
(% of AGI for various income ranges: 3.4% for AGIs below $10k, 1.2% for AGIs $10k-25k, 0.7% for AGIs $25k-50k, 0.5% for AGIs $50k-75k, 1.4% for AGIs $75k-100k, 1.7% for AGIs over 100k)
Net capital gain/loss: +$26,112 (reported on 17.9% of returns)
Here:
+$26,112
State:
+$11,152
(% of AGI for various income ranges: -0.7% for AGIs below $10k, -0.2% for AGIs $10k-25k, 1.2% for AGIs $25k-50k, 0.0% for AGIs $50k-75k, 0.2% for AGIs $75k-100k, 11.7% for AGIs over 100k)
Profit/loss from business: +$8,791 (reported on 13.7% of returns)
Here:
+$8,791
State:
+$9,490
(% of AGI for various income ranges: 1.1% for AGIs below $10k, 4.4% for AGIs $10k-25k, 1.1% for AGIs $25k-50k, 0.3% for AGIs $50k-75k, 2.3% for AGIs over 100k)
IRA payment deduction: $3,105 (reported on 1.5% of returns)
28032:
$3,105
North Carolina:
$2,967
Self-employed pension: $11,231 (reported on 1.0% of returns)
Here:
$11,231
North Carolina:
$14,754
Total itemized deductions: $23,724 (22% of AGI, reported on 39.3% of returns)
Here:
$23,724
State:
$19,464
Here:
21.6% of AGI
State:
22.7% of AGI
(% of AGI for various income ranges: 11.1% for AGIs $10k-25k, 14.1% for AGIs $25k-50k, 17.9% for AGIs $50k-75k, 21.0% for AGIs $75k-100k, 13.3% for AGIs over 100k)
Charity contributions deductions: $4,340 (4% of AGI, reported on 35.5% of returns)
Here:
$4,340
State:
$4,035
Here:
3.7% of AGI
State:
4.5% of AGI
(% of AGI for various income ranges: 1.1% for AGIs $10k-25k, 1.8% for AGIs $25k-50k, 2.3% for AGIs $50k-75k, 3.9% for AGIs $75k-100k, 2.5% for AGIs over 100k)
Total tax: $12,578 (reported on 75.0% of returns)
28032:
$12,578
State:
$7,257
(% of AGI for various income ranges: 3.2% for AGIs below $10k, 3.5% for AGIs $10k-25k, 6.7% for AGIs $25k-50k, 8.7% for AGIs $50k-75k, 10.5% for AGIs $75k-100k, 19.2% for AGIs over 100k)
Earned income credit: $1,809 (reported on 16.3% of returns)
Here:
$1,809
State:
$1,851
Percentage of individuals using paid preparers for their 2004 taxes: 65.5%
Here:
66%
State:
62%
(% for various income ranges: 60.6% for AGIs below $10k, 66.7% for AGIs $10k-25k, 63.7% for AGIs $25k-50k, 64.4% for AGIs $50k-75k, 62.1% for AGIs $75k-100k, 76.2% for AGIs over 100k)
Household received Food Stamps/SNAP in the past 12 months: 85 Household did not receive Food Stamps/SNAP in the past 12 months: 1,376
Women who had a birth in the past 12 months: 9 (9 now married, 0 unmarried) Women who did not have a birth in the past 12 months: 680 (352 now married, 329 unmarried)
Housing units in zip code 28032 with a mortgage: 663 (44 second mortgage, 40 both second mortgage and home equity loan) Houses without a mortgage: 36
Median monthly owner costs for units with a mortgage: $1,358 Median monthly owner costs for units without a mortgage: $500
Residents with income below the poverty level in 2022:
This zip code:
8.7%
Whole state:
12.8%
Residents with income below 50% of the poverty level in 2022:
This zip code:
1.3%
Whole state:
6.8%
Median number of rooms in houses and condos:
Here:
5.7
State:
6.4
Median number of rooms in apartments:
Here:
4.5
State:
4.4
Notable locations in this zip code not listed on our city pages
In group quarters: 7 (-1 institutionalized population)
Size of family households: 480 2-persons, 176 3-persons, 145 4-persons, 32 5-persons, 21 6-persons
Size of nonfamily households: 573 1-person, 42 2-persons
266 married couples with children.
320 single-parent households (65 men, 255 women).
94.2% of residents of 28032 zip code speak English at home.
2.8% of residents speak Spanish at home (71% very well, 19% well, 10% not well).
0.2% of residents speak other Indo-European language at home (100% very well).
1.0% of residents speak Asian or Pacific Island language at home (100% very well).
1.6% of residents speak other language at home (100% very well).
Foreign born population: 139 (4.7%) (82.3% of them are naturalized citizens)
This zip code:
4.7%
Whole state:
8.6%
31%Cabo Verde
13%United Kingdom, excluding England and Scotland
12%Sweden
10%Honduras
7%Chile
4%Guyana
2%Kuwait
24%American
13%English
10%Irish
9%German
7%Ghanaian
2%British
2%Brazilian
Year of entry for the foreign-born population
562010 or later
332000 to 2009
501990 to 1999
30Before 1990
Facilities with environmental interests located in this zip code:
BRIDGEPORT WWTP (NCSR 1102 LANGTREE RD in CRAMERTON, NC)
National Pollutant Discharge Elimination System NON-MAJOR (Tracking pollutant discharge elimination systems) - permit Business SIC classification: SEWERAGE SYSTEMS Alternative names: HEATER UTIL/BRIDGEPORT
BURLINGTON IND MAYFLOWER PLT #013 (MAYFLOWER ST in CRAMERTON, NC)
(Resource Conservation and Recovery Act (tracking hazardous waste))
TRI REPORTER (Tracking of toxic chemicals releasing facilities) Business SIC classification: FINISHERS OF TEXTILES
Housing units lacking complete plumbing facilities: 1.4% Housing units lacking complete kitchen facilities: 1.4%
75.6%Utility gas
23.4%Electricity
0.6%Wood
Population in 1990: 2,835.
Place of birth for U.S.-born residents:
This state: 1,973
Northeast: 308
Midwest: 203
South: 256
West: 53
54% of the 28032 zip code residents lived in the same house 5 years ago. Out of people who lived in different houses, 61% lived in this county. Out of people who lived in different counties, 50% lived in North Carolina.
88% of the 28032 zip code residents lived in the same house 1 year ago. Out of people who lived in different houses, 53% moved from this county. Out of people who lived in different houses, 31% moved from different county within same state. Out of people who lived in different houses, 12% moved from different state.
Private vs. public school enrollment:
Students in private schools in grades 1 to 8 (elementary and middle school): 98
Here:
34.9%
North Carolina:
13.8%
Students in private schools in grades 9 to 12 (high school): 23
Here:
16.8%
North Carolina:
11.9%
Students in private undergraduate colleges:
Here:
0.0%
North Carolina:
19.3%
Occupation by median earnings in the past 12 months ($)
250,431Health diagnosing and treating practitioners and other technical occupations
113,810Management occupations
89,260Computer and mathematical occupations
76,175Health technologists and technicians
71,159Sales and related occupations
68,827Installation, maintenance, and repair occupations
Top industries in this zip code by the number of employees in 2005:
Other Services (except Public Administration): Religious Organizations (50-99 employees: 1 establishment, 10-19 employees: 1 establishment, 5-9 employees: 1 establishment, 1-4 employees: 1 establishment)
Arts, Entertainment, and Recreation: Golf Courses and Country Clubs (50-99: 1, 5-9: 1)
Health Care and Social Assistance: Homes for the Elderly (50-99: 1)
Accommodation and Food Services: Limited-Service Restaurants (20-49: 1, 5-9: 1)
Health Care and Social Assistance: Child Day Care Services (20-49: 1)
Wholesale Trade: Tire and Tube Merchant Wholesalers (10-19: 1)
People in group quarters in 2010:
76 people in nursing facilities/skilled-nursing facilities
Fatal accident statistics in 2013:
Fatal accident count: 1
Vehicles involved in fatal accidents: 2
Fatal accidents caused by drunken drivers: 0
Fatalities: 1
Persons involved in fatal accidents: 2
Pedestrians involved in fatal accidents: 0
Fatal accident statistics in 2012:
Fatal accident count: 1
Vehicles involved in fatal accidents: 1
Fatal accidents caused by drunken drivers: 1
Fatalities: 1
Persons involved in fatal accidents: 4
Pedestrians involved in fatal accidents: 0
Home Mortgage Disclosure Act Aggregated Statistics For Year 2009 (Based on 4 partial tracts)
A) FHA, FSA/RHS & VA Home Purchase Loans
B) Conventional Home Purchase Loans
C) Refinancings
D) Home Improvement Loans
F) Non-occupant Loans on < 5 Family Dwellings (A B C & D)
G) Loans On Manufactured Home Dwelling (A B C & D)
Number
Average Value
Number
Average Value
Number
Average Value
Number
Average Value
Number
Average Value
Number
Average Value
LOANS ORIGINATED
33
$140,446
35
$141,828
114
$175,611
5
$35,378
9
$89,977
0
$0
APPLICATIONS APPROVED, NOT ACCEPTED
0
$0
1
$109,500
8
$174,470
0
$0
1
$68,490
0
$0
APPLICATIONS DENIED
7
$135,589
3
$115,443
45
$166,010
4
$31,135
2
$58,930
0
$0
APPLICATIONS WITHDRAWN
3
$147,660
1
$234,230
23
$162,712
0
$0
0
$0
0
$0
FILES CLOSED FOR INCOMPLETENESS
1
$139,660
1
$23,520
8
$140,138
0
$0
1
$23,520
1
$16,120
Aggregated Statistics For Year 2008 (Based on 4 partial tracts)
A) FHA, FSA/RHS & VA Home Purchase Loans
B) Conventional Home Purchase Loans
C) Refinancings
D) Home Improvement Loans
E) Loans on Dwellings For 5+ Families
F) Non-occupant Loans on < 5 Family Dwellings (A B C & D)
G) Loans On Manufactured Home Dwelling (A B C & D)
Number
Average Value
Number
Average Value
Number
Average Value
Number
Average Value
Number
Average Value
Number
Average Value
Number
Average Value
LOANS ORIGINATED
26
$124,120
52
$158,050
74
$141,875
10
$29,576
0
$0
17
$91,991
2
$73,005
APPLICATIONS APPROVED, NOT ACCEPTED
1
$172,330
6
$169,042
16
$126,773
2
$10,790
0
$0
2
$90,685
0
$0
APPLICATIONS DENIED
4
$124,432
9
$122,206
43
$124,465
7
$76,179
0
$0
7
$74,526
0
$0
APPLICATIONS WITHDRAWN
5
$106,286
12
$134,796
29
$142,474
0
$0
0
$0
4
$72,120
1
$41,510
FILES CLOSED FOR INCOMPLETENESS
0
$0
1
$232,970
7
$122,739
1
$93,410
1
$345,900
0
$0
0
$0
Aggregated Statistics For Year 2007 (Based on 4 partial tracts)
A) FHA, FSA/RHS & VA Home Purchase Loans
B) Conventional Home Purchase Loans
C) Refinancings
D) Home Improvement Loans
F) Non-occupant Loans on < 5 Family Dwellings (A B C & D)
G) Loans On Manufactured Home Dwelling (A B C & D)
Number
Average Value
Number
Average Value
Number
Average Value
Number
Average Value
Number
Average Value
Number
Average Value
LOANS ORIGINATED
11
$130,450
121
$147,828
73
$128,352
9
$36,619
33
$106,761
1
$38,830
APPLICATIONS APPROVED, NOT ACCEPTED
1
$97,540
7
$129,347
17
$106,959
3
$115,910
1
$21,820
0
$0
APPLICATIONS DENIED
3
$102,517
12
$93,628
59
$114,040
10
$50,621
8
$68,028
1
$33,280
APPLICATIONS WITHDRAWN
1
$141,260
7
$216,750
30
$123,591
2
$74,645
6
$106,593
0
$0
FILES CLOSED FOR INCOMPLETENESS
0
$0
3
$118,983
7
$150,657
0
$0
1
$78,870
0
$0
Aggregated Statistics For Year 2006 (Based on 4 partial tracts)
A) FHA, FSA/RHS & VA Home Purchase Loans
B) Conventional Home Purchase Loans
C) Refinancings
D) Home Improvement Loans
F) Non-occupant Loans on < 5 Family Dwellings (A B C & D)
G) Loans On Manufactured Home Dwelling (A B C & D)
Number
Average Value
Number
Average Value
Number
Average Value
Number
Average Value
Number
Average Value
Number
Average Value
LOANS ORIGINATED
10
$126,621
138
$117,493
90
$104,411
10
$54,643
24
$79,631
2
$94,390
APPLICATIONS APPROVED, NOT ACCEPTED
0
$0
14
$131,349
17
$93,144
0
$0
1
$221,140
0
$0
APPLICATIONS DENIED
1
$101,830
19
$109,206
74
$115,375
11
$49,404
7
$65,226
0
$0
APPLICATIONS WITHDRAWN
3
$140,287
18
$124,194
32
$126,960
4
$58,805
2
$61,475
0
$0
FILES CLOSED FOR INCOMPLETENESS
0
$0
4
$97,278
8
$152,334
0
$0
0
$0
0
$0
Aggregated Statistics For Year 2005 (Based on 4 partial tracts)
A) FHA, FSA/RHS & VA Home Purchase Loans
B) Conventional Home Purchase Loans
C) Refinancings
D) Home Improvement Loans
F) Non-occupant Loans on < 5 Family Dwellings (A B C & D)
G) Loans On Manufactured Home Dwelling (A B C & D)
Number
Average Value
Number
Average Value
Number
Average Value
Number
Average Value
Number
Average Value
Number
Average Value
LOANS ORIGINATED
11
$124,140
105
$114,443
81
$99,496
9
$42,848
18
$68,184
0
$0
APPLICATIONS APPROVED, NOT ACCEPTED
1
$95,770
14
$96,927
20
$103,566
1
$63,610
4
$63,310
1
$45,660
APPLICATIONS DENIED
1
$157,300
19
$92,365
67
$108,156
18
$52,433
7
$61,876
2
$49,175
APPLICATIONS WITHDRAWN
1
$79,560
11
$108,626
30
$105,558
3
$131,090
0
$0
0
$0
FILES CLOSED FOR INCOMPLETENESS
0
$0
1
$83,570
10
$116,953
0
$0
1
$80,990
0
$0
Aggregated Statistics For Year 2004 (Based on 4 partial tracts)
A) FHA, FSA/RHS & VA Home Purchase Loans
B) Conventional Home Purchase Loans
C) Refinancings
D) Home Improvement Loans
F) Non-occupant Loans on < 5 Family Dwellings (A B C & D)
G) Loans On Manufactured Home Dwelling (A B C & D)
Number
Average Value
Number
Average Value
Number
Average Value
Number
Average Value
Number
Average Value
Number
Average Value
LOANS ORIGINATED
13
$107,288
70
$119,194
90
$105,830
11
$34,175
24
$69,133
0
$0
APPLICATIONS APPROVED, NOT ACCEPTED
1
$80,250
10
$79,900
14
$112,754
2
$20,105
2
$68,825
1
$40,120
APPLICATIONS DENIED
1
$53,940
16
$104,865
63
$93,036
11
$46,321
5
$105,016
7
$72,641
APPLICATIONS WITHDRAWN
4
$100,460
8
$172,434
25
$107,188
1
$38,830
4
$88,300
1
$142,690
FILES CLOSED FOR INCOMPLETENESS
0
$0
0
$0
8
$123,302
0
$0
0
$0
0
$0
Aggregated Statistics For Year 2003 (Based on 4 partial tracts)
A) FHA, FSA/RHS & VA Home Purchase Loans
B) Conventional Home Purchase Loans
C) Refinancings
D) Home Improvement Loans
F) Non-occupant Loans on < 5 Family Dwellings (A B C & D)
Number
Average Value
Number
Average Value
Number
Average Value
Number
Average Value
Number
Average Value
LOANS ORIGINATED
18
$118,242
66
$120,100
200
$123,669
11
$24,499
24
$68,754
APPLICATIONS APPROVED, NOT ACCEPTED
0
$0
5
$273,514
21
$114,296
2
$12,895
1
$147,640
APPLICATIONS DENIED
4
$120,112
9
$101,930
66
$97,870
7
$12,951
5
$75,042
APPLICATIONS WITHDRAWN
2
$99,275
7
$76,844
34
$118,187
1
$8,140
5
$68,400
FILES CLOSED FOR INCOMPLETENESS
1
$79,560
2
$144,225
4
$128,227
0
$0
0
$0
Aggregated Statistics For Year 2002 (Based on 2 partial tracts)
A) FHA, FSA/RHS & VA Home Purchase Loans
B) Conventional Home Purchase Loans
C) Refinancings
D) Home Improvement Loans
F) Non-occupant Loans on < 5 Family Dwellings (A B C & D)
Number
Average Value
Number
Average Value
Number
Average Value
Number
Average Value
Number
Average Value
LOANS ORIGINATED
14
$113,949
30
$93,024
61
$113,761
6
$11,183
12
$70,563
APPLICATIONS APPROVED, NOT ACCEPTED
0
$0
3
$59,493
10
$108,405
2
$25,250
1
$17,300
APPLICATIONS DENIED
2
$115,530
6
$40,008
29
$79,819
1
$17,300
3
$49,580
APPLICATIONS WITHDRAWN
3
$108,383
4
$110,515
9
$79,711
3
$27,673
1
$46,350
FILES CLOSED FOR INCOMPLETENESS
0
$0
1
$112,070
4
$103,598
0
$0
0
$0
Aggregated Statistics For Year 2001 (Based on 2 partial tracts)
A) FHA, FSA/RHS & VA Home Purchase Loans
B) Conventional Home Purchase Loans
C) Refinancings
D) Home Improvement Loans
F) Non-occupant Loans on < 5 Family Dwellings (A B C & D)
Number
Average Value
Number
Average Value
Number
Average Value
Number
Average Value
Number
Average Value
LOANS ORIGINATED
20
$101,348
26
$72,666
46
$70,804
4
$20,235
10
$53,545
APPLICATIONS APPROVED, NOT ACCEPTED
0
$0
4
$49,810
8
$86,648
1
$24,900
1
$40,120
APPLICATIONS DENIED
1
$38,050
17
$47,449
17
$65,599
8
$14,874
2
$55,345
APPLICATIONS WITHDRAWN
2
$123,485
5
$50,224
8
$100,744
1
$18,680
2
$60,185
FILES CLOSED FOR INCOMPLETENESS
0
$0
0
$0
4
$61,052
0
$0
1
$55,340
Aggregated Statistics For Year 2000 (Based on 2 partial tracts)
A) FHA, FSA/RHS & VA Home Purchase Loans
B) Conventional Home Purchase Loans
C) Refinancings
D) Home Improvement Loans
F) Non-occupant Loans on < 5 Family Dwellings (A B C & D)
Number
Average Value
Number
Average Value
Number
Average Value
Number
Average Value
Number
Average Value
LOANS ORIGINATED
17
$106,130
30
$81,494
22
$81,192
7
$16,801
6
$51,885
APPLICATIONS APPROVED, NOT ACCEPTED
2
$63,300
9
$41,431
8
$53,874
1
$2,770
0
$0
APPLICATIONS DENIED
4
$63,992
21
$57,057
20
$49,948
7
$8,894
0
$0
APPLICATIONS WITHDRAWN
2
$122,105
3
$125,907
12
$54,307
1
$8,300
1
$118,990
FILES CLOSED FOR INCOMPLETENESS
0
$0
0
$0
1
$52,580
0
$0
1
$10,380
Aggregated Statistics For Year 1999 (Based on 2 partial tracts)
A) FHA, FSA/RHS & VA Home Purchase Loans
B) Conventional Home Purchase Loans
C) Refinancings
D) Home Improvement Loans
F) Non-occupant Loans on < 5 Family Dwellings (A B C & D)
Detailed PMIC statistics for the following Tracts:0322.00
, 0325.04
2002 - 2018 National Fire Incident Reporting System (NFIRS) incidents
According to the data from the years 2002 - 2018 the average number of fires per year is 7. The highest number of fire incidents - 24 took place in 2002, and the least - 0 in 2003. The data has a declining trend.
When looking into fire subcategories, the most reports belonged to: Structure Fires (42.5%), and Outside Fires (37.5%).
Fire incident types reported to NFIRS in Zip Code 28032


 Nearest zip codes: 28101, 28098, 28012, 28056, 28054, 28120.


 According to the data from the years 2002 - 2018 the average number of fires per year is 7. The highest number of fire incidents - 24 took place in 2002, and the least - 0 in 2003. The data has a declining trend.
 When looking into fire subcategories, the most reports belonged to: Structure Fires (42.5%), and Outside Fires (37.5%).