Estimated zip code population in 2022: 1,070 Zip code population in 2010: 698 Zip code population in 2000: 482
Houses and condos: 489 Renter-occupied apartments: 28
% of renters here:
6%
State:
33%
March 2022 cost of living index in zip code 28101: 92.0 (less than average, U.S. average is 100)
Land area: 0.9 sq. mi. Water area: 0.1 sq. mi.
Population density: 1,195 people per square mile
(low).
OSM Map
General Map
Google Map
MSN Map
OSM Map
General Map
Google Map
MSN Map
OSM Map
General Map
Google Map
MSN Map
OSM Map
General Map
Google Map
MSN Map
Please wait while loading the map...
Real estate property taxes paid for housing units in 2022:
This zip code:
0.8% ($3,185)
North Carolina:
0.6% ($1,769)
Median real estate property taxes paid for housing units with mortgages in 2022: $2,847 (0.7%) Median real estate property taxes paid for housing units with no mortgage in 2022: $3,440 (0.9%)
Business Search- 14 Million verified businesses
Males: 505
(47.2%)
Females: 565
(52.8%)
For population 25 years and over in 28101:
High school or higher: 101.4%
Bachelor's degree or higher: 61.8%
Graduate or professional degree: 25.0%
Unemployed: 0.3%
Mean travel time to work (commute): 32.3 minutes
For population 15 years and over in 28101:
Never married: 7.9%
Now married: 68.1%
Separated: 0.7%
Widowed: 14.0%
Divorced: 9.3%
Zip code 28101 compared to state average:
Unemployed percentage significantly below state average.
Black race population percentage significantly below state average.
Hispanic race population percentage significantly below state average.
Foreign-born population percentage below state average.
Renting percentage significantly below state average.
Number of college students below state average.
Percentage of population with a bachelor's degree or higher above state average.
Estimated median house/condo value in 2022: $387,871
28101:
$387,871
North Carolina:
$280,600
Median resident age:
This zip code:
38.6 years
North Carolina median age:
39.2 years
Average household size:
This zip code:
2.2 people
North Carolina:
2.4 people
Averages for the 2020 tax year for zip code 28101, filed in 2021:
Average Adjusted Gross Income (AGI) in 2020: $91,846 (Individual Income Tax Returns)
Here:
$91,846
State:
$70,020
Salary/wage: $79,282 (reported on 91.9% of returns)
Here:
$79,282
State:
$58,387
(% of AGI for various income ranges: 980.0% for AGIs below $25k, 3734.0% for AGIs $25k-50k, 7307.5% for AGIs $50k-75k, 14985.0% for AGIs $75k-100k, 15193.8% for AGIs $100k-200k)
Taxable interest for individuals: $350 (reported on 32.4% of returns)
This zip code:
$350
North Carolina:
$1,479
(% of AGI for various income ranges: 13.3% for AGIs below $25k, 17.5% for AGIs $50k-75k, 33.8% for AGIs $100k-200k)
Ordinary dividends: $2,700 (reported on 21.6% of returns)
Here:
$2,700
State:
$7,888
(% of AGI for various income ranges: 37.5% for AGIs $50k-75k, 251.3% for AGIs $100k-200k)
Net capital gain/loss in AGI: +$986 (reported on 18.9% of returns)
Here:
+$986
State:
+$23,652
(% of AGI for various income ranges: 86.2% for AGIs $100k-200k)
Profit/loss from business: +$5,557 (reported on 18.9% of returns)
Here:
+$5,557
State:
+$11,710
(% of AGI for various income ranges: 462.0% for AGIs $25k-50k, 197.5% for AGIs $100k-200k)
Taxable individual retirement arrangement distribution: $18,100 (reported on 8.1% of returns)
28101:
$18,100
North Carolina:
$20,247
(% of AGI for various income ranges: 1357.5% for AGIs $50k-75k)
Total itemized deductions: $29,683 (reported on 16.2% of returns)
Here:
$29,683
State:
$34,549
(% of AGI for various income ranges: 2226.2% for AGIs $100k-200k)
Charity contributions: $11,560 (reported on 13.5% of returns)
Here:
$11,560
State:
$13,360
(% of AGI for various income ranges: 722.5% for AGIs $100k-200k)
Taxes paid: $9,300 (reported on 16.2% of returns)
28101:
$9,300
State:
$7,586
(% of AGI for various income ranges: 697.5% for AGIs $100k-200k)
Earned income credit: $2,467 (reported on 8.1% of returns)
Here:
$2,467
State:
$2,337
(% of AGI for various income ranges: 123.3% for AGIs below $25k)
Percentage of individuals using paid preparers for their 2020 taxes: 100.0%
Here:
100%
State:
93%
(% for various income ranges: 100.0% for AGIs below $25k, 100.0% for AGIs $25k-50k, 100.0% for AGIs $50k-75k, 100.0% for AGIs $75k-100k, 100.0% for AGIs $100k-200k, 100.0% for AGIs over 200k)
Averages for the 2012 tax year for zip code 28101, filed in 2013:
Average Adjusted Gross Income (AGI) in 2012: $52,000 (Individual Income Tax Returns)
Here:
$52,000
State:
$54,937
Salary/wage: $49,157 (reported on 88.2% of returns)
Here:
$49,157
State:
$46,336
(% of AGI for various income ranges: 73.2% for AGIs below $25k, 87.1% for AGIs $25k-50k, 68.3% for AGIs $50k-75k, 80.0% for AGIs $75k-100k, 88.4% for AGIs $100k-200k)
Taxable interest for individuals: $233 (reported on 26.5% of returns)
This zip code:
$233
North Carolina:
$1,298
(% of AGI for various income ranges: 0.4% for AGIs below $25k, 0.5% for AGIs $50k-75k)
Ordinary dividends: $12,920 (reported on 14.7% of returns)
Here:
$12,920
State:
$6,213
Profit/loss from business: +$1,325 (reported on 11.8% of returns)
Here:
+$1,325
State:
+$10,311
Taxable individual retirement arrangement distribution: $11,300 (reported on 8.8% of returns)
28101:
$11,300
North Carolina:
$15,575
Total itemized deductions: $23,755 (22% of AGI, reported on 32.4% of returns)
Here:
$23,755
State:
$23,438
Here:
21.8% of AGI
State:
21.5% of AGI
(% of AGI for various income ranges: 19.5% for AGIs $25k-50k, 19.2% for AGIs $75k-100k, 18.0% for AGIs $100k-200k)
Charity contributions: $4,760 (reported on 29.4% of returns)
Here:
$4,760
State:
$4,687
Taxes paid: $10,670 (reported on 29.4% of returns)
28101:
$10,670
State:
$8,823
(% of AGI for various income ranges: 5.0% for AGIs $25k-50k, 6.6% for AGIs $75k-100k, 8.8% for AGIs $100k-200k)
Earned income credit: $1,657 (reported on 20.6% of returns)
Here:
$1,657
State:
$2,376
(% of AGI for various income ranges: 4.6% for AGIs below $25k, 1.1% for AGIs $25k-50k)
Percentage of individuals using paid preparers for their 2012 taxes: 58.8%
Here:
59%
State:
53%
(% for various income ranges: 57.1% for AGIs below $25k, 55.6% for AGIs $25k-50k, 66.7% for AGIs $50k-75k, 66.7% for AGIs $75k-100k, 60.0% for AGIs $100k-200k)
Averages for the 2004 tax year for zip code 28101, filed in 2005:
Average Adjusted Gross Income (AGI) in 2004: $36,274 (Individual Income Tax Returns)
Here:
$36,274
State:
$45,376
Salary/wage: $30,713 (reported on 91.7% of returns)
Here:
$30,713
State:
$39,442
(% of AGI for various income ranges: 81.6% for AGIs below $10k, 89.8% for AGIs $10k-25k, 87.0% for AGIs $25k-50k, 86.5% for AGIs $50k-75k, 72.3% for AGIs $75k-100k, 56.4% for AGIs over 100k)
Taxable interest for individuals: $265 (reported on 26.4% of returns)
This zip code:
$265
North Carolina:
$1,515
(% of AGI for various income ranges: 2.5% for AGIs below $10k, 0.2% for AGIs $10k-25k, 0.2% for AGIs $25k-50k, 0.3% for AGIs $50k-75k, 0.1% for AGIs over 100k)
Taxable dividends: $3,878 (reported on 10.6% of returns)
Here:
$3,878
State:
$4,016
Profit/loss from business: +$1,500 (reported on 9.3% of returns)
Here:
+$1,500
State:
+$9,490
Total itemized deductions: $15,788 (20% of AGI, reported on 22.0% of returns)
Here:
$15,788
State:
$19,464
Here:
19.8% of AGI
State:
22.7% of AGI
(% of AGI for various income ranges: 12.3% for AGIs $25k-50k, 8.7% for AGIs $50k-75k, 16.4% for AGIs $75k-100k, 11.5% for AGIs over 100k)
Charity contributions deductions: $3,800 (5% of AGI, reported on 18.1% of returns)
Here:
$3,800
State:
$4,035
Here:
4.6% of AGI
State:
4.5% of AGI
Total tax: $3,981 (reported on 69.3% of returns)
28101:
$3,981
State:
$7,257
(% of AGI for various income ranges: 2.8% for AGIs below $10k, 3.6% for AGIs $10k-25k, 6.6% for AGIs $25k-50k, 8.8% for AGIs $50k-75k, 10.3% for AGIs $75k-100k, 10.4% for AGIs over 100k)
Earned income credit: $1,614 (reported on 22.7% of returns)
Here:
$1,614
State:
$1,851
Percentage of individuals using paid preparers for their 2004 taxes: 64.3%
Here:
64%
State:
62%
(% for various income ranges: 52.5% for AGIs below $10k, 66.4% for AGIs $10k-25k, 65.6% for AGIs $25k-50k, 70.4% for AGIs $50k-75k, 73.3% for AGIs $75k-100k, 63.2% for AGIs over 100k)
Likely homosexual households (counted as self-reported same-sex unmarried-partner households)
Lesbian couples: 0.0% of all households
Gay men: 0.2% of all households
Household received Food Stamps/SNAP in the past 12 months: 56 Household did not receive Food Stamps/SNAP in the past 12 months: 434
Women who had a birth in the past 12 months: 11 (11 now married, 0 unmarried) Women who did not have a birth in the past 12 months: 284 (242 now married, 44 unmarried)
Housing units in zip code 28101 with a mortgage: 288 (9 second mortgage, 7 both second mortgage and home equity loan) Houses without a mortgage: 3
Median monthly owner costs for units with a mortgage: $1,684 Median monthly owner costs for units without a mortgage: $604
Residents with income below the poverty level in 2022:
This zip code:
2.5%
Whole state:
12.8%
Residents with income below 50% of the poverty level in 2022:
This zip code:
1.5%
Whole state:
6.8%
Median number of rooms in houses and condos:
Here:
6.6
State:
6.4
Median number of rooms in apartments:
Here:
5.6
State:
4.4
Notable locations in this zip code not listed on our city pages
Size of family households: 129 2-persons, 96 3-persons, 39 4-persons, 36 5-persons, 2 6-persons
Size of nonfamily households: 173 1-person, 12 2-persons
215 married couples with children.
21 single-parent households (21 women).
97.3% of residents of 28101 zip code speak English at home.
2.1% of residents speak other Indo-European language at home (100% very well).
Foreign born population: 42 (4.0%) (66.7% of them are naturalized citizens)
This zip code:
4.0%
Whole state:
8.6%
71%Poland
36%Belgium
23%American
15%English
10%European
9%German
7%Irish
4%Scotch-Irish
2%Scottish
Year of entry for the foreign-born population
172010 or later
02000 to 2009
241990 to 1999
8Before 1990
Housing units lacking complete kitchen facilities: 0.8%
66.7%Utility gas
32.9%Electricity
0.6%No fuel used
Place of birth for U.S.-born residents:
This state: 682
Northeast: 69
Midwest: 101
South: 134
West: 26
57% of the 28101 zip code residents lived in the same house 5 years ago. Out of people who lived in different houses, 88% lived in this county. Out of people who lived in different counties, 50% lived in North Carolina.
93% of the 28101 zip code residents lived in the same house 1 year ago. Out of people who lived in different houses, 32% moved from this county. Out of people who lived in different houses, 64% moved from different county within same state. Out of people who lived in different houses, 7% moved from different state.
Private vs. public school enrollment:
Students in private schools in grades 1 to 8 (elementary and middle school): 91
Here:
57.3%
North Carolina:
13.8%
Students in private schools in grades 9 to 12 (high school): 3
Here:
12.8%
North Carolina:
11.9%
Students in private undergraduate colleges:
Here:
0.0%
North Carolina:
19.3%
Occupation by median earnings in the past 12 months ($)
112,834Architecture and engineering occupations
106,299Computer and mathematical occupations
99,259Management occupations
84,207Health diagnosing and treating practitioners and other technical occupations
82,372Business and financial operations occupations
75,554Building and grounds cleaning and maintenance occupations
Top industries in this zip code by the number of employees in 2005:
Management of Companies and Enterprises: Corporate, Subsidiary, and Regional Managing Offices (100-249 employees: 1 establishment)
Health Care and Social Assistance: Offices of Dentists (10-19: 1, 1-4: 1)
Health Care and Social Assistance: Offices of Physicians (except Mental Health Specialists) (10-19: 1)
Finance and Insurance: Credit Unions (5-9: 1)
Other Services (except Public Administration): Grantmaking Foundations (5-9: 1)
Finance and Insurance: Miscellaneous Intermediation (5-9: 1)
Other Services (except Public Administration): Religious Organizations (1-4: 3)
Health Care and Social Assistance: Offices of Optometrists (1-4: 1)
Home Mortgage Disclosure Act Aggregated Statistics For Year 2009 (Based on 2 partial tracts)
A) FHA, FSA/RHS & VA Home Purchase Loans
B) Conventional Home Purchase Loans
C) Refinancings
D) Home Improvement Loans
F) Non-occupant Loans on < 5 Family Dwellings (A B C & D)
Number
Average Value
Number
Average Value
Number
Average Value
Number
Average Value
Number
Average Value
LOANS ORIGINATED
10
$113,195
10
$117,069
29
$134,730
2
$39,380
4
$49,280
APPLICATIONS APPROVED, NOT ACCEPTED
0
$0
0
$0
2
$32,710
0
$0
1
$42,610
APPLICATIONS DENIED
3
$77,040
0
$0
14
$126,230
1
$34,000
0
$0
APPLICATIONS WITHDRAWN
1
$200,140
0
$0
6
$126,538
0
$0
0
$0
FILES CLOSED FOR INCOMPLETENESS
0
$0
0
$0
1
$111,040
0
$0
0
$0
Aggregated Statistics For Year 2008 (Based on 2 partial tracts)
A) FHA, FSA/RHS & VA Home Purchase Loans
B) Conventional Home Purchase Loans
C) Refinancings
D) Home Improvement Loans
F) Non-occupant Loans on < 5 Family Dwellings (A B C & D)
G) Loans On Manufactured Home Dwelling (A B C & D)
Number
Average Value
Number
Average Value
Number
Average Value
Number
Average Value
Number
Average Value
Number
Average Value
LOANS ORIGINATED
10
$104,329
18
$119,962
22
$110,280
3
$36,870
7
$69,971
1
$80,480
APPLICATIONS APPROVED, NOT ACCEPTED
0
$0
2
$160,325
4
$96,518
0
$0
1
$81,780
0
$0
APPLICATIONS DENIED
1
$93,400
3
$95,263
13
$94,092
3
$58,820
4
$76,828
0
$0
APPLICATIONS WITHDRAWN
2
$91,460
5
$101,144
9
$122,856
0
$0
2
$71,445
0
$0
FILES CLOSED FOR INCOMPLETENESS
0
$0
0
$0
2
$95,980
0
$0
0
$0
0
$0
Aggregated Statistics For Year 2007 (Based on 2 partial tracts)
A) FHA, FSA/RHS & VA Home Purchase Loans
B) Conventional Home Purchase Loans
C) Refinancings
D) Home Improvement Loans
F) Non-occupant Loans on < 5 Family Dwellings (A B C & D)
Number
Average Value
Number
Average Value
Number
Average Value
Number
Average Value
Number
Average Value
LOANS ORIGINATED
5
$119,652
43
$125,677
22
$104,998
3
$30,847
13
$103,726
APPLICATIONS APPROVED, NOT ACCEPTED
0
$0
2
$110,830
5
$101,230
1
$5,600
0
$0
APPLICATIONS DENIED
2
$73,815
4
$82,208
19
$77,359
3
$58,963
3
$53,657
APPLICATIONS WITHDRAWN
0
$0
1
$60,260
9
$98,658
0
$0
2
$89,095
FILES CLOSED FOR INCOMPLETENESS
0
$0
1
$49,070
3
$82,350
0
$0
1
$49,070
Aggregated Statistics For Year 2006 (Based on 2 partial tracts)
A) FHA, FSA/RHS & VA Home Purchase Loans
B) Conventional Home Purchase Loans
C) Refinancings
D) Home Improvement Loans
F) Non-occupant Loans on < 5 Family Dwellings (A B C & D)
Number
Average Value
Number
Average Value
Number
Average Value
Number
Average Value
Number
Average Value
LOANS ORIGINATED
4
$128,152
50
$91,529
24
$77,149
3
$62,550
11
$67,182
APPLICATIONS APPROVED, NOT ACCEPTED
0
$0
3
$125,820
3
$113,340
0
$0
0
$0
APPLICATIONS DENIED
0
$0
7
$69,971
24
$91,496
4
$30,342
3
$61,403
APPLICATIONS WITHDRAWN
1
$92,970
6
$110,900
11
$121,921
2
$34,860
1
$64,990
FILES CLOSED FOR INCOMPLETENESS
0
$0
2
$109,535
2
$82,420
0
$0
0
$0
Aggregated Statistics For Year 2005 (Based on 2 partial tracts)
A) FHA, FSA/RHS & VA Home Purchase Loans
B) Conventional Home Purchase Loans
C) Refinancings
D) Home Improvement Loans
F) Non-occupant Loans on < 5 Family Dwellings (A B C & D)
G) Loans On Manufactured Home Dwelling (A B C & D)
Number
Average Value
Number
Average Value
Number
Average Value
Number
Average Value
Number
Average Value
Number
Average Value
LOANS ORIGINATED
5
$113,454
31
$84,247
22
$83,635
2
$41,965
7
$61,916
0
$0
APPLICATIONS APPROVED, NOT ACCEPTED
0
$0
5
$58,276
6
$70,370
0
$0
2
$53,585
0
$0
APPLICATIONS DENIED
0
$0
5
$58,190
24
$99,261
5
$59,826
3
$62,983
1
$43,470
APPLICATIONS WITHDRAWN
0
$0
5
$92,450
8
$90,976
1
$191,530
0
$0
0
$0
FILES CLOSED FOR INCOMPLETENESS
0
$0
0
$0
2
$102,220
0
$0
0
$0
0
$0
Aggregated Statistics For Year 2004 (Based on 2 partial tracts)
A) FHA, FSA/RHS & VA Home Purchase Loans
B) Conventional Home Purchase Loans
C) Refinancings
D) Home Improvement Loans
F) Non-occupant Loans on < 5 Family Dwellings (A B C & D)
G) Loans On Manufactured Home Dwelling (A B C & D)
Number
Average Value
Number
Average Value
Number
Average Value
Number
Average Value
Number
Average Value
Number
Average Value
LOANS ORIGINATED
6
$115,633
25
$77,317
28
$76,534
3
$31,563
10
$64,345
0
$0
APPLICATIONS APPROVED, NOT ACCEPTED
0
$0
4
$66,068
5
$82,120
0
$0
1
$65,850
0
$0
APPLICATIONS DENIED
0
$0
6
$96,482
23
$80,073
3
$34,577
2
$61,760
3
$78,763
APPLICATIONS WITHDRAWN
2
$100,500
3
$116,207
6
$78,620
0
$0
2
$89,740
0
$0
FILES CLOSED FOR INCOMPLETENESS
0
$0
0
$0
2
$79,195
0
$0
0
$0
0
$0
Aggregated Statistics For Year 2003 (Based on 2 partial tracts)
A) FHA, FSA/RHS & VA Home Purchase Loans
B) Conventional Home Purchase Loans
C) Refinancings
D) Home Improvement Loans
F) Non-occupant Loans on < 5 Family Dwellings (A B C & D)
Number
Average Value
Number
Average Value
Number
Average Value
Number
Average Value
Number
Average Value
LOANS ORIGINATED
7
$114,917
22
$92,497
50
$86,424
4
$28,515
13
$67,838
APPLICATIONS APPROVED, NOT ACCEPTED
0
$0
2
$271,150
5
$79,538
0
$0
0
$0
APPLICATIONS DENIED
2
$121,160
5
$91,416
20
$82,702
3
$15,350
3
$71,447
APPLICATIONS WITHDRAWN
1
$123,520
3
$84,790
12
$88,698
0
$0
3
$47,917
FILES CLOSED FOR INCOMPLETENESS
0
$0
1
$163,120
1
$76,610
0
$0
0
$0
Aggregated Statistics For Year 2002 (Based on 2 partial tracts)
A) FHA, FSA/RHS & VA Home Purchase Loans
B) Conventional Home Purchase Loans
C) Refinancings
D) Home Improvement Loans
F) Non-occupant Loans on < 5 Family Dwellings (A B C & D)
Number
Average Value
Number
Average Value
Number
Average Value
Number
Average Value
Number
Average Value
LOANS ORIGINATED
9
$110,278
19
$91,381
38
$113,614
4
$10,438
7
$75,259
APPLICATIONS APPROVED, NOT ACCEPTED
0
$0
2
$55,520
6
$112,407
1
$31,420
0
$0
APPLICATIONS DENIED
1
$143,750
4
$37,338
18
$80,007
1
$10,760
2
$46,270
APPLICATIONS WITHDRAWN
2
$101,145
3
$91,677
6
$74,387
2
$25,825
0
$0
FILES CLOSED FOR INCOMPLETENESS
0
$0
1
$69,720
3
$85,937
0
$0
0
$0
Aggregated Statistics For Year 2001 (Based on 2 partial tracts)
A) FHA, FSA/RHS & VA Home Purchase Loans
B) Conventional Home Purchase Loans
C) Refinancings
D) Home Improvement Loans
F) Non-occupant Loans on < 5 Family Dwellings (A B C & D)
Number
Average Value
Number
Average Value
Number
Average Value
Number
Average Value
Number
Average Value
LOANS ORIGINATED
12
$105,089
16
$73,464
28
$72,369
3
$16,787
6
$55,522
APPLICATIONS APPROVED, NOT ACCEPTED
0
$0
3
$41,320
5
$86,252
0
$0
1
$24,960
APPLICATIONS DENIED
0
$0
11
$45,623
11
$63,073
5
$14,806
1
$68,860
APPLICATIONS WITHDRAWN
1
$153,650
3
$52,080
5
$100,284
1
$11,620
1
$74,890
FILES CLOSED FOR INCOMPLETENESS
0
$0
0
$0
3
$50,643
0
$0
1
$34,430
Aggregated Statistics For Year 2000 (Based on 2 partial tracts)
A) FHA, FSA/RHS & VA Home Purchase Loans
B) Conventional Home Purchase Loans
C) Refinancings
D) Home Improvement Loans
F) Non-occupant Loans on < 5 Family Dwellings (A B C & D)
Number
Average Value
Number
Average Value
Number
Average Value
Number
Average Value
Number
Average Value
LOANS ORIGINATED
10
$112,248
19
$80,054
14
$79,378
4
$18,292
3
$64,560
APPLICATIONS APPROVED, NOT ACCEPTED
1
$78,760
6
$38,665
5
$53,628
0
$0
0
$0
APPLICATIONS DENIED
3
$53,083
13
$57,342
12
$51,792
4
$9,685
0
$0
APPLICATIONS WITHDRAWN
1
$151,930
2
$117,500
8
$50,680
0
$0
1
$74,030
FILES CLOSED FOR INCOMPLETENESS
0
$0
0
$0
1
$32,710
0
$0
0
$0
Aggregated Statistics For Year 1999 (Based on 1 partial tract)
A) FHA, FSA/RHS & VA Home Purchase Loans
B) Conventional Home Purchase Loans
C) Refinancings
D) Home Improvement Loans
F) Non-occupant Loans on < 5 Family Dwellings (A B C & D)


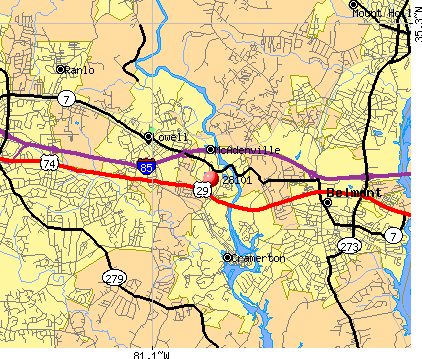 Nearest zip codes: 28098, 28032, 28012, 28056, 28054, 28120.


