According to our research of North Carolina and other state lists, there was 1 registered sex offender living in 28611 zip code as of May 30, 2024. The ratio of all residents to sex offenders in zip code 28611 is 1,520 to 1. The ratio of registered sex offenders to all residents in this zip code is much lower than the state average.
Median resident age:
This zip code:
73.3 years
North Carolina median age:
39.2 years
Average household size:
This zip code:
1.6 people
North Carolina:
2.4 people
Averages for the 2020 tax year for zip code 28611, filed in 2021:
Average Adjusted Gross Income (AGI) in 2020: $49,627 (Individual Income Tax Returns)
Here:
$49,627
State:
$70,020
Salary/wage: $44,352 (reported on 76.7% of returns)
Here:
$44,352
State:
$58,387
(% of AGI for various income ranges: 970.0% for AGIs below $25k, 3748.3% for AGIs $25k-50k, 6810.0% for AGIs $50k-75k, 5690.0% for AGIs $75k-100k)
Taxable interest for individuals: $278 (reported on 30.0% of returns)
This zip code:
$278
North Carolina:
$1,479
(% of AGI for various income ranges: 1.2% for AGIs below $25k, 10.0% for AGIs $25k-50k, 33.3% for AGIs $50k-75k)
Ordinary dividends: $1,900 (reported on 10.0% of returns)
Here:
$1,900
State:
$7,888
(% of AGI for various income ranges: 95.0% for AGIs $25k-50k)
Profit/loss from business: +$9,425 (reported on 13.3% of returns)
Here:
+$9,425
State:
+$11,710
(% of AGI for various income ranges: 471.3% for AGIs below $25k)
Earned income credit: $1,667 (reported on 20.0% of returns)
Here:
$1,667
State:
$2,337
(% of AGI for various income ranges: 125.0% for AGIs below $25k)
Percentage of individuals using paid preparers for their 2020 taxes: 93.3%
Here:
93%
State:
93%
(% for various income ranges: 90.9% for AGIs below $25k, 88.9% for AGIs $25k-50k, 100.0% for AGIs $50k-75k, 100.0% for AGIs $75k-100k, 100.0% for AGIs $100k-200k)
Averages for the 2012 tax year for zip code 28611, filed in 2013:
Average Adjusted Gross Income (AGI) in 2012: $34,542 (Individual Income Tax Returns)
Here:
$34,542
State:
$54,937
Salary/wage: $31,678 (reported on 87.1% of returns)
Here:
$31,678
State:
$46,336
(% of AGI for various income ranges: 79.1% for AGIs below $25k, 80.1% for AGIs $25k-50k, 87.5% for AGIs $50k-75k, 69.7% for AGIs $75k-100k)
Taxable interest for individuals: $362 (reported on 25.8% of returns)
This zip code:
$362
North Carolina:
$1,298
(% of AGI for various income ranges: 0.2% for AGIs below $25k, 0.1% for AGIs $25k-50k, 0.7% for AGIs $50k-75k)
Ordinary dividends: $1,400 (reported on 9.7% of returns)
Here:
$1,400
State:
$6,213
Net capital gain/loss in AGI: +$200 (reported on 6.5% of returns)
Here:
+$200
State:
+$12,740
Profit/loss from business: +$6,300 (reported on 19.4% of returns)
Here:
+$6,300
State:
+$10,311
Total itemized deductions: $17,200 (25% of AGI, reported on 16.1% of returns)
Here:
$17,200
State:
$23,438
Here:
25.4% of AGI
State:
21.5% of AGI
Charity contributions: $3,250 (reported on 12.9% of returns)
Here:
$3,250
State:
$4,687
Taxes paid: $4,920 (reported on 16.1% of returns)
28611:
$4,920
State:
$8,823
Earned income credit: $2,075 (reported on 25.8% of returns)
Here:
$2,075
State:
$2,376
(% of AGI for various income ranges: 5.9% for AGIs below $25k, 1.6% for AGIs $25k-50k)
Percentage of individuals using paid preparers for their 2012 taxes: 58.1%
Here:
58%
State:
53%
(% for various income ranges: 50.0% for AGIs below $25k, 60.0% for AGIs $25k-50k, 100.0% for AGIs $50k-75k)
Averages for the 2004 tax year for zip code 28611, filed in 2005:
Average Adjusted Gross Income (AGI) in 2004: $31,753 (Individual Income Tax Returns)
Here:
$31,753
State:
$45,376
Salary/wage: $28,829 (reported on 85.9% of returns)
Here:
$28,829
State:
$39,442
(% of AGI for various income ranges: 78.7% for AGIs below $10k, 76.0% for AGIs $10k-25k, 88.5% for AGIs $25k-50k, 77.1% for AGIs $50k-75k, 85.4% for AGIs $75k-100k, 53.6% for AGIs over 100k)
Taxable interest for individuals: $368 (reported on 30.5% of returns)
This zip code:
$368
North Carolina:
$1,515
(% of AGI for various income ranges: 0.8% for AGIs below $10k, 0.6% for AGIs $10k-25k, 0.2% for AGIs $25k-50k, 0.3% for AGIs $50k-75k, 0.9% for AGIs $75k-100k)
Taxable dividends: $537 (reported on 11.8% of returns)
Here:
$537
State:
$4,016
Net capital gain/loss: +$1,360 (reported on 7.2% of returns)
Here:
+$1,360
State:
+$11,152
Profit/loss from business: +$6,833 (reported on 19.0% of returns)
Here:
+$6,833
State:
+$9,490
(% of AGI for various income ranges: 9.9% for AGIs below $10k, 11.5% for AGIs $10k-25k, 1.6% for AGIs $25k-50k, 5.3% for AGIs $50k-75k)
Total itemized deductions: $14,762 (23% of AGI, reported on 18.1% of returns)
Here:
$14,762
State:
$19,464
Here:
22.7% of AGI
State:
22.7% of AGI
Charity contributions deductions: $2,674 (4% of AGI, reported on 13.2% of returns)
Here:
$2,674
State:
$4,035
Here:
4.0% of AGI
State:
4.5% of AGI
Total tax: $3,500 (reported on 77.6% of returns)
28611:
$3,500
State:
$7,257
(% of AGI for various income ranges: 3.6% for AGIs below $10k, 4.9% for AGIs $10k-25k, 6.1% for AGIs $25k-50k, 8.9% for AGIs $50k-75k, 9.6% for AGIs $75k-100k, 18.4% for AGIs over 100k)
Earned income credit: $1,707 (reported on 23.6% of returns)
Here:
$1,707
State:
$1,851
Percentage of individuals using paid preparers for their 2004 taxes: 62.9%
Here:
63%
State:
62%
(% for various income ranges: 51.4% for AGIs below $10k, 66.1% for AGIs $10k-25k, 65.0% for AGIs $25k-50k, 61.9% for AGIs $50k-75k, 154.5% for AGIs $75k-100k)
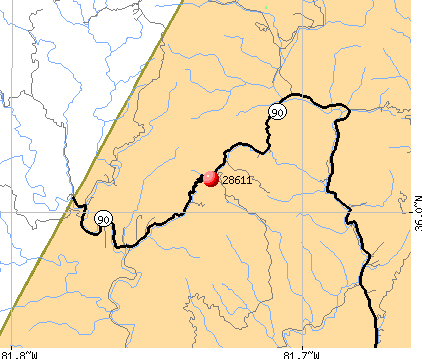
Notable locations in zip code 28611: Mortimer Recreation Area (A), Mortimer Work Center (B), Coffeys (C), Johns River Camp (D). Display/hide their locations on the map
Churches in zip code 28611 include: New Hopewell Church (A), Green Valley Church (B), Edgemont Baptist Church (C), Maple Grove Baptist Church (D), Rocky Springs Baptist Church (E). Display/hide their locations on the map
Cemeteries: Greene Cemetery (1), Gragg Cemetery (2), Cary Flat Cemetery (3), Globe Cemetery (4), Moore Cemetery (5), Rich Cemetery (6). Display/hide their locations on the map
Streams, rivers, and creeks: Phillips Branch (A), House Branch (B), Simmons Branch (C), Horsepen Creek (D), Hopewell Branch (E), Harper Creek (F), Gragg Prong (G), Globe Mountain Branch (H), Franklin Branch (I). Display/hide their locations on the map
101.3% of residents of 28611 zip code speak English at home.
Foreign born population: 0 (0.0%)
:
0.0%
Whole state:
8.6%
22%Scottish
16%English
Facilities with environmental interests located in this zip code:
COLLETTSVILLE ELEMENTARY SCHOOL (4690 COLLETTSVILLE DRIVE in COLLETTSVILLE, NC)
STATE MASTER (North Carolina facility info) - UNDERGROUND STORAGE TANK PROGRAM National Pollutant Discharge Elimination System NON-MAJOR (Tracking pollutant discharge elimination systems) - permit Business SIC classification: ELEMENTARY AND SECONDARY SCHOOLS; NONCLASSIFIABLE ESTABLISHMENTS Alternative names: CALDWELL CO SCH-COLLETTSVILLE
COLLETTSVILLE ELEMENTARY (COLLETTSVILLE RD in COLLETTSVILLE, NC)
(National Center for Education Statistics) - STATE ID-308 Organizations: CALDWELL COUNTY SCHOOLS (SCHOOL DISTRICT)
35.3%Fuel oil, kerosene, etc.
28.5%Electricity
19.4%Bottled, tank, or LP gas
19.4%Wood
Population in 1990: 2,121.
Place of birth for U.S.-born residents:
This state: 107
Midwest: 17
South: 26
74% of the 28611 zip code residents lived in the same house 5 years ago. Out of people who lived in different houses, 46% lived in this county. Out of people who lived in different counties, 50% lived in North Carolina.
101% of the 28611 zip code residents lived in the same house 1 year ago.
Top industries in this zip code by the number of employees in 2005:
Health Care and Social Assistance: Offices of Physicians (except Mental Health Specialists) (5-9 employees: 1 establishment)
Arts, Entertainment, and Recreation: All Other Amusement and Recreation Industries (1-4: 1)
Professional, Scientific, and Technical Services: Offices of Lawyers (1-4: 1)
Other Services (except Public Administration): Civic and Social Organizations (1-4: 1)
Construction: Plumbing, Heating, and Air-Conditioning Contractors (1-4: 1)
Home Mortgage Disclosure Act Aggregated Statistics For Year 2009 (Based on 2 partial tracts)
A) FHA, FSA/RHS & VA Home Purchase Loans
B) Conventional Home Purchase Loans
C) Refinancings
D) Home Improvement Loans
F) Non-occupant Loans on < 5 Family Dwellings (A B C & D)
G) Loans On Manufactured Home Dwelling (A B C & D)
Number
Average Value
Number
Average Value
Number
Average Value
Number
Average Value
Number
Average Value
Number
Average Value
LOANS ORIGINATED
7
$98,786
11
$78,705
48
$122,165
2
$56,240
5
$107,136
6
$45,947
APPLICATIONS APPROVED, NOT ACCEPTED
0
$0
0
$0
6
$95,427
0
$0
0
$0
0
$0
APPLICATIONS DENIED
0
$0
8
$74,106
29
$116,108
3
$21,207
4
$119,630
8
$58,892
APPLICATIONS WITHDRAWN
1
$58,090
2
$151,210
9
$88,102
1
$82,980
0
$0
1
$51,630
FILES CLOSED FOR INCOMPLETENESS
0
$0
1
$173,340
4
$84,362
0
$0
0
$0
0
$0
Aggregated Statistics For Year 2008 (Based on 2 partial tracts)
A) FHA, FSA/RHS & VA Home Purchase Loans
B) Conventional Home Purchase Loans
C) Refinancings
D) Home Improvement Loans
F) Non-occupant Loans on < 5 Family Dwellings (A B C & D)
G) Loans On Manufactured Home Dwelling (A B C & D)
Number
Average Value
Number
Average Value
Number
Average Value
Number
Average Value
Number
Average Value
Number
Average Value
LOANS ORIGINATED
10
$113,775
15
$92,200
42
$105,305
2
$61,315
10
$96,626
6
$76,372
APPLICATIONS APPROVED, NOT ACCEPTED
0
$0
4
$63,848
8
$68,574
0
$0
4
$50,710
1
$46,100
APPLICATIONS DENIED
3
$74,373
4
$83,440
38
$107,340
6
$78,523
3
$119,553
6
$72,223
APPLICATIONS WITHDRAWN
0
$0
3
$235,417
13
$99,434
1
$82,980
2
$295,040
2
$43,335
FILES CLOSED FOR INCOMPLETENESS
0
$0
0
$0
4
$147,520
1
$2,770
0
$0
0
$0
Aggregated Statistics For Year 2007 (Based on 2 partial tracts)
A) FHA, FSA/RHS & VA Home Purchase Loans
B) Conventional Home Purchase Loans
C) Refinancings
D) Home Improvement Loans
F) Non-occupant Loans on < 5 Family Dwellings (A B C & D)
G) Loans On Manufactured Home Dwelling (A B C & D)
Number
Average Value
Number
Average Value
Number
Average Value
Number
Average Value
Number
Average Value
Number
Average Value
LOANS ORIGINATED
8
$97,501
35
$108,058
53
$107,717
11
$16,428
13
$78,795
13
$61,916
APPLICATIONS APPROVED, NOT ACCEPTED
0
$0
4
$97,040
8
$120,898
3
$36,267
1
$9,220
2
$88,050
APPLICATIONS DENIED
2
$87,590
15
$82,550
51
$89,543
3
$48,250
4
$70,302
6
$65,615
APPLICATIONS WITHDRAWN
0
$0
2
$42,875
22
$101,294
0
$0
1
$36,880
5
$40,568
FILES CLOSED FOR INCOMPLETENESS
0
$0
2
$59,930
1
$423,200
1
$10,140
0
$0
1
$10,140
Aggregated Statistics For Year 2006 (Based on 2 partial tracts)
A) FHA, FSA/RHS & VA Home Purchase Loans
B) Conventional Home Purchase Loans
C) Refinancings
D) Home Improvement Loans
E) Loans on Dwellings For 5+ Families
F) Non-occupant Loans on < 5 Family Dwellings (A B C & D)
G) Loans On Manufactured Home Dwelling (A B C & D)
Number
Average Value
Number
Average Value
Number
Average Value
Number
Average Value
Number
Average Value
Number
Average Value
Number
Average Value
LOANS ORIGINATED
8
$101,881
39
$92,176
51
$89,868
7
$36,880
1
$41,490
18
$101,932
9
$68,126
APPLICATIONS APPROVED, NOT ACCEPTED
0
$0
5
$64,724
22
$93,876
0
$0
0
$0
1
$33,190
3
$58,087
APPLICATIONS DENIED
0
$0
11
$99,744
44
$78,789
5
$14,384
0
$0
4
$46,560
9
$63,516
APPLICATIONS WITHDRAWN
1
$184,400
3
$70,073
28
$121,968
1
$55,320
0
$0
1
$69,150
0
$0
FILES CLOSED FOR INCOMPLETENESS
0
$0
0
$0
8
$103,725
0
$0
0
$0
0
$0
0
$0
Aggregated Statistics For Year 2005 (Based on 2 partial tracts)
A) FHA, FSA/RHS & VA Home Purchase Loans
B) Conventional Home Purchase Loans
C) Refinancings
D) Home Improvement Loans
F) Non-occupant Loans on < 5 Family Dwellings (A B C & D)
G) Loans On Manufactured Home Dwelling (A B C & D)
Number
Average Value
Number
Average Value
Number
Average Value
Number
Average Value
Number
Average Value
Number
Average Value
LOANS ORIGINATED
13
$101,207
41
$83,385
49
$70,185
3
$31,040
8
$49,211
11
$52,051
APPLICATIONS APPROVED, NOT ACCEPTED
1
$102,340
4
$44,255
17
$91,115
3
$31,657
2
$56,240
2
$92,660
APPLICATIONS DENIED
1
$75,600
18
$80,624
73
$80,707
6
$69,918
6
$57,778
28
$63,585
APPLICATIONS WITHDRAWN
0
$0
6
$78,832
32
$80,906
3
$52,247
3
$98,653
5
$51,632
FILES CLOSED FOR INCOMPLETENESS
0
$0
0
$0
6
$87,283
2
$92,200
1
$89,430
1
$78,370
Aggregated Statistics For Year 2004 (Based on 2 partial tracts)
A) FHA, FSA/RHS & VA Home Purchase Loans
B) Conventional Home Purchase Loans
C) Refinancings
D) Home Improvement Loans
F) Non-occupant Loans on < 5 Family Dwellings (A B C & D)
G) Loans On Manufactured Home Dwelling (A B C & D)
Number
Average Value
Number
Average Value
Number
Average Value
Number
Average Value
Number
Average Value
Number
Average Value
LOANS ORIGINATED
11
$80,298
32
$88,138
81
$81,284
9
$50,506
15
$61,159
12
$66,000
APPLICATIONS APPROVED, NOT ACCEPTED
2
$100,035
6
$75,450
13
$81,420
2
$20,745
3
$49,173
3
$52,553
APPLICATIONS DENIED
0
$0
19
$77,060
70
$82,466
12
$41,337
3
$48,560
17
$58,682
APPLICATIONS WITHDRAWN
0
$0
1
$47,020
27
$84,312
1
$19,360
2
$53,015
1
$51,630
FILES CLOSED FOR INCOMPLETENESS
0
$0
1
$100,500
7
$116,040
1
$18,440
0
$0
1
$119,860
Aggregated Statistics For Year 2003 (Based on 2 partial tracts)
A) FHA, FSA/RHS & VA Home Purchase Loans
B) Conventional Home Purchase Loans
C) Refinancings
D) Home Improvement Loans
F) Non-occupant Loans on < 5 Family Dwellings (A B C & D)
Number
Average Value
Number
Average Value
Number
Average Value
Number
Average Value
Number
Average Value
LOANS ORIGINATED
6
$96,963
28
$81,762
127
$79,546
18
$45,486
12
$58,778
APPLICATIONS APPROVED, NOT ACCEPTED
0
$0
3
$90,357
18
$65,411
2
$28,580
0
$0
APPLICATIONS DENIED
1
$99,580
13
$58,298
48
$84,670
5
$38,170
4
$64,310
APPLICATIONS WITHDRAWN
0
$0
4
$50,710
18
$103,623
0
$0
2
$127,695
FILES CLOSED FOR INCOMPLETENESS
0
$0
1
$71,920
3
$81,137
0
$0
0
$0
Aggregated Statistics For Year 2002 (Based on 2 partial tracts)
A) FHA, FSA/RHS & VA Home Purchase Loans
B) Conventional Home Purchase Loans
C) Refinancings
D) Home Improvement Loans
F) Non-occupant Loans on < 5 Family Dwellings (A B C & D)
Number
Average Value
Number
Average Value
Number
Average Value
Number
Average Value
Number
Average Value
LOANS ORIGINATED
1
$69,150
38
$65,972
87
$78,497
10
$55,136
12
$59,162
APPLICATIONS APPROVED, NOT ACCEPTED
0
$0
6
$41,490
19
$52,991
2
$5,070
3
$34,730
APPLICATIONS DENIED
0
$0
14
$50,512
52
$64,274
3
$10,143
2
$20,285
APPLICATIONS WITHDRAWN
0
$0
2
$47,945
23
$72,958
1
$22,130
1
$51,630
FILES CLOSED FOR INCOMPLETENESS
0
$0
1
$72,840
4
$55,320
0
$0
0
$0
Aggregated Statistics For Year 2001 (Based on 2 partial tracts)
A) FHA, FSA/RHS & VA Home Purchase Loans
B) Conventional Home Purchase Loans
C) Refinancings
D) Home Improvement Loans
F) Non-occupant Loans on < 5 Family Dwellings (A B C & D)
Number
Average Value
Number
Average Value
Number
Average Value
Number
Average Value
Number
Average Value
LOANS ORIGINATED
5
$80,030
29
$60,820
101
$71,040
15
$20,038
10
$56,334
APPLICATIONS APPROVED, NOT ACCEPTED
0
$0
6
$46,715
18
$64,694
0
$0
1
$33,190
APPLICATIONS DENIED
0
$0
23
$48,986
39
$64,067
7
$13,434
0
$0
APPLICATIONS WITHDRAWN
0
$0
2
$113,405
18
$59,213
0
$0
1
$36,880
FILES CLOSED FOR INCOMPLETENESS
0
$0
0
$0
3
$74,373
0
$0
0
$0
Aggregated Statistics For Year 2000 (Based on 2 partial tracts)
A) FHA, FSA/RHS & VA Home Purchase Loans
B) Conventional Home Purchase Loans
C) Refinancings
D) Home Improvement Loans
F) Non-occupant Loans on < 5 Family Dwellings (A B C & D)
Number
Average Value
Number
Average Value
Number
Average Value
Number
Average Value
Number
Average Value
LOANS ORIGINATED
3
$73,453
32
$71,830
46
$67,286
15
$14,752
8
$65,922
APPLICATIONS APPROVED, NOT ACCEPTED
1
$27,660
6
$51,172
11
$57,918
4
$29,965
1
$51,630
APPLICATIONS DENIED
3
$38,110
37
$49,165
42
$55,166
6
$21,820
6
$53,937
APPLICATIONS WITHDRAWN
0
$0
7
$54,661
21
$64,760
1
$2,770
5
$40,568
FILES CLOSED FOR INCOMPLETENESS
0
$0
1
$48,870
4
$48,175
0
$0
0
$0
Aggregated Statistics For Year 1999 (Based on 1 partial tract)
A) FHA, FSA/RHS & VA Home Purchase Loans
B) Conventional Home Purchase Loans
C) Refinancings
D) Home Improvement Loans
F) Non-occupant Loans on < 5 Family Dwellings (A B C & D)
Detailed PMIC statistics for the following Tracts:0309.00
2002 - 2018 National Fire Incident Reporting System (NFIRS) incidents
According to the data from the years 2002 - 2018 the average number of fires per year is 7. The highest number of fire incidents - 19 took place in 2004, and the least - 0 in 2006. The data has a growing trend.
When looking into fire subcategories, the most reports belonged to: Structure Fires (44.0%), and Outside Fires (41.4%).
Fire incident types reported to NFIRS in Zip Code 28611

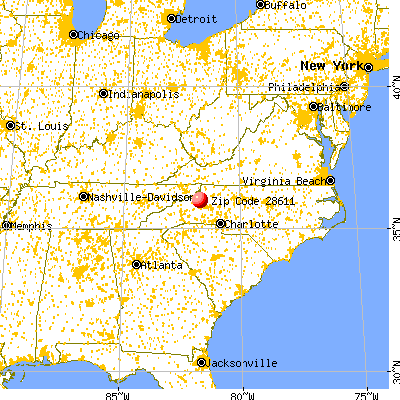


 Nearest zip codes: 28605, 28646, 28662, 28616, 28645, 28657.


 According to the data from the years 2002 - 2018 the average number of fires per year is 7. The highest number of fire incidents - 19 took place in 2004, and the least - 0 in 2006. The data has a growing trend.
 When looking into fire subcategories, the most reports belonged to: Structure Fires (44.0%), and Outside Fires (41.4%).