Estimated zip code population in 2022: 3,210 Zip code population in 2010: 3,495 Zip code population in 2000: 2,865
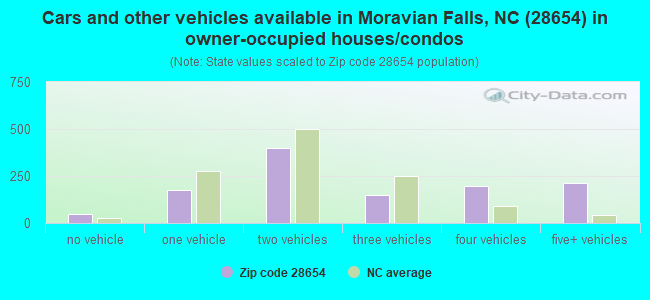
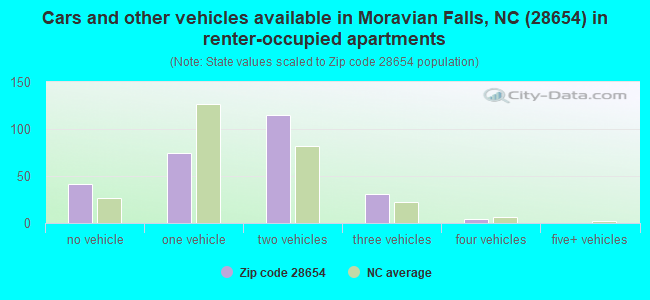
Houses and condos: 1,926 Renter-occupied apartments: 268
% of renters here:
18%
State:
33%
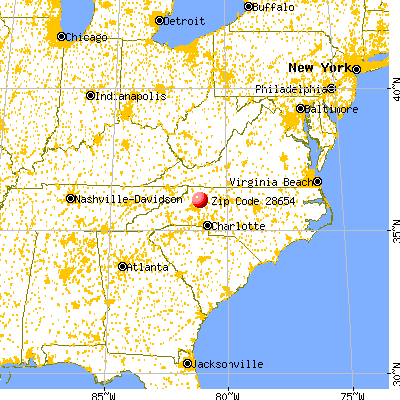
March 2022 cost of living index in zip code 28654: 82.7 (low, U.S. average is 100)
Land area: 62.8 sq. mi. Water area: 0.0 sq. mi.
Population density: 51 people per square mile
(very low).
OSM Map
General Map
Google Map
MSN Map
OSM Map
General Map
Google Map
MSN Map
OSM Map
General Map
Google Map
MSN Map
OSM Map
General Map
Google Map
MSN Map
Please wait while loading the map...
Real estate property taxes paid for housing units in 2022:
This zip code:
0.4% ($960)
North Carolina:
0.6% ($1,769)
Median real estate property taxes paid for housing units with mortgages in 2022: $1,056 (0.4%) Median real estate property taxes paid for housing units with no mortgage in 2022: $937 (0.4%)
Business Search- 14 Million verified businesses
Males: 1,614
(50.3%)
Females: 1,596
(49.7%)
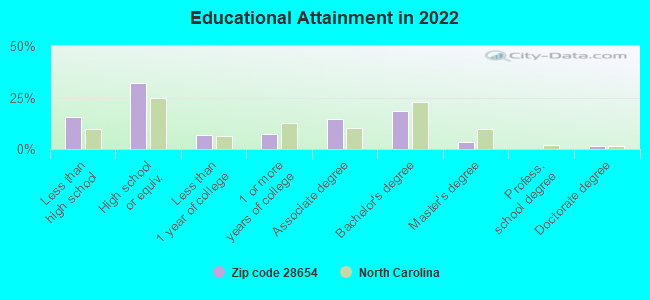
For population 25 years and over in 28654:
High school or higher: 83.6%
Bachelor's degree or higher: 23.3%
Graduate or professional degree: 5.1%
Unemployed: 0.3%
Mean travel time to work (commute): 35.3 minutes
For population 15 years and over in 28654:
Never married: 28.1%
Now married: 52.4%
Separated: 2.7%
Widowed: 3.9%
Divorced: 12.9%
Zip code 28654 compared to state average:
Unemployed percentage significantly below state average.
Black race population percentage significantly below state average.
Hispanic race population percentage significantly below state average.
Median age significantly above state average.
Foreign-born population percentage below state average.
Renting percentage below state average.
Length of stay since moving in significantly above state average.
Averages for the 2020 tax year for zip code 28654, filed in 2021:
Average Adjusted Gross Income (AGI) in 2020: $53,861 (Individual Income Tax Returns)
Here:
$53,861
State:
$70,020
Salary/wage: $41,817 (reported on 78.8% of returns)
Here:
$41,817
State:
$58,387
(% of AGI for various income ranges: 1155.1% for AGIs below $25k, 3787.4% for AGIs $25k-50k, 6446.7% for AGIs $50k-75k, 8853.3% for AGIs $75k-100k, 14555.6% for AGIs $100k-200k)
Taxable interest for individuals: $1,215 (reported on 29.4% of returns)
This zip code:
$1,215
North Carolina:
$1,479
(% of AGI for various income ranges: 10.9% for AGIs below $25k, 18.7% for AGIs $25k-50k, 28.7% for AGIs $50k-75k, 57.8% for AGIs $75k-100k, 167.8% for AGIs $100k-200k)
Ordinary dividends: $10,703 (reported on 18.1% of returns)
Here:
$10,703
State:
$7,888
(% of AGI for various income ranges: 33.3% for AGIs below $25k, 43.9% for AGIs $25k-50k, 90.0% for AGIs $50k-75k, 326.7% for AGIs $75k-100k, 507.8% for AGIs $100k-200k)
Net capital gain/loss in AGI: +$26,924 (reported on 15.6% of returns)
Here:
+$26,924
State:
+$23,652
(% of AGI for various income ranges: 18.9% for AGIs below $25k, 32.6% for AGIs $25k-50k, 134.7% for AGIs $50k-75k, 433.3% for AGIs $75k-100k, 1037.8% for AGIs $100k-200k)
Profit/loss from business: +$7,540 (reported on 18.8% of returns)
Here:
+$7,540
State:
+$11,710
(% of AGI for various income ranges: 154.2% for AGIs below $25k, 147.4% for AGIs $25k-50k, 265.3% for AGIs $50k-75k, 245.6% for AGIs $75k-100k, 546.7% for AGIs $100k-200k)
Taxable individual retirement arrangement distribution: $19,180 (reported on 9.4% of returns)
28654:
$19,180
North Carolina:
$20,247
(% of AGI for various income ranges: 55.1% for AGIs below $25k, 131.3% for AGIs $25k-50k, 286.0% for AGIs $50k-75k, 614.4% for AGIs $75k-100k, 1377.8% for AGIs $100k-200k)
Total itemized deductions: $42,371 (reported on 4.4% of returns)
Here:
$42,371
State:
$34,549
(% of AGI for various income ranges: 231.3% for AGIs $25k-50k, 917.8% for AGIs $100k-200k)
Charity contributions: $24,150 (reported on 3.8% of returns)
Here:
$24,150
State:
$13,360
(% of AGI for various income ranges: 95.2% for AGIs $25k-50k, 338.9% for AGIs $100k-200k)
Taxes paid: $8,157 (reported on 4.4% of returns)
28654:
$8,157
State:
$7,586
(% of AGI for various income ranges: 45.2% for AGIs $25k-50k, 211.1% for AGIs $100k-200k)
Earned income credit: $2,139 (reported on 20.6% of returns)
Here:
$2,139
State:
$2,337
(% of AGI for various income ranges: 101.1% for AGIs below $25k, 81.0% for AGIs $25k-50k)
Percentage of individuals using paid preparers for their 2020 taxes: 95.6%
Here:
96%
State:
93%
(% for various income ranges: 95.2% for AGIs below $25k, 97.6% for AGIs $25k-50k, 95.5% for AGIs $50k-75k, 92.9% for AGIs $75k-100k, 93.8% for AGIs $100k-200k, 100.0% for AGIs over 200k)
Averages for the 2012 tax year for zip code 28654, filed in 2013:
Average Adjusted Gross Income (AGI) in 2012: $39,343 (Individual Income Tax Returns)
Here:
$39,343
State:
$54,937
Salary/wage: $33,501 (reported on 81.8% of returns)
Here:
$33,501
State:
$46,336
(% of AGI for various income ranges: 75.1% for AGIs below $25k, 81.2% for AGIs $25k-50k, 73.4% for AGIs $50k-75k, 63.6% for AGIs $75k-100k, 101.9% for AGIs $100k-200k)
Taxable interest for individuals: $706 (reported on 32.5% of returns)
This zip code:
$706
North Carolina:
$1,298
(% of AGI for various income ranges: 0.8% for AGIs below $25k, 0.2% for AGIs $25k-50k, 0.6% for AGIs $50k-75k, 0.9% for AGIs $75k-100k, 1.1% for AGIs $100k-200k)
Ordinary dividends: $6,029 (reported on 15.6% of returns)
Here:
$6,029
State:
$6,213
(% of AGI for various income ranges: 1.0% for AGIs below $25k, 0.7% for AGIs $25k-50k, 1.1% for AGIs $50k-75k, 2.1% for AGIs $75k-100k, 9.6% for AGIs $100k-200k)
Net capital gain/loss in AGI: +$10,561 (reported on 11.7% of returns)
Here:
+$10,561
State:
+$12,740
(% of AGI for various income ranges: 0.3% for AGIs $25k-50k, 1.1% for AGIs $50k-75k, 0.6% for AGIs $75k-100k, 16.4% for AGIs $100k-200k)
Profit/loss from business: +$6,063 (reported on 17.5% of returns)
Here:
+$6,063
State:
+$10,311
(% of AGI for various income ranges: 8.5% for AGIs below $25k, 1.7% for AGIs $25k-50k, 2.8% for AGIs $50k-75k, 2.9% for AGIs $75k-100k, 0.3% for AGIs $100k-200k)
Taxable individual retirement arrangement distribution: $16,973 (reported on 9.7% of returns)
28654:
$16,973
North Carolina:
$15,575
(% of AGI for various income ranges: 3.5% for AGIs below $25k, 2.0% for AGIs $25k-50k, 3.7% for AGIs $50k-75k, 8.0% for AGIs $75k-100k, 8.9% for AGIs $100k-200k)
Total itemized deductions: $20,591 (23% of AGI, reported on 22.1% of returns)
Here:
$20,591
State:
$23,438
Here:
23.1% of AGI
State:
21.5% of AGI
(% of AGI for various income ranges: 5.6% for AGIs below $25k, 8.6% for AGIs $25k-50k, 10.8% for AGIs $50k-75k, 13.7% for AGIs $75k-100k, 19.8% for AGIs $100k-200k, 12.6% for AGIs over 200k)
Charity contributions: $5,577 (reported on 19.5% of returns)
Here:
$5,577
State:
$4,687
(% of AGI for various income ranges: 0.7% for AGIs below $25k, 1.7% for AGIs $25k-50k, 2.3% for AGIs $50k-75k, 4.0% for AGIs $75k-100k, 4.9% for AGIs $100k-200k, 3.9% for AGIs over 200k)
Taxes paid: $6,700 (reported on 22.1% of returns)
28654:
$6,700
State:
$8,823
(% of AGI for various income ranges: 0.8% for AGIs below $25k, 1.9% for AGIs $25k-50k, 3.1% for AGIs $50k-75k, 4.5% for AGIs $75k-100k, 7.2% for AGIs $100k-200k, 6.6% for AGIs over 200k)
Earned income credit: $2,229 (reported on 27.3% of returns)
Here:
$2,229
State:
$2,376
(% of AGI for various income ranges: 7.6% for AGIs below $25k, 1.5% for AGIs $25k-50k)
Percentage of individuals using paid preparers for their 2012 taxes: 66.9%
Here:
67%
State:
53%
(% for various income ranges: 63.6% for AGIs below $25k, 66.7% for AGIs $25k-50k, 70.0% for AGIs $50k-75k, 75.0% for AGIs $75k-100k, 100.0% for AGIs $100k-200k)
Averages for the 2004 tax year for zip code 28654, filed in 2005:
Average Adjusted Gross Income (AGI) in 2004: $34,275 (Individual Income Tax Returns)
Here:
$34,275
State:
$45,376
Salary/wage: $28,773 (reported on 86.8% of returns)
Here:
$28,773
State:
$39,442
(% of AGI for various income ranges: 87.9% for AGIs below $10k, 82.4% for AGIs $10k-25k, 83.5% for AGIs $25k-50k, 81.9% for AGIs $50k-75k, 60.2% for AGIs $75k-100k, 46.1% for AGIs over 100k)
Taxable interest for individuals: $872 (reported on 37.4% of returns)
This zip code:
$872
North Carolina:
$1,515
(% of AGI for various income ranges: 3.0% for AGIs below $10k, 1.2% for AGIs $10k-25k, 0.5% for AGIs $25k-50k, 0.8% for AGIs $50k-75k, 0.9% for AGIs $75k-100k, 1.3% for AGIs over 100k)
Taxable dividends: $2,980 (reported on 18.8% of returns)
Here:
$2,980
State:
$4,016
(% of AGI for various income ranges: 0.9% for AGIs below $10k, 0.8% for AGIs $10k-25k, 0.8% for AGIs $25k-50k, 0.6% for AGIs $50k-75k, 1.1% for AGIs $75k-100k, 5.0% for AGIs over 100k)
Net capital gain/loss: +$11,845 (reported on 14.2% of returns)
Here:
+$11,845
State:
+$11,152
(% of AGI for various income ranges: -2.0% for AGIs below $10k, 0.8% for AGIs $10k-25k, 1.1% for AGIs $25k-50k, 1.9% for AGIs $50k-75k, 5.8% for AGIs $75k-100k, 17.2% for AGIs over 100k)
Profit/loss from business: +$6,257 (reported on 19.2% of returns)
Here:
+$6,257
State:
+$9,490
(% of AGI for various income ranges: 15.0% for AGIs below $10k, 6.1% for AGIs $10k-25k, 4.2% for AGIs $25k-50k, 3.9% for AGIs $50k-75k, 0.7% for AGIs $75k-100k, 0.1% for AGIs over 100k)
IRA payment deduction: $2,972 (reported on 2.3% of returns)
28654:
$2,972
North Carolina:
$2,967
Total itemized deductions: $17,970 (25% of AGI, reported on 23.4% of returns)
Here:
$17,970
State:
$19,464
Here:
25.2% of AGI
State:
22.7% of AGI
(% of AGI for various income ranges: 6.9% for AGIs $10k-25k, 9.3% for AGIs $25k-50k, 14.0% for AGIs $50k-75k, 17.4% for AGIs $75k-100k, 17.3% for AGIs over 100k)
Charity contributions deductions: $5,245 (7% of AGI, reported on 20.0% of returns)
Here:
$5,245
State:
$4,035
Here:
7.1% of AGI
State:
4.5% of AGI
(% of AGI for various income ranges: 1.0% for AGIs $10k-25k, 1.8% for AGIs $25k-50k, 3.0% for AGIs $50k-75k, 3.7% for AGIs $75k-100k, 6.5% for AGIs over 100k)
Total tax: $4,283 (reported on 69.3% of returns)
28654:
$4,283
State:
$7,257
(% of AGI for various income ranges: 3.8% for AGIs below $10k, 3.5% for AGIs $10k-25k, 6.2% for AGIs $25k-50k, 8.7% for AGIs $50k-75k, 10.8% for AGIs $75k-100k, 15.5% for AGIs over 100k)
Earned income credit: $1,858 (reported on 23.5% of returns)
Here:
$1,858
State:
$1,851
Percentage of individuals using paid preparers for their 2004 taxes: 70.3%
Here:
70%
State:
62%
(% for various income ranges: 64.5% for AGIs below $10k, 69.2% for AGIs $10k-25k, 73.6% for AGIs $25k-50k, 68.0% for AGIs $50k-75k, 84.0% for AGIs $75k-100k, 80.6% for AGIs over 100k)
Household received Food Stamps/SNAP in the past 12 months: 45 Household did not receive Food Stamps/SNAP in the past 12 months: 1,387
Women who did not have a birth in the past 12 months: 599 (229 now married, 369 unmarried)
Housing units in zip code 28654 with a mortgage: 632 (100 second mortgage, 105 both second mortgage and home equity loan) Houses without a mortgage: 31
Median monthly owner costs for units with a mortgage: $1,053 Median monthly owner costs for units without a mortgage: $319
Residents with income below the poverty level in 2022:
This zip code:
10.4%
Whole state:
12.8%
Residents with income below 50% of the poverty level in 2022:
This zip code:
5.8%
Whole state:
6.8%
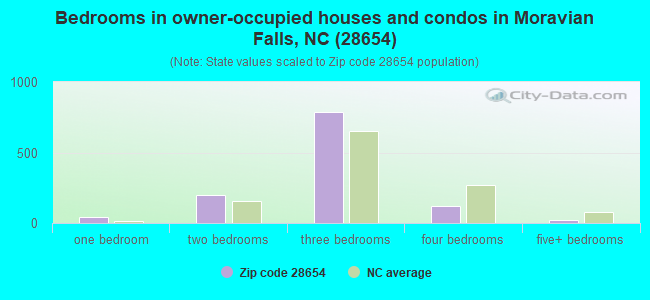
Median number of rooms in houses and condos:
Here:
6.0
State:
6.4
Median number of rooms in apartments:
Here:
4.8
State:
4.4
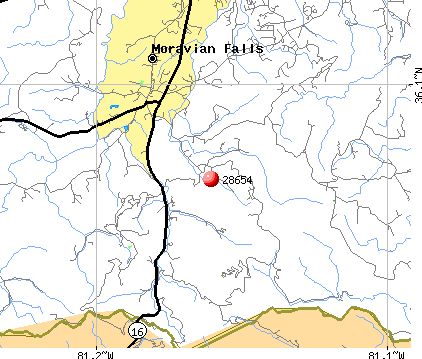
Notable locations in this zip code not listed on our city pages
Notable locations in zip code 28654: Big R Orchards (A), Brushy Mountain Farm and Orchard (B), D H Orchards (C), Hareapple Farm (D), Lowell Hendren Orchards (E), McKinney Orchard and Gardens (F), Parker's Orchard (G), Perry Lowe Orchards (H), Tevepaugh Orchards (I). Display/hide their locations on the map
Churches in zip code 28654 include: Liberty Church (A), Bethany Church (B), Walnut Grove Baptist Church (C), Mount Carmel Church (D), Mount Olive Church (E), New Hope Church (F), Cherry Grove Baptist Church (G), Piney Grove Church (H), Rocky Creek Church (I). Display/hide their locations on the map
In group quarters: 5 (-1 institutionalized population)
Size of family households: 548 2-persons, 176 3-persons, 73 4-persons, 70 5-persons, 24 6-persons, 7 7-or-more-persons
Size of nonfamily households: 376 1-person, 152 2-persons, 23 3-persons
238 married couples with children.
101 single-parent households (16 men, 85 women).
92.8% of residents of 28654 zip code speak English at home.
2.0% of residents speak Spanish at home (100% very well).
2.7% of residents speak other Indo-European language at home (100% very well).
2.9% of residents speak Asian or Pacific Island language at home (100% well).
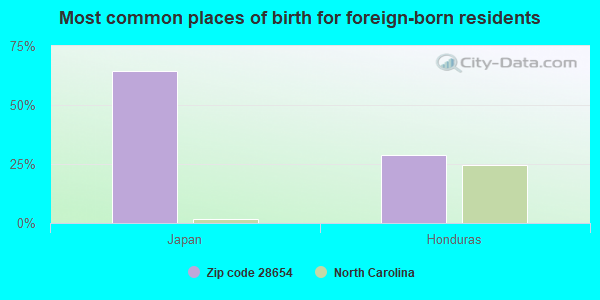
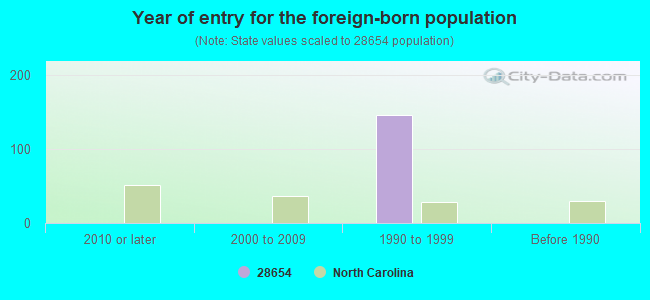
Foreign born population: 149 (4.7%) (69.2% of them are naturalized citizens)
This zip code:
4.7%
Whole state:
8.6%
64%Japan
29%Honduras
44%American
15%English
8%German
2%Scottish
2%French Canadian
1%Irish
1%Swiss
Year of entry for the foreign-born population
02010 or later
02000 to 2009
1461990 to 1999
0Before 1990
Facilities with environmental interests located in this zip code:
CENTRAL WILKES MIDDLE (3541 SOUTH NC HWY 16 in MORAVIAN FALLS, NC)
(National Center for Education Statistics) - STATE ID-315 Organizations: WILKES COUNTY SCHOOLS (SCHOOL DISTRICT)
BRUSHY MOUNTAIN BEE FARM INC (610 BETHANY CHURCH RD in MORAVIAN FALLS, NC)
COMPLIANCE ACTIVITY (Tracking inspections of insecticide, fungicide, and rodenticide, and toxic substances)
Housing units lacking complete plumbing facilities: 4.1% Housing units lacking complete kitchen facilities: 4.6%
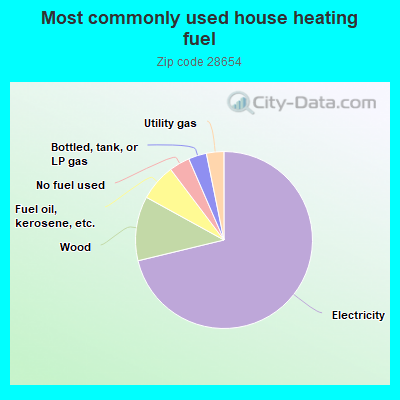
71.3%Electricity
11.8%Wood
6.7%Fuel oil, kerosene, etc.
3.8%No fuel used
3.3%Bottled, tank, or LP gas
3.2%Utility gas
Population in 1990: 3,071.
Place of birth for U.S.-born residents:
This state: 2,068
Northeast: 262
Midwest: 153
South: 425
West: 117
67% of the 28654 zip code residents lived in the same house 5 years ago. Out of people who lived in different houses, 56% lived in this county. Out of people who lived in different counties, 50% lived in North Carolina.
96% of the 28654 zip code residents lived in the same house 1 year ago. Out of people who lived in different houses, 54% moved from different county within same state. Out of people who lived in different houses, 54% moved from different state. Out of people who lived in different houses, 18% moved from abroad.
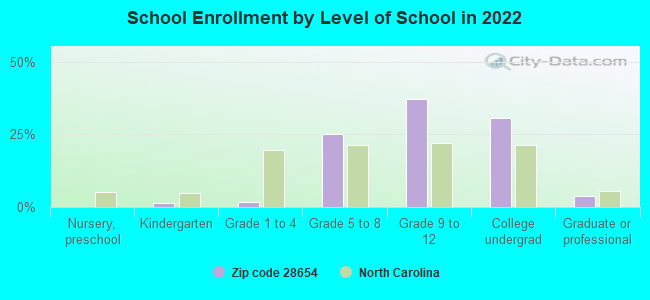
Private vs. public school enrollment:
Students in private schools in grades 1 to 8 (elementary and middle school): 7
Here:
6.6%
North Carolina:
13.8%
Students in private schools in grades 9 to 12 (high school): 10
Here:
6.2%
North Carolina:
11.9%
Students in private undergraduate colleges:
Here:
0.0%
North Carolina:
19.3%
Occupation by median earnings in the past 12 months ($)
90,068Health diagnosing and treating practitioners and other technical occupations
53,185Management occupations
47,612Business and financial operations occupations
40,034Production occupations
39,331Office and administrative support occupations
31,264Material moving occupations
Top industries in this zip code by the number of employees in 2005:
Construction: New Single-Family Housing Construction (except Operative Builders) (10-19: 1, 5-9: 2, 1-4: 2)
Other Services (except Public Administration): Religious Organizations (5-9: 1, 1-4: 5)
Other Services (except Public Administration): General Automotive Repair (10-19: 1)
Accommodation and Food Services: Full-Service Restaurants (10-19: 1)
Administrative and Support and Waste Management and Remediation Services: Janitorial Services (10-19: 1)
Professional, Scientific, and Technical Services: Human Resources and Executive Search Consulting Services (10-19: 1)
Administrative and Support and Waste Management and Remediation Services: Landscaping Services (5-9: 1, 1-4: 1)
People in group quarters in 2000:
6 people in other group homes
Fatal accident statistics in 2013:
Fatal accident count: 2
Vehicles involved in fatal accidents: 2
Fatal accidents caused by drunken drivers: 1
Fatalities: 2
Persons involved in fatal accidents: 4
Pedestrians involved in fatal accidents: 0
Fatal accident statistics in 2011:
Fatal accident count: 1
Vehicles involved in fatal accidents: 1
Fatal accidents caused by drunken drivers: 0
Fatalities: 1
Persons involved in fatal accidents: 3
Pedestrians involved in fatal accidents: 0
2005 - 2018 National Fire Incident Reporting System (NFIRS) incidents
According to the data from the years 2005 - 2018 the average number of fire incidents per year is 19. The highest number of reported fire incidents - 32 took place in 2012, and the least - 3 in 2006. The data has a growing trend.
When looking into fire subcategories, the most reports belonged to: Structure Fires (62.0%), and Outside Fires (24.4%).
Fire incident types reported to NFIRS in Zip Code 28654


 Nearest zip codes: 28697, 28681, 28636, 28659, 28606, 28689.


 According to the data from the years 2005 - 2018 the average number of fire incidents per year is 19. The highest number of reported fire incidents - 32 took place in 2012, and the least - 3 in 2006. The data has a growing trend.
 When looking into fire subcategories, the most reports belonged to: Structure Fires (62.0%), and Outside Fires (24.4%).