Estimated zip code population in 2022: 5,033 Zip code population in 2010: 5,522 Zip code population in 2000: 4,772
Houses and condos: 2,077 Renter-occupied apartments: 471
% of renters here:
24%
State:
33%
March 2022 cost of living index in zip code 28636: 79.2 (low, U.S. average is 100)
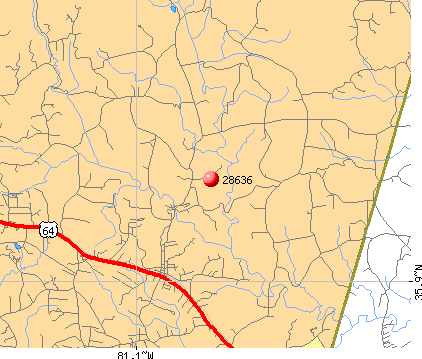
Land area: 59.5 sq. mi. Water area: 0.1 sq. mi.
Population density: 85 people per square mile
(very low).
OSM Map
General Map
Google Map
MSN Map
OSM Map
General Map
Google Map
MSN Map
OSM Map
General Map
Google Map
MSN Map
OSM Map
General Map
Google Map
MSN Map
Please wait while loading the map...
Real estate property taxes paid for housing units in 2022:
This zip code:
0.6% ($1,018)
North Carolina:
0.6% ($1,769)
Median real estate property taxes paid for housing units with mortgages in 2022: $1,075 (0.6%) Median real estate property taxes paid for housing units with no mortgage in 2022: $991 (0.5%)
Business Search- 14 Million verified businesses
Males: 2,615
(52.0%)
Females: 2,417
(48.0%)
For population 25 years and over in 28636:
High school or higher: 81.4%
Bachelor's degree or higher: 12.5%
Graduate or professional degree: 3.2%
Unemployed: 6.9%
Mean travel time to work (commute): 29.2 minutes
For population 15 years and over in 28636:
Never married: 27.9%
Now married: 54.2%
Separated: 2.2%
Widowed: 5.1%
Divorced: 10.6%
Zip code 28636 compared to state average:
Median house value below state average.
Unemployed percentage above state average.
Black race population percentage significantly below state average.
Hispanic race population percentage below state average.
Foreign-born population percentage significantly below state average.
Length of stay since moving in significantly above state average.
Number of college students significantly below state average.
Percentage of population with a bachelor's degree or higher significantly below state average.
Estimated median house/condo value in 2022: $177,391
28636:
$177,391
North Carolina:
$280,600
According to our research of North Carolina and other state lists, there were 10 registered sex offenders living in 28636 zip code as of May 28, 2024. The ratio of all residents to sex offenders in zip code 28636 is 509 to 1. The ratio of registered sex offenders to all residents in this zip code is near the state average.
Median resident age:
This zip code:
41.5 years
North Carolina median age:
39.2 years
Average household size:
This zip code:
2.6 people
North Carolina:
2.4 people
Averages for the 2020 tax year for zip code 28636, filed in 2021:
Average Adjusted Gross Income (AGI) in 2020: $46,758 (Individual Income Tax Returns)
Here:
$46,758
State:
$70,020
Salary/wage: $40,267 (reported on 85.3% of returns)
Here:
$40,267
State:
$58,387
(% of AGI for various income ranges: 1251.9% for AGIs below $25k, 3807.8% for AGIs $25k-50k, 6894.8% for AGIs $50k-75k, 10014.3% for AGIs $75k-100k, 15409.1% for AGIs $100k-200k)
Taxable interest for individuals: $841 (reported on 26.4% of returns)
This zip code:
$841
North Carolina:
$1,479
(% of AGI for various income ranges: 16.8% for AGIs below $25k, 19.6% for AGIs $25k-50k, 43.9% for AGIs $50k-75k, 79.3% for AGIs $75k-100k, 48.2% for AGIs $100k-200k)
Ordinary dividends: $2,447 (reported on 8.2% of returns)
Here:
$2,447
State:
$7,888
(% of AGI for various income ranges: 4.7% for AGIs below $25k, 23.1% for AGIs $25k-50k, 53.9% for AGIs $50k-75k, 24.3% for AGIs $75k-100k, 139.1% for AGIs $100k-200k)
Net capital gain/loss in AGI: +$15,418 (reported on 7.4% of returns)
Here:
+$15,418
State:
+$23,652
(% of AGI for various income ranges: 4.7% for AGIs below $25k, 5.2% for AGIs $25k-50k, 86.5% for AGIs $50k-75k, 317.9% for AGIs $75k-100k, 1745.5% for AGIs $100k-200k)
Profit/loss from business: +$11,656 (reported on 13.9% of returns)
Here:
+$11,656
State:
+$11,710
(% of AGI for various income ranges: 125.3% for AGIs below $25k, 143.3% for AGIs $25k-50k, 168.7% for AGIs $50k-75k, 479.3% for AGIs $75k-100k, 1018.2% for AGIs $100k-200k)
Taxable individual retirement arrangement distribution: $10,431 (reported on 6.9% of returns)
28636:
$10,431
North Carolina:
$20,247
(% of AGI for various income ranges: 67.1% for AGIs below $25k, 50.4% for AGIs $25k-50k, 242.6% for AGIs $50k-75k, 384.5% for AGIs $100k-200k)
Total itemized deductions: $29,357 (reported on 3.0% of returns)
Here:
$29,357
State:
$34,549
(% of AGI for various income ranges: 311.7% for AGIs $50k-75k, 1216.4% for AGIs $100k-200k)
Charity contributions: $16,133 (reported on 2.6% of returns)
Here:
$16,133
State:
$13,360
(% of AGI for various income ranges: 82.6% for AGIs $50k-75k, 707.3% for AGIs $100k-200k)
Taxes paid: $6,043 (reported on 3.0% of returns)
28636:
$6,043
State:
$7,586
(% of AGI for various income ranges: 49.6% for AGIs $50k-75k, 280.9% for AGIs $100k-200k)
Earned income credit: $2,264 (reported on 19.0% of returns)
Here:
$2,264
State:
$2,337
(% of AGI for various income ranges: 93.5% for AGIs below $25k, 77.0% for AGIs $25k-50k)
Percentage of individuals using paid preparers for their 2020 taxes: 96.1%
Here:
96%
State:
93%
(% for various income ranges: 96.5% for AGIs below $25k, 95.7% for AGIs $25k-50k, 97.0% for AGIs $50k-75k, 95.2% for AGIs $75k-100k, 94.4% for AGIs $100k-200k, 100.0% for AGIs over 200k)
Averages for the 2012 tax year for zip code 28636, filed in 2013:
Average Adjusted Gross Income (AGI) in 2012: $36,565 (Individual Income Tax Returns)
Here:
$36,565
State:
$54,937
Salary/wage: $33,276 (reported on 86.4% of returns)
Here:
$33,276
State:
$46,336
(% of AGI for various income ranges: 80.0% for AGIs below $25k, 85.5% for AGIs $25k-50k, 82.6% for AGIs $50k-75k, 74.8% for AGIs $75k-100k, 62.8% for AGIs $100k-200k)
Taxable interest for individuals: $697 (reported on 31.8% of returns)
This zip code:
$697
North Carolina:
$1,298
(% of AGI for various income ranges: 1.2% for AGIs below $25k, 0.5% for AGIs $25k-50k, 0.4% for AGIs $50k-75k, 0.6% for AGIs $75k-100k, 0.5% for AGIs $100k-200k)
Ordinary dividends: $1,790 (reported on 9.8% of returns)
Here:
$1,790
State:
$6,213
(% of AGI for various income ranges: 0.5% for AGIs below $25k, 0.5% for AGIs $25k-50k, 0.1% for AGIs $50k-75k, 0.2% for AGIs $75k-100k, 1.1% for AGIs $100k-200k)
Net capital gain/loss in AGI: +$2,360 (reported on 7.0% of returns)
Here:
+$2,360
State:
+$12,740
(% of AGI for various income ranges: 1.1% for AGIs $75k-100k, 2.0% for AGIs $100k-200k)
Profit/loss from business: +$7,787 (reported on 14.5% of returns)
Here:
+$7,787
State:
+$10,311
(% of AGI for various income ranges: 5.5% for AGIs below $25k, 2.6% for AGIs $25k-50k, 2.5% for AGIs $50k-75k, 5.5% for AGIs $75k-100k)
Taxable individual retirement arrangement distribution: $9,960 (reported on 9.3% of returns)
28636:
$9,960
North Carolina:
$15,575
(% of AGI for various income ranges: 3.1% for AGIs below $25k, 1.9% for AGIs $25k-50k, 2.2% for AGIs $50k-75k, 6.4% for AGIs $75k-100k)
Total itemized deductions: $17,218 (25% of AGI, reported on 21.0% of returns)
Here:
$17,218
State:
$23,438
Here:
24.9% of AGI
State:
21.5% of AGI
(% of AGI for various income ranges: 5.1% for AGIs below $25k, 7.5% for AGIs $25k-50k, 9.8% for AGIs $50k-75k, 15.3% for AGIs $75k-100k, 14.5% for AGIs $100k-200k)
Charity contributions: $4,703 (reported on 16.8% of returns)
Here:
$4,703
State:
$4,687
(% of AGI for various income ranges: 0.8% for AGIs below $25k, 1.4% for AGIs $25k-50k, 2.1% for AGIs $50k-75k, 3.6% for AGIs $75k-100k, 3.7% for AGIs $100k-200k)
Taxes paid: $4,931 (reported on 21.0% of returns)
28636:
$4,931
State:
$8,823
(% of AGI for various income ranges: 0.6% for AGIs below $25k, 1.5% for AGIs $25k-50k, 2.6% for AGIs $50k-75k, 4.7% for AGIs $75k-100k, 6.2% for AGIs $100k-200k)
Earned income credit: $2,241 (reported on 22.9% of returns)
Here:
$2,241
State:
$2,376
(% of AGI for various income ranges: 6.2% for AGIs below $25k, 1.3% for AGIs $25k-50k)
Percentage of individuals using paid preparers for their 2012 taxes: 65.9%
Here:
66%
State:
53%
(% for various income ranges: 61.6% for AGIs below $25k, 65.6% for AGIs $25k-50k, 75.9% for AGIs $50k-75k, 71.4% for AGIs $75k-100k, 75.0% for AGIs $100k-200k)
Averages for the 2004 tax year for zip code 28636, filed in 2005:
Average Adjusted Gross Income (AGI) in 2004: $32,692 (Individual Income Tax Returns)
Here:
$32,692
State:
$45,376
Salary/wage: $31,296 (reported on 89.6% of returns)
Here:
$31,296
State:
$39,442
(% of AGI for various income ranges: 109.3% for AGIs below $10k, 85.8% for AGIs $10k-25k, 88.4% for AGIs $25k-50k, 85.0% for AGIs $50k-75k, 84.2% for AGIs $75k-100k, 75.7% for AGIs over 100k)
Taxable interest for individuals: $1,040 (reported on 36.5% of returns)
This zip code:
$1,040
North Carolina:
$1,515
(% of AGI for various income ranges: 10.3% for AGIs below $10k, 1.2% for AGIs $10k-25k, 1.0% for AGIs $25k-50k, 0.9% for AGIs $50k-75k, 0.8% for AGIs $75k-100k, 1.0% for AGIs over 100k)
Taxable dividends: $1,493 (reported on 10.2% of returns)
Here:
$1,493
State:
$4,016
(% of AGI for various income ranges: 0.8% for AGIs below $10k, 0.1% for AGIs $10k-25k, 0.4% for AGIs $25k-50k, 0.7% for AGIs $50k-75k, 0.2% for AGIs $75k-100k, 0.9% for AGIs over 100k)
Net capital gain/loss: +$6,809 (reported on 8.3% of returns)
Here:
+$6,809
State:
+$11,152
(% of AGI for various income ranges: 0.3% for AGIs below $10k, 0.2% for AGIs $10k-25k, 0.2% for AGIs $25k-50k, 3.3% for AGIs $50k-75k, 1.8% for AGIs $75k-100k, 5.3% for AGIs over 100k)
Profit/loss from business: +$4,128 (reported on 13.9% of returns)
Here:
+$4,128
State:
+$9,490
(% of AGI for various income ranges: 1.9% for AGIs below $10k, 3.0% for AGIs $10k-25k, 3.1% for AGIs $25k-50k, 1.1% for AGIs $50k-75k, -0.8% for AGIs $75k-100k)
IRA payment deduction: $3,161 (reported on 1.4% of returns)
28636:
$3,161
North Carolina:
$2,967
Total itemized deductions: $14,281 (25% of AGI, reported on 23.4% of returns)
Here:
$14,281
State:
$19,464
Here:
25.1% of AGI
State:
22.7% of AGI
(% of AGI for various income ranges: 9.2% for AGIs below $10k, 5.4% for AGIs $10k-25k, 9.0% for AGIs $25k-50k, 11.4% for AGIs $50k-75k, 15.0% for AGIs $75k-100k, 13.7% for AGIs over 100k)
Charity contributions deductions: $3,738 (6% of AGI, reported on 19.4% of returns)
Here:
$3,738
State:
$4,035
Here:
6.3% of AGI
State:
4.5% of AGI
(% of AGI for various income ranges: 1.3% for AGIs $10k-25k, 1.5% for AGIs $25k-50k, 2.5% for AGIs $50k-75k, 3.3% for AGIs $75k-100k, 4.5% for AGIs over 100k)
Total tax: $3,428 (reported on 70.8% of returns)
28636:
$3,428
State:
$7,257
(% of AGI for various income ranges: 3.7% for AGIs below $10k, 3.8% for AGIs $10k-25k, 6.2% for AGIs $25k-50k, 8.2% for AGIs $50k-75k, 9.7% for AGIs $75k-100k, 13.9% for AGIs over 100k)
Earned income credit: $1,741 (reported on 20.7% of returns)
Here:
$1,741
State:
$1,851
Percentage of individuals using paid preparers for their 2004 taxes: 71.6%
Here:
72%
State:
62%
(% for various income ranges: 64.8% for AGIs below $10k, 72.0% for AGIs $10k-25k, 72.2% for AGIs $25k-50k, 75.6% for AGIs $50k-75k, 78.0% for AGIs $75k-100k, 74.5% for AGIs over 100k)
Household received Food Stamps/SNAP in the past 12 months: 151 Household did not receive Food Stamps/SNAP in the past 12 months: 1,766
Women who had a birth in the past 12 months: 47 (49 now married, 0 unmarried) Women who did not have a birth in the past 12 months: 1,229 (589 now married, 641 unmarried)
Housing units in zip code 28636 with a mortgage: 703 (56 second mortgage, 59 both second mortgage and home equity loan) Houses without a mortgage: 94
Median monthly owner costs for units with a mortgage: $1,137 Median monthly owner costs for units without a mortgage: $334
Residents with income below the poverty level in 2022:
This zip code:
17.7%
Whole state:
12.8%
Residents with income below 50% of the poverty level in 2022:
This zip code:
9.6%
Whole state:
6.8%
Median number of rooms in houses and condos:
Here:
5.9
State:
6.4
Median number of rooms in apartments:
Here:
5.2
State:
4.4
Notable locations in this zip code not listed on our city pages
Churches in zip code 28636 include: Hopewell Church (A), Liberty Church (B), Linneys Grove Church (C), Berea Church (D), Wayfound Church (E), Mount Nebo Church (F), Mount Wesley Church (G), Center Church (H), Zion Chapel (I). Display/hide their locations on the map
Streams, rivers, and creeks: Bull Branch (A), Big Branch (B), Beaverdam Creek (C), Wallace Creek (D), Rocky Face Branch (E), Outz Creek (F), Mill Creek (G), Greasy Creek (H). Display/hide their locations on the map
Tourist attractions (not listed on the city page) : Hiddenite Center Inc (Museums; 316 Hiddenite Church Road) (1), Hiddenite Center Inc - Educational Complex (Museums; 70 Hiddenite Church Road) (2). Display/hide their approximate locations on the map
In group quarters: 15 (-1 institutionalized population)
Size of family households: 530 2-persons, 426 3-persons, 220 4-persons, 89 5-persons, 2 6-persons, 124 7-or-more-persons
Size of nonfamily households: 517 1-person, 23 2-persons
602 married couples with children.
150 single-parent households (6 men, 144 women).
92.2% of residents of 28636 zip code speak English at home.
5.6% of residents speak Spanish at home (50% very well, 30% well, 12% not well, 8% not at all).
1.2% of residents speak other Indo-European language at home (68% very well, 32% not well).
0.7% of residents speak Asian or Pacific Island language at home (100% very well).
Foreign born population: 85 (1.7%) (19.4% of them are naturalized citizens)
This zip code:
1.7%
Whole state:
8.6%
91%Honduras
33%American
21%English
5%German
4%Irish
3%French
3%Scotch-Irish
2%Scottish
Year of entry for the foreign-born population
02010 or later
02000 to 2009
1491990 to 1999
15Before 1990
Facilities with environmental interests located in this zip code:
BOBS SPRAY SHOP (1112 SHARPE LANE in HIDDENITE, NC)
AIR MINOR (AIRS/AFS) STATE MASTER (North Carolina facility info) - AIR PROGRAM Small Quantity Generators, between 100 kg and 1000 kg of hazardous waste/month (Resource Conservation and Recovery Act (tracking hazardous waste)) - notification Business SIC classification: WOOD HOUSEHOLD FURNITURE, EXCEPT UPHOLSTERED Organizations: BOBBY LEVAN (CONTACT/OWNER)
BASSETT FURNITURE INDUSTRIES INC (1510 SHARPE ROAD in HIDDENITE, NC)
AIR MAJOR (AIRS/AFS) CRITERIA AND HAZARDOUS AIR POLLUTANT INVENTORY (Inventory of air pollution sources) HAZARDOUS WASTE BIENNIAL REPORTER (Resource Conservation and Recovery Act (tracking hazardous waste)) Small Quantity Generators, between 100 kg and 1000 kg of hazardous waste/month (Resource Conservation and Recovery Act (tracking hazardous waste)) TRI REPORTER (Tracking of toxic chemicals releasing facilities) Business SIC classification: WOOD HOUSEHOLD FURNITURE, UPHOLSTERED Business NAICS classification: UPHOLSTERED HOUSEHOLD FURNITURE MANUFACTURING.; NONUPHOLSTERED WOOD HOUSEHOLD FURNITURE MANUFACTURING. Organizations: THE MITCHELL GOLD CO (CONTACT/OPERATOR)
, BASSETT FURN INC OF NC (CONTACT/OWNER)
Alternative names: BASSE!! @URN'UPHO"!DIV'PLT #9, BASSETT FURN TEST PLANT, BASSETT FURNITURE INDUSTRIES OF NC INC, BASSETT UPHOLSTERY PLANT 39
BASSETT FURNITURE INDUSTRIES (SHARPE RD in HIDDENITE, NC)
National Pollutant Discharge Elimination System NON-MAJOR (Tracking pollutant discharge elimination systems) - permit Small Quantity Generators, between 100 kg and 1000 kg of hazardous waste/month (Resource Conservation and Recovery Act (tracking hazardous waste)) - notification Business SIC classification: WOOD HOUSEHOLD FURNITURE, UPHOLSTERED Organizations: CRAFTMASTER FURNITURE CORPORATION (CONTACT/OWNER)
Alternative names: CRAFTMASTER FURNITURE CORP
AMERICAN ROLLER BEARING & MANUFACTURING INC (INTER. SR 1006 & SR 1632 in HIDDENITE, NC)
Small Quantity Generators, between 100 kg and 1000 kg of hazardous waste/month (Resource Conservation and Recovery Act (tracking hazardous waste)) - notification TRI REPORTER (Tracking of toxic chemicals releasing facilities) Business SIC classification: BALL AND ROLLER BEARINGS Organizations: AMERICAN ROLLER BEARING & MFG. CO. (CONTACT/OWNER)
Alternative names: AMERICAN ROLLER BEARING & MFG. INC.
Housing units lacking complete plumbing facilities: 4.0% Housing units lacking complete kitchen facilities: 1.3%
73.5%Electricity
10.3%Wood
6.5%Utility gas
4.9%Fuel oil, kerosene, etc.
4.7%Bottled, tank, or LP gas
Population in 1990: 1,703. Population change in the 1990s: +3,069 (+180.2%).
Place of birth for U.S.-born residents:
This state: 3,440
Northeast: 421
Midwest: 252
South: 558
West: 136
65% of the 28636 zip code residents lived in the same house 5 years ago. Out of people who lived in different houses, 65% lived in this county. Out of people who lived in different counties, 50% lived in North Carolina.
94% of the 28636 zip code residents lived in the same house 1 year ago. Out of people who lived in different houses, 52% moved from this county. Out of people who lived in different houses, 25% moved from different county within same state. Out of people who lived in different houses, 29% moved from different state.
Private vs. public school enrollment:
Students in private schools in grades 1 to 8 (elementary and middle school): 148
Here:
39.8%
North Carolina:
13.8%
Students in private schools in grades 9 to 12 (high school): 10
Here:
5.1%
North Carolina:
11.9%
Students in private undergraduate colleges: 4
Here:
15.2%
North Carolina:
19.3%
Occupation by median earnings in the past 12 months ($)
78,885Health diagnosing and treating practitioners and other technical occupations
65,748Transportation occupations
54,760Management occupations
48,360Sales and related occupations
42,018Office and administrative support occupations
39,943Life, physical, and social science occupations
Top industries in this zip code by the number of employees in 2005:
Administrative and Support and Waste Management and Remediation Services: Packaging and Labeling Services (20-49 employees: 1 establishment)
Other Services (except Public Administration): Religious Organizations (5-9: 3, 1-4: 4)
Fatal accident statistics in 2014:
Fatal accident count: 1
Vehicles involved in fatal accidents: 2
Fatal accidents caused by drunken drivers: 0
Fatalities: 1
Persons involved in fatal accidents: 2
Pedestrians involved in fatal accidents: 0
Fatal accident statistics in 2013:
Fatal accident count: 2
Vehicles involved in fatal accidents: 3
Fatal accidents caused by drunken drivers: 0
Fatalities: 2
Persons involved in fatal accidents: 2
Pedestrians involved in fatal accidents: 0
Home Mortgage Disclosure Act Aggregated Statistics For Year 2009 (Based on 4 partial tracts)
A) FHA, FSA/RHS & VA Home Purchase Loans
B) Conventional Home Purchase Loans
C) Refinancings
D) Home Improvement Loans
F) Non-occupant Loans on < 5 Family Dwellings (A B C & D)
G) Loans On Manufactured Home Dwelling (A B C & D)
Number
Average Value
Number
Average Value
Number
Average Value
Number
Average Value
Number
Average Value
Number
Average Value
LOANS ORIGINATED
17
$98,680
12
$114,686
102
$140,632
3
$78,913
4
$109,698
16
$70,661
APPLICATIONS APPROVED, NOT ACCEPTED
1
$53,780
1
$91,230
10
$115,354
0
$0
0
$0
1
$64,000
APPLICATIONS DENIED
5
$78,972
2
$113,630
48
$110,132
3
$46,150
0
$0
6
$71,460
APPLICATIONS WITHDRAWN
3
$150,457
1
$122,540
27
$140,087
1
$40,170
1
$40,850
5
$74,548
FILES CLOSED FOR INCOMPLETENESS
1
$170,200
1
$10,890
7
$116,920
2
$123,040
0
$0
5
$105,304
Aggregated Statistics For Year 2008 (Based on 4 partial tracts)
A) FHA, FSA/RHS & VA Home Purchase Loans
B) Conventional Home Purchase Loans
C) Refinancings
D) Home Improvement Loans
F) Non-occupant Loans on < 5 Family Dwellings (A B C & D)
G) Loans On Manufactured Home Dwelling (A B C & D)
Number
Average Value
Number
Average Value
Number
Average Value
Number
Average Value
Number
Average Value
Number
Average Value
LOANS ORIGINATED
28
$87,776
26
$145,047
94
$123,599
11
$66,881
10
$94,951
33
$73,693
APPLICATIONS APPROVED, NOT ACCEPTED
1
$156,810
6
$110,575
15
$91,810
1
$47,660
1
$81,700
9
$77,892
APPLICATIONS DENIED
7
$80,736
8
$64,957
73
$105,036
10
$23,817
3
$45,880
22
$65,282
APPLICATIONS WITHDRAWN
5
$100,760
3
$128,670
27
$120,336
1
$49,020
1
$83,740
5
$114,214
FILES CLOSED FOR INCOMPLETENESS
3
$82,843
1
$132,760
5
$151,408
0
$0
0
$0
2
$165,035
Aggregated Statistics For Year 2007 (Based on 4 partial tracts)
A) FHA, FSA/RHS & VA Home Purchase Loans
B) Conventional Home Purchase Loans
C) Refinancings
D) Home Improvement Loans
F) Non-occupant Loans on < 5 Family Dwellings (A B C & D)
G) Loans On Manufactured Home Dwelling (A B C & D)
Number
Average Value
Number
Average Value
Number
Average Value
Number
Average Value
Number
Average Value
Number
Average Value
LOANS ORIGINATED
21
$87,224
50
$116,319
102
$103,733
8
$62,614
11
$90,345
48
$62,185
APPLICATIONS APPROVED, NOT ACCEPTED
2
$92,410
1
$53,780
27
$109,868
3
$14,000
0
$0
9
$74,368
APPLICATIONS DENIED
3
$141,517
16
$116,014
90
$103,798
9
$54,480
3
$108,720
22
$75,596
APPLICATIONS WITHDRAWN
1
$164,070
3
$118,233
43
$118,705
2
$71,485
1
$89,600
11
$85,122
FILES CLOSED FOR INCOMPLETENESS
0
$0
0
$0
7
$92,134
0
$0
0
$0
0
$0
Aggregated Statistics For Year 2006 (Based on 4 partial tracts)
A) FHA, FSA/RHS & VA Home Purchase Loans
B) Conventional Home Purchase Loans
C) Refinancings
D) Home Improvement Loans
F) Non-occupant Loans on < 5 Family Dwellings (A B C & D)
G) Loans On Manufactured Home Dwelling (A B C & D)
Number
Average Value
Number
Average Value
Number
Average Value
Number
Average Value
Number
Average Value
Number
Average Value
LOANS ORIGINATED
12
$94,882
61
$98,606
101
$105,673
11
$47,509
14
$60,894
35
$59,870
APPLICATIONS APPROVED, NOT ACCEPTED
0
$0
19
$79,637
19
$67,206
4
$17,112
3
$44,840
18
$76,249
APPLICATIONS DENIED
5
$66,024
27
$76,449
94
$94,710
22
$55,338
4
$63,655
48
$70,952
APPLICATIONS WITHDRAWN
1
$42,890
5
$149,268
36
$103,000
1
$89,600
0
$0
6
$84,820
FILES CLOSED FOR INCOMPLETENESS
0
$0
0
$0
14
$123,529
1
$35,370
1
$71,480
0
$0
Aggregated Statistics For Year 2005 (Based on 4 partial tracts)
A) FHA, FSA/RHS & VA Home Purchase Loans
B) Conventional Home Purchase Loans
C) Refinancings
D) Home Improvement Loans
E) Loans on Dwellings For 5+ Families
F) Non-occupant Loans on < 5 Family Dwellings (A B C & D)
G) Loans On Manufactured Home Dwelling (A B C & D)
Number
Average Value
Number
Average Value
Number
Average Value
Number
Average Value
Number
Average Value
Number
Average Value
Number
Average Value
LOANS ORIGINATED
13
$101,106
70
$102,824
108
$95,670
9
$30,941
1
$142,970
14
$67,059
36
$58,100
APPLICATIONS APPROVED, NOT ACCEPTED
0
$0
16
$80,234
24
$92,621
3
$25,440
0
$0
1
$50,380
10
$75,517
APPLICATIONS DENIED
1
$61,950
37
$79,162
100
$92,366
12
$28,952
0
$0
1
$204,240
58
$79,805
APPLICATIONS WITHDRAWN
1
$121,440
16
$143,338
44
$101,767
1
$100,220
0
$0
2
$52,760
12
$75,636
FILES CLOSED FOR INCOMPLETENESS
0
$0
4
$43,598
3
$111,650
0
$0
0
$0
0
$0
0
$0
Aggregated Statistics For Year 2004 (Based on 4 partial tracts)
A) FHA, FSA/RHS & VA Home Purchase Loans
B) Conventional Home Purchase Loans
C) Refinancings
D) Home Improvement Loans
F) Non-occupant Loans on < 5 Family Dwellings (A B C & D)
G) Loans On Manufactured Home Dwelling (A B C & D)
Number
Average Value
Number
Average Value
Number
Average Value
Number
Average Value
Number
Average Value
Number
Average Value
LOANS ORIGINATED
7
$88,560
69
$77,546
130
$93,785
9
$33,609
13
$82,984
49
$55,886
APPLICATIONS APPROVED, NOT ACCEPTED
0
$0
10
$55,226
20
$84,358
1
$7,070
1
$6,130
9
$54,478
APPLICATIONS DENIED
5
$83,194
30
$65,748
114
$100,425
3
$12,627
4
$61,125
56
$73,727
APPLICATIONS WITHDRAWN
1
$42,210
15
$132,724
29
$98,889
3
$22,477
2
$39,145
9
$82,884
FILES CLOSED FOR INCOMPLETENESS
0
$0
0
$0
7
$111,749
1
$5,450
0
$0
2
$98,375
Aggregated Statistics For Year 2003 (Based on 4 partial tracts)
A) FHA, FSA/RHS & VA Home Purchase Loans
B) Conventional Home Purchase Loans
C) Refinancings
D) Home Improvement Loans
F) Non-occupant Loans on < 5 Family Dwellings (A B C & D)
Detailed PMIC statistics for the following Tracts:0401.00
, 0405.00
2004 - 2018 National Fire Incident Reporting System (NFIRS) incidents
According to the data from the years 2004 - 2018 the average number of fire incidents per year is 29. The highest number of fires - 46 took place in 2009, and the least - 8 in 2007. The data has a rising trend.
When looking into fire subcategories, the most reports belonged to: Structure Fires (46.2%), and Outside Fires (34.6%).
Fire incident types reported to NFIRS in Zip Code 28636

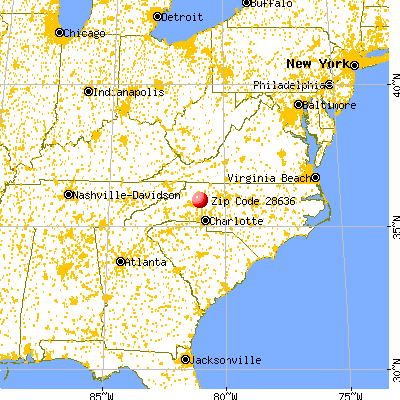


 Nearest zip codes: 28678, 28654, 28689, 28681, 28625, 28660.


 According to the data from the years 2004 - 2018 the average number of fire incidents per year is 29. The highest number of fires - 46 took place in 2009, and the least - 8 in 2007. The data has a rising trend.
 When looking into fire subcategories, the most reports belonged to: Structure Fires (46.2%), and Outside Fires (34.6%).