Estimated zip code population in 2022: 5,415 Zip code population in 2010: 5,226 Zip code population in 2000: 4,637
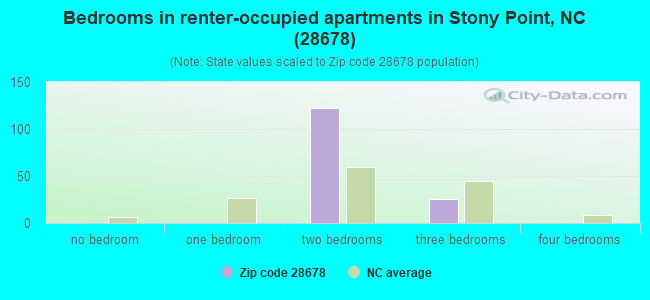
Houses and condos: 2,362 Renter-occupied apartments: 150
% of renters here:
7%
State:
33%
March 2022 cost of living index in zip code 28678: 80.1 (low, U.S. average is 100)
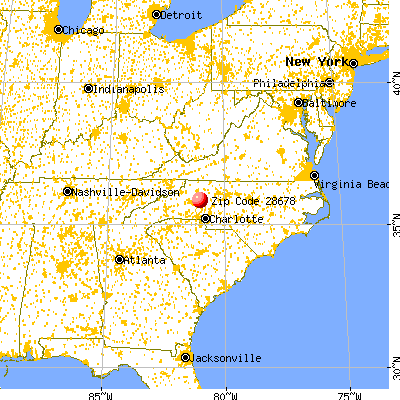
Land area: 44.7 sq. mi. Water area: 1.0 sq. mi.
Population density: 121 people per square mile
(very low).
OSM Map
General Map
Google Map
MSN Map
OSM Map
General Map
Google Map
MSN Map
OSM Map
General Map
Google Map
MSN Map
OSM Map
General Map
Google Map
MSN Map
Please wait while loading the map...
Real estate property taxes paid for housing units in 2022:
This zip code:
0.5% ($1,128)
North Carolina:
0.6% ($1,769)
Median real estate property taxes paid for housing units with mortgages in 2022: $1,065 (0.5%) Median real estate property taxes paid for housing units with no mortgage in 2022: $1,169 (0.4%)
Business Search- 14 Million verified businesses
Males: 2,877
(53.1%)
Females: 2,537
(46.9%)
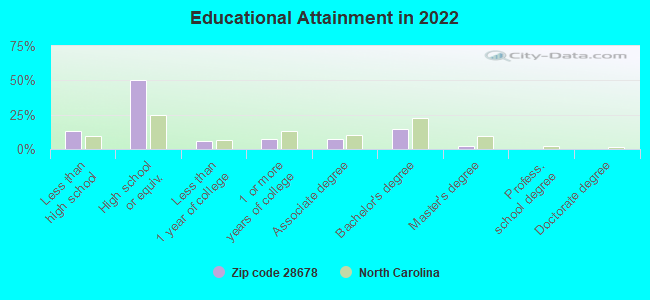
For population 25 years and over in 28678:
High school or higher: 85.7%
Bachelor's degree or higher: 16.8%
Graduate or professional degree: 2.4%
Unemployed: 1.5%
Mean travel time to work (commute): 24.6 minutes
For population 15 years and over in 28678:
Never married: 27.1%
Now married: 56.2%
Separated: 0.6%
Widowed: 7.7%
Divorced: 8.4%
Zip code 28678 compared to state average:
Unemployed percentage below state average.
Black race population percentage significantly below state average.
Median age above state average.
Foreign-born population percentage below state average.
Renting percentage significantly below state average.
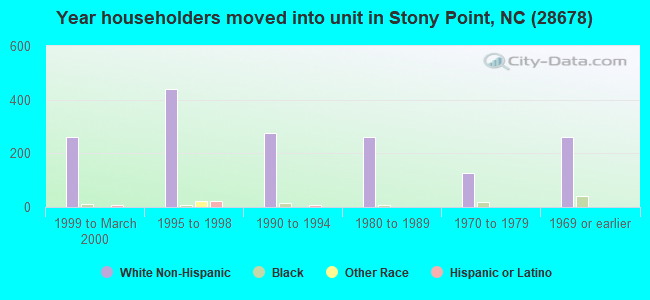
Length of stay since moving in below state average.
Percentage of population with a bachelor's degree or higher below state average.
Estimated median house/condo value in 2022: $231,026
28678:
$231,026
North Carolina:
$280,600
According to our research of North Carolina and other state lists, there were 13 registered sex offenders living in 28678 zip code as of May 28, 2024. The ratio of all residents to sex offenders in zip code 28678 is 408 to 1. The ratio of registered sex offenders to all residents in this zip code is near the state average.
Median resident age:
This zip code:
44.0 years
North Carolina median age:
39.2 years
Average household size:
This zip code:
2.5 people
North Carolina:
2.4 people
Averages for the 2020 tax year for zip code 28678, filed in 2021:
Average Adjusted Gross Income (AGI) in 2020: $49,270 (Individual Income Tax Returns)
Here:
$49,270
State:
$70,020
Salary/wage: $44,297 (reported on 84.4% of returns)
Here:
$44,297
State:
$58,387
(% of AGI for various income ranges: 1135.3% for AGIs below $25k, 3633.5% for AGIs $25k-50k, 6871.1% for AGIs $50k-75k, 9384.0% for AGIs $75k-100k, 16766.7% for AGIs $100k-200k)
Taxable interest for individuals: $780 (reported on 25.0% of returns)
This zip code:
$780
North Carolina:
$1,479
(% of AGI for various income ranges: 11.9% for AGIs below $25k, 12.7% for AGIs $25k-50k, 12.1% for AGIs $50k-75k, 45.3% for AGIs $75k-100k, 167.5% for AGIs $100k-200k)
Ordinary dividends: $2,533 (reported on 9.4% of returns)
Here:
$2,533
State:
$7,888
(% of AGI for various income ranges: 5.0% for AGIs below $25k, 14.3% for AGIs $25k-50k, 52.5% for AGIs $50k-75k, 15.3% for AGIs $75k-100k, 216.7% for AGIs $100k-200k)
Net capital gain/loss in AGI: +$9,880 (reported on 8.9% of returns)
Here:
+$9,880
State:
+$23,652
(% of AGI for various income ranges: 7.1% for AGIs below $25k, 21.2% for AGIs $25k-50k, 32.5% for AGIs $50k-75k, 128.7% for AGIs $75k-100k, 1285.8% for AGIs $100k-200k)
Profit/loss from business: +$10,494 (reported on 14.3% of returns)
Here:
+$10,494
State:
+$11,710
(% of AGI for various income ranges: 127.2% for AGIs below $25k, 164.3% for AGIs $25k-50k, 237.5% for AGIs $50k-75k, 418.0% for AGIs $75k-100k, 408.3% for AGIs $100k-200k)
Taxable individual retirement arrangement distribution: $13,726 (reported on 8.5% of returns)
28678:
$13,726
North Carolina:
$20,247
(% of AGI for various income ranges: 55.3% for AGIs below $25k, 93.5% for AGIs $25k-50k, 138.9% for AGIs $50k-75k, 374.7% for AGIs $75k-100k, 715.8% for AGIs $100k-200k)
Total itemized deductions: $34,486 (reported on 3.1% of returns)
Here:
$34,486
State:
$34,549
(% of AGI for various income ranges: 373.6% for AGIs $50k-75k, 1140.0% for AGIs $100k-200k)
Charity contributions: $10,650 (reported on 2.7% of returns)
Here:
$10,650
State:
$13,360
(% of AGI for various income ranges: 30.2% for AGIs $25k-50k, 404.2% for AGIs $100k-200k)
Taxes paid: $6,129 (reported on 3.1% of returns)
28678:
$6,129
State:
$7,586
(% of AGI for various income ranges: 59.6% for AGIs $50k-75k, 218.3% for AGIs $100k-200k)
Earned income credit: $2,110 (reported on 18.3% of returns)
Here:
$2,110
State:
$2,337
(% of AGI for various income ranges: 87.6% for AGIs below $25k, 70.0% for AGIs $25k-50k)
Percentage of individuals using paid preparers for their 2020 taxes: 95.1%
Here:
95%
State:
93%
(% for various income ranges: 94.9% for AGIs below $25k, 95.2% for AGIs $25k-50k, 97.4% for AGIs $50k-75k, 90.5% for AGIs $75k-100k, 95.0% for AGIs $100k-200k, 100.0% for AGIs over 200k)
Averages for the 2012 tax year for zip code 28678, filed in 2013:
Average Adjusted Gross Income (AGI) in 2012: $38,536 (Individual Income Tax Returns)
Here:
$38,536
State:
$54,937
Salary/wage: $35,804 (reported on 85.0% of returns)
Here:
$35,804
State:
$46,336
(% of AGI for various income ranges: 75.8% for AGIs below $25k, 83.4% for AGIs $25k-50k, 81.8% for AGIs $50k-75k, 78.0% for AGIs $75k-100k, 72.0% for AGIs $100k-200k)
Taxable interest for individuals: $475 (reported on 30.5% of returns)
This zip code:
$475
North Carolina:
$1,298
(% of AGI for various income ranges: 0.9% for AGIs below $25k, 0.3% for AGIs $25k-50k, 0.2% for AGIs $50k-75k, 0.3% for AGIs $75k-100k, 0.4% for AGIs $100k-200k)
Ordinary dividends: $1,668 (reported on 10.3% of returns)
Here:
$1,668
State:
$6,213
(% of AGI for various income ranges: 0.5% for AGIs below $25k, 0.3% for AGIs $25k-50k, 0.4% for AGIs $50k-75k, 0.3% for AGIs $75k-100k, 0.8% for AGIs $100k-200k)
Net capital gain/loss in AGI: +$819 (reported on 7.5% of returns)
Here:
+$819
State:
+$12,740
(% of AGI for various income ranges: 0.3% for AGIs $25k-50k, 0.1% for AGIs $50k-75k, 0.3% for AGIs $100k-200k)
Profit/loss from business: +$7,269 (reported on 16.9% of returns)
Here:
+$7,269
State:
+$10,311
(% of AGI for various income ranges: 6.3% for AGIs below $25k, 3.4% for AGIs $25k-50k, 2.3% for AGIs $50k-75k, 1.8% for AGIs $75k-100k, 2.8% for AGIs $100k-200k)
Taxable individual retirement arrangement distribution: $9,932 (reported on 10.3% of returns)
28678:
$9,932
North Carolina:
$15,575
(% of AGI for various income ranges: 3.9% for AGIs below $25k, 2.4% for AGIs $25k-50k, 2.7% for AGIs $50k-75k, 5.0% for AGIs $75k-100k)
Total itemized deductions: $17,740 (25% of AGI, reported on 24.4% of returns)
Here:
$17,740
State:
$23,438
Here:
24.8% of AGI
State:
21.5% of AGI
(% of AGI for various income ranges: 6.6% for AGIs below $25k, 7.9% for AGIs $25k-50k, 10.6% for AGIs $50k-75k, 15.0% for AGIs $75k-100k, 17.2% for AGIs $100k-200k)
Charity contributions: $3,809 (reported on 20.2% of returns)
Here:
$3,809
State:
$4,687
(% of AGI for various income ranges: 0.8% for AGIs below $25k, 1.4% for AGIs $25k-50k, 2.2% for AGIs $50k-75k, 2.6% for AGIs $75k-100k, 3.0% for AGIs $100k-200k)
Taxes paid: $5,406 (reported on 24.4% of returns)
28678:
$5,406
State:
$8,823
(% of AGI for various income ranges: 0.9% for AGIs below $25k, 1.8% for AGIs $25k-50k, 2.8% for AGIs $50k-75k, 4.7% for AGIs $75k-100k, 7.4% for AGIs $100k-200k)
Earned income credit: $2,200 (reported on 23.5% of returns)
Here:
$2,200
State:
$2,376
(% of AGI for various income ranges: 6.6% for AGIs below $25k, 1.5% for AGIs $25k-50k)
Percentage of individuals using paid preparers for their 2012 taxes: 60.1%
Here:
60%
State:
53%
(% for various income ranges: 57.1% for AGIs below $25k, 60.9% for AGIs $25k-50k, 64.5% for AGIs $50k-75k, 62.5% for AGIs $75k-100k, 63.6% for AGIs $100k-200k)
Averages for the 2004 tax year for zip code 28678, filed in 2005:
Average Adjusted Gross Income (AGI) in 2004: $33,787 (Individual Income Tax Returns)
Here:
$33,787
State:
$45,376
Salary/wage: $31,622 (reported on 89.5% of returns)
Here:
$31,622
State:
$39,442
(% of AGI for various income ranges: 97.2% for AGIs below $10k, 80.9% for AGIs $10k-25k, 88.9% for AGIs $25k-50k, 84.0% for AGIs $50k-75k, 86.7% for AGIs $75k-100k, 67.2% for AGIs over 100k)
Taxable interest for individuals: $811 (reported on 32.6% of returns)
This zip code:
$811
North Carolina:
$1,515
(% of AGI for various income ranges: 2.9% for AGIs below $10k, 1.2% for AGIs $10k-25k, 0.6% for AGIs $25k-50k, 0.6% for AGIs $50k-75k, 0.3% for AGIs $75k-100k, 1.5% for AGIs over 100k)
Taxable dividends: $1,227 (reported on 12.1% of returns)
Here:
$1,227
State:
$4,016
(% of AGI for various income ranges: 1.2% for AGIs below $10k, 0.5% for AGIs $10k-25k, 0.5% for AGIs $25k-50k, 0.2% for AGIs $50k-75k, 0.3% for AGIs $75k-100k, 0.8% for AGIs over 100k)
Net capital gain/loss: +$958 (reported on 7.7% of returns)
Here:
+$958
State:
+$11,152
(% of AGI for various income ranges: -1.3% for AGIs below $10k, 0.2% for AGIs $10k-25k, 0.5% for AGIs $25k-50k, 0.3% for AGIs $50k-75k, -0.2% for AGIs $75k-100k, 0.2% for AGIs over 100k)
Profit/loss from business: +$7,119 (reported on 15.7% of returns)
Here:
+$7,119
State:
+$9,490
(% of AGI for various income ranges: 9.0% for AGIs below $10k, 6.0% for AGIs $10k-25k, 2.8% for AGIs $25k-50k, 2.9% for AGIs $50k-75k, 3.7% for AGIs $75k-100k, -0.1% for AGIs over 100k)
IRA payment deduction: $3,000 (reported on 1.7% of returns)
28678:
$3,000
North Carolina:
$2,967
Total itemized deductions: $15,216 (26% of AGI, reported on 28.9% of returns)
Here:
$15,216
State:
$19,464
Here:
25.7% of AGI
State:
22.7% of AGI
(% of AGI for various income ranges: 10.2% for AGIs below $10k, 7.5% for AGIs $10k-25k, 11.2% for AGIs $25k-50k, 14.2% for AGIs $50k-75k, 18.1% for AGIs $75k-100k, 17.0% for AGIs over 100k)
Charity contributions deductions: $3,118 (5% of AGI, reported on 24.5% of returns)
Here:
$3,118
State:
$4,035
Here:
5.0% of AGI
State:
4.5% of AGI
(% of AGI for various income ranges: 0.8% for AGIs below $10k, 1.0% for AGIs $10k-25k, 1.6% for AGIs $25k-50k, 2.7% for AGIs $50k-75k, 3.7% for AGIs $75k-100k, 3.1% for AGIs over 100k)
Total tax: $3,753 (reported on 71.6% of returns)
28678:
$3,753
State:
$7,257
(% of AGI for various income ranges: 3.0% for AGIs below $10k, 3.9% for AGIs $10k-25k, 6.1% for AGIs $25k-50k, 8.3% for AGIs $50k-75k, 10.4% for AGIs $75k-100k, 15.6% for AGIs over 100k)
Earned income credit: $1,748 (reported on 19.9% of returns)
Here:
$1,748
State:
$1,851
Percentage of individuals using paid preparers for their 2004 taxes: 67.3%
Here:
67%
State:
62%
(% for various income ranges: 56.2% for AGIs below $10k, 70.7% for AGIs $10k-25k, 68.4% for AGIs $25k-50k, 70.8% for AGIs $50k-75k, 66.7% for AGIs $75k-100k, 78.0% for AGIs over 100k)
Churches in zip code 28678 include: Third Creek Church (A), Marvin Church (B), Midway Church (C), New Salem Church (D), New Sterling Church (E), Philadelphia Church (F), Pleasant Grove Church (G), Elk Shoals Church (H). Display/hide their locations on the map
Streams, rivers, and creeks: Elk Shoals Creek (A), Cullys Branch (B), Big Branch (C), Miller Creek (D), Harve Creek (E), Guys Branch (F). Display/hide their locations on the map
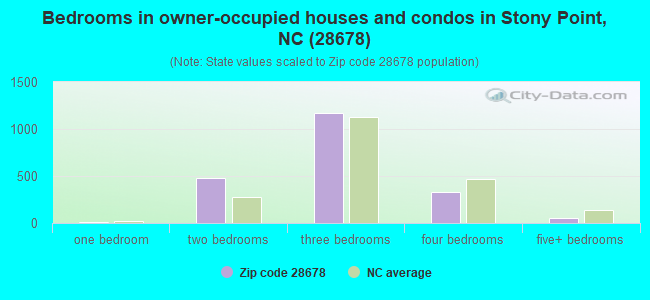
Size of family households: 677 2-persons, 403 3-persons, 228 4-persons, 74 5-persons, 117 6-persons, 16 7-or-more-persons
Size of nonfamily households: 519 1-person, 155 2-persons
745 married couples with children.
389 single-parent households (89 men, 300 women).
87.6% of residents of 28678 zip code speak English at home.
11.1% of residents speak Spanish at home (71% very well, 16% well, 7% not well, 6% not at all).
0.9% of residents speak other Indo-European language at home (100% very well).
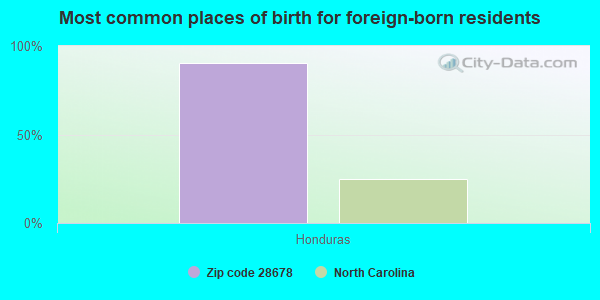
Foreign born population: 266 (4.9%) (0.0% of them are naturalized citizens)
:
4.9%
Whole state:
8.6%
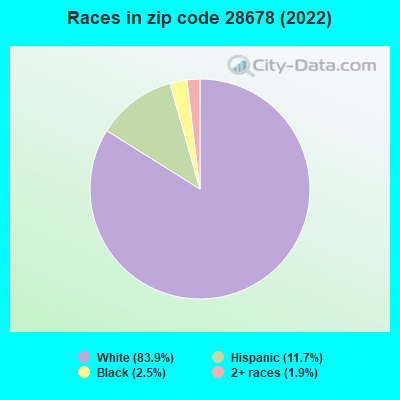
90%Honduras
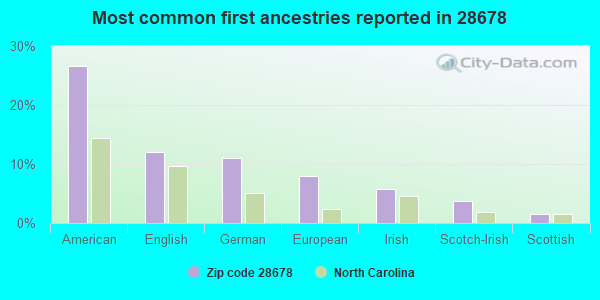
27%American
12%English
11%German
8%European
6%Irish
4%Scotch-Irish
2%Scottish
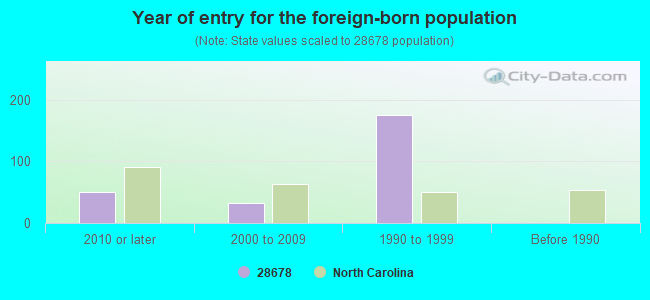
Year of entry for the foreign-born population
512010 or later
322000 to 2009
1751990 to 1999
0Before 1990
Facilities with environmental interests located in this zip code:
BESTWAY SOUTH INC (165 HALYBURTON RD in STONY POINT, NC)
STATE MASTER (North Carolina facility info) - -115DA4YG00M69W84AY3X867F13, WASTEWATER FACILITY National Pollutant Discharge Elimination System NON-MAJOR (Tracking pollutant discharge elimination systems) - permit Small Quantity Generators, between 100 kg and 1000 kg of hazardous waste/month (Resource Conservation and Recovery Act (tracking hazardous waste)) - notification - ICIS-, ENFORCEMENT/COMPLIANCE ACTIVITY USED OIL PROGRAM (Resource Conservation and Recovery Act (tracking hazardous waste)) - ICIS-, ENFORCEMENT/COMPLIANCE ACTIVITY TRI REPORTER (Tracking of toxic chemicals releasing facilities) Business SIC classification: WOOD PRESERVING Organizations: KARL OCHS (CONTACT/OWNER)
Alternative names: CAROLINA WOODWORKS, CAROLINA WOODWORKS TREATING
BESTWAY SOUTH, INC. (165 HAYLBURTON ROAD in STATESVILLE, NC)
ENFORCEMENT/COMPLIANCE ACTIVITY (Integrated Compliance Information System)
Housing units lacking complete plumbing facilities: 0.5% Housing units lacking complete kitchen facilities: 0.9%
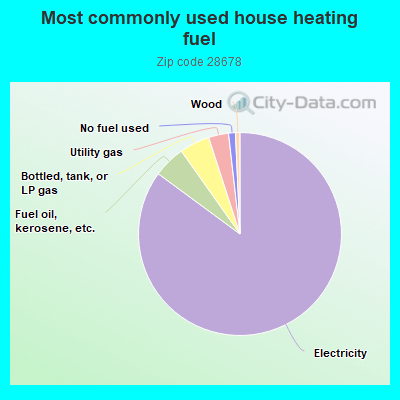
85.2%Electricity
5.1%Fuel oil, kerosene, etc.
4.8%Bottled, tank, or LP gas
3.2%Utility gas
1.1%No fuel used
0.7%Wood
Population in 1990: 5,212.
Place of birth for U.S.-born residents:
This state: 3,654
Northeast: 327
Midwest: 121
South: 885
West: 107
63% of the 28678 zip code residents lived in the same house 5 years ago. Out of people who lived in different houses, 54% lived in this county. Out of people who lived in different counties, 50% lived in North Carolina.
91% of the 28678 zip code residents lived in the same house 1 year ago. Out of people who lived in different houses, 70% moved from this county. Out of people who lived in different houses, 6% moved from different county within same state. Out of people who lived in different houses, 18% moved from different state.
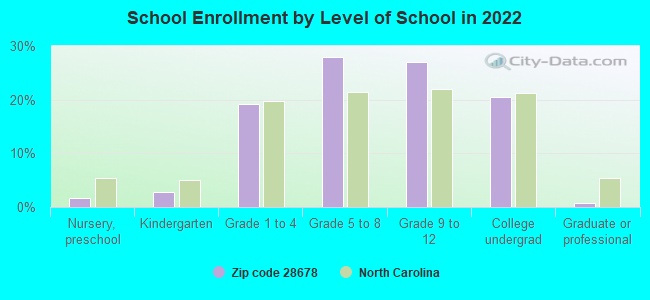
Private vs. public school enrollment:
Students in private schools in grades 1 to 8 (elementary and middle school): 225
Here:
37.1%
North Carolina:
13.8%
Students in private schools in grades 9 to 12 (high school): 125
Here:
35.7%
North Carolina:
11.9%
Students in private undergraduate colleges: 9
Here:
3.8%
North Carolina:
19.3%
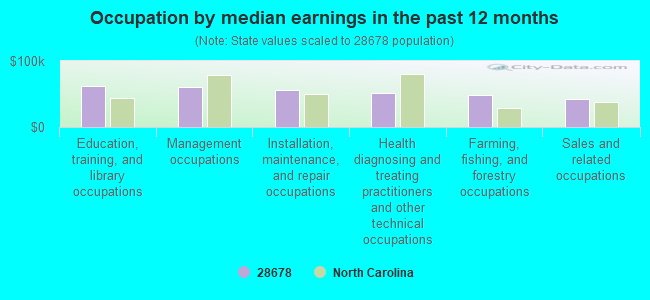
Occupation by median earnings in the past 12 months ($)
61,766Education, training, and library occupations
61,220Management occupations
55,834Installation, maintenance, and repair occupations
50,980Health diagnosing and treating practitioners and other technical occupations
47,743Farming, fishing, and forestry occupations
42,960Sales and related occupations
Top industries in this zip code by the number of employees in 2005:
Accommodation and Food Services: Full-Service Restaurants (20-49 employees: 2 establishments)
Other Services (except Public Administration): Religious Organizations (5-9: 5, 1-4: 4)
Health Care and Social Assistance: Child Day Care Services (20-49: 1, 5-9: 1)
Construction: Masonry Contractors (20-49: 1)
Construction: Plumbing, Heating, and Air-Conditioning Contractors (10-19: 1, 5-9: 1)
Professional, Scientific, and Technical Services: Veterinary Services (10-19: 1)
Construction: Poured Concrete Foundation and Structure Contractors (10-19: 1)
Fatal accident statistics in 2011:
Fatal accident count: 2
Vehicles involved in fatal accidents: 3
Fatal accidents caused by drunken drivers: 0
Fatalities: 2
Persons involved in fatal accidents: 3
Pedestrians involved in fatal accidents: 0
Home Mortgage Disclosure Act Aggregated Statistics For Year 2009 (Based on 4 partial tracts)
A) FHA, FSA/RHS & VA Home Purchase Loans
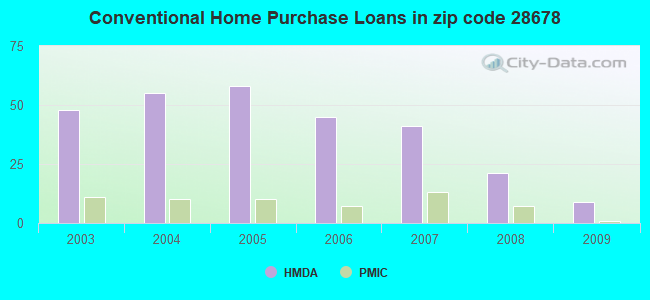
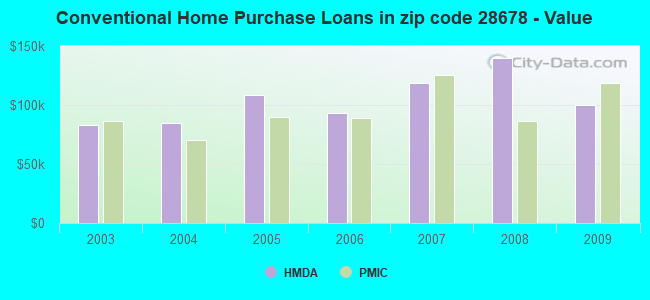
B) Conventional Home Purchase Loans
C) Refinancings
D) Home Improvement Loans
F) Non-occupant Loans on < 5 Family Dwellings (A B C & D)
G) Loans On Manufactured Home Dwelling (A B C & D)
Number
Average Value
Number
Average Value
Number
Average Value
Number
Average Value
Number
Average Value
Number
Average Value
LOANS ORIGINATED
14
$85,583
9
$100,177
70
$122,469
2
$32,815
3
$130,530
12
$71,548
APPLICATIONS APPROVED, NOT ACCEPTED
1
$74,500
1
$126,360
6
$115,547
0
$0
0
$0
1
$88,640
APPLICATIONS DENIED
7
$78,134
1
$124,030
33
$114,464
3
$52,797
0
$0
5
$62,822
APPLICATIONS WITHDRAWN
5
$125,042
1
$169,740
16
$140,656
2
$27,820
1
$56,580
4
$52,770
FILES CLOSED FOR INCOMPLETENESS
2
$117,875
1
$15,090
5
$98,920
1
$118,290
0
$0
4
$76,215
Aggregated Statistics For Year 2008 (Based on 4 partial tracts)
A) FHA, FSA/RHS & VA Home Purchase Loans
B) Conventional Home Purchase Loans
C) Refinancings
D) Home Improvement Loans
F) Non-occupant Loans on < 5 Family Dwellings (A B C & D)
G) Loans On Manufactured Home Dwelling (A B C & D)
Number
Average Value
Number
Average Value
Number
Average Value
Number
Average Value
Number
Average Value
Number
Average Value
LOANS ORIGINATED
19
$85,299
21
$140,192
72
$127,006
3
$30,753
10
$94,004
21
$75,469
APPLICATIONS APPROVED, NOT ACCEPTED
0
$0
3
$117,680
12
$110,476
1
$66,010
1
$113,160
4
$67,495
APPLICATIONS DENIED
7
$82,309
9
$53,836
49
$108,457
8
$12,226
2
$15,845
19
$60,275
APPLICATIONS WITHDRAWN
4
$92,988
5
$106,936
17
$116,702
1
$67,900
1
$115,990
4
$84,888
FILES CLOSED FOR INCOMPLETENESS
3
$87,193
2
$91,940
2
$109,400
0
$0
0
$0
1
$70,900
Aggregated Statistics For Year 2007 (Based on 4 partial tracts)
A) FHA, FSA/RHS & VA Home Purchase Loans
B) Conventional Home Purchase Loans
C) Refinancings
D) Home Improvement Loans
F) Non-occupant Loans on < 5 Family Dwellings (A B C & D)
G) Loans On Manufactured Home Dwelling (A B C & D)
Number
Average Value
Number
Average Value
Number
Average Value
Number
Average Value
Number
Average Value
Number
Average Value
LOANS ORIGINATED
21
$90,765
41
$118,397
68
$105,770
5
$78,040
11
$95,370
37
$65,985
APPLICATIONS APPROVED, NOT ACCEPTED
1
$122,460
1
$74,500
20
$134,706
1
$8,890
0
$0
5
$61,106
APPLICATIONS DENIED
1
$117,520
13
$87,235
68
$95,447
5
$43,632
2
$98,715
16
$72,442
APPLICATIONS WITHDRAWN
2
$113,630
5
$98,260
32
$119,352
3
$66,010
0
$0
8
$78,661
FILES CLOSED FOR INCOMPLETENESS
0
$0
0
$0
4
$83,042
0
$0
0
$0
0
$0
Aggregated Statistics For Year 2006 (Based on 4 partial tracts)
A) FHA, FSA/RHS & VA Home Purchase Loans
B) Conventional Home Purchase Loans
C) Refinancings
D) Home Improvement Loans
F) Non-occupant Loans on < 5 Family Dwellings (A B C & D)
G) Loans On Manufactured Home Dwelling (A B C & D)
Number
Average Value
Number
Average Value
Number
Average Value
Number
Average Value
Number
Average Value
Number
Average Value
LOANS ORIGINATED
11
$101,028
45
$92,838
91
$95,970
8
$50,941
12
$59,987
28
$59,831
APPLICATIONS APPROVED, NOT ACCEPTED
0
$0
15
$86,205
18
$79,361
2
$16,405
2
$53,420
14
$81,174
APPLICATIONS DENIED
5
$72,378
21
$75,436
82
$90,887
15
$36,645
6
$58,780
33
$68,862
APPLICATIONS WITHDRAWN
1
$59,410
6
$103,410
33
$93,594
0
$0
0
$0
5
$84,708
FILES CLOSED FOR INCOMPLETENESS
0
$0
0
$0
15
$113,173
0
$0
1
$99,020
0
$0
Aggregated Statistics For Year 2005 (Based on 4 partial tracts)
A) FHA, FSA/RHS & VA Home Purchase Loans
B) Conventional Home Purchase Loans
C) Refinancings
D) Home Improvement Loans
E) Loans on Dwellings For 5+ Families
F) Non-occupant Loans on < 5 Family Dwellings (A B C & D)
G) Loans On Manufactured Home Dwelling (A B C & D)
Number
Average Value
Number
Average Value
Number
Average Value
Number
Average Value
Number
Average Value
Number
Average Value
Number
Average Value
LOANS ORIGINATED
17
$97,556
58
$108,580
81
$84,409
8
$26,754
1
$198,030
14
$58,594
26
$63,616
APPLICATIONS APPROVED, NOT ACCEPTED
0
$0
15
$84,419
20
$92,351
1
$5,560
0
$0
2
$34,890
8
$67,960
APPLICATIONS DENIED
2
$42,905
33
$91,918
80
$89,263
10
$33,499
0
$0
2
$141,450
45
$83,586
APPLICATIONS WITHDRAWN
0
$0
14
$81,564
42
$99,718
0
$0
0
$0
3
$48,720
13
$74,452
FILES CLOSED FOR INCOMPLETENESS
0
$0
2
$61,960
4
$115,990
0
$0
0
$0
0
$0
0
$0
Aggregated Statistics For Year 2004 (Based on 4 partial tracts)
A) FHA, FSA/RHS & VA Home Purchase Loans
B) Conventional Home Purchase Loans
C) Refinancings
D) Home Improvement Loans
F) Non-occupant Loans on < 5 Family Dwellings (A B C & D)
G) Loans On Manufactured Home Dwelling (A B C & D)
Number
Average Value
Number
Average Value
Number
Average Value
Number
Average Value
Number
Average Value
Number
Average Value
LOANS ORIGINATED
7
$79,973
55
$84,577
97
$91,699
7
$35,554
7
$64,946
31
$57,233
APPLICATIONS APPROVED, NOT ACCEPTED
0
$0
8
$51,306
16
$93,897
0
$0
1
$8,490
6
$54,107
APPLICATIONS DENIED
7
$82,310
22
$60,671
81
$91,738
2
$10,335
2
$66,000
39
$68,906
APPLICATIONS WITHDRAWN
1
$58,470
7
$104,624
22
$103,602
3
$25,307
1
$43,270
4
$83,055
FILES CLOSED FOR INCOMPLETENESS
0
$0
0
$0
9
$120,390
1
$7,540
0
$0
3
$90,843
Aggregated Statistics For Year 2003 (Based on 4 partial tracts)
A) FHA, FSA/RHS & VA Home Purchase Loans
B) Conventional Home Purchase Loans
C) Refinancings
D) Home Improvement Loans
F) Non-occupant Loans on < 5 Family Dwellings (A B C & D)
Detailed PMIC statistics for the following Tracts:0401.00
, 0405.00
2002 - 2018 National Fire Incident Reporting System (NFIRS) incidents
According to the data from the years 2002 - 2018 the average number of fires per year is 26. The highest number of fires - 43 took place in 2015, and the least - 0 in 2003. The data has an increasing trend.
When looking into fire subcategories, the most reports belonged to: Outside Fires (40.0%), and Structure Fires (34.0%).
Fire incident types reported to NFIRS in Zip Code 28678


 Nearest zip codes: 28636, 28610, 28609, 28677, 28613, 28625.


 According to the data from the years 2002 - 2018 the average number of fires per year is 26. The highest number of fires - 43 took place in 2015, and the least - 0 in 2003. The data has an increasing trend.
 When looking into fire subcategories, the most reports belonged to: Outside Fires (40.0%), and Structure Fires (34.0%).