Estimated zip code population in 2022: 3,450 Zip code population in 2010: 3,749 Zip code population in 2000: 4,189
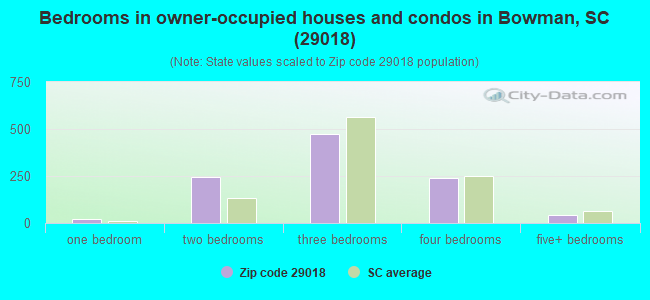
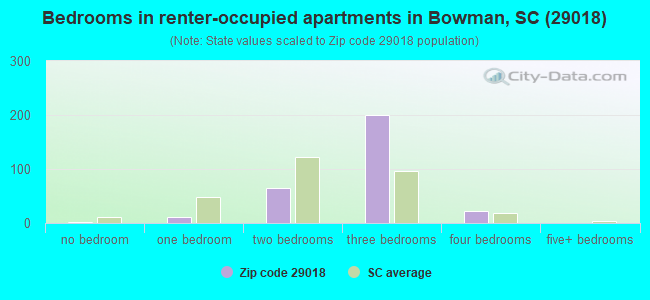
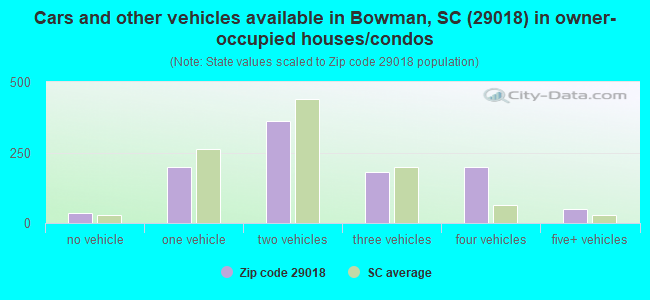
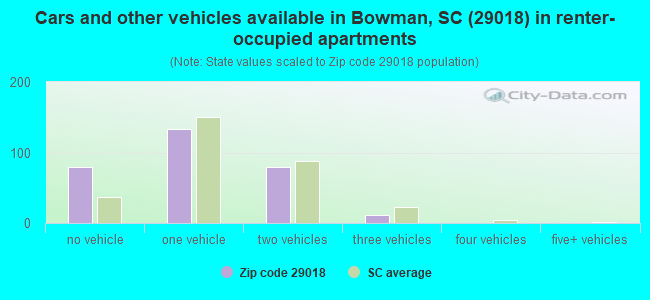
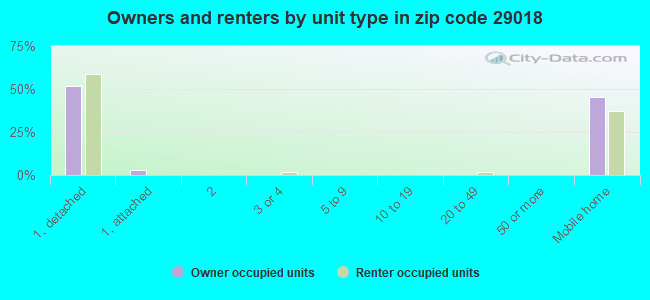
Houses and condos: 1,627 Renter-occupied apartments: 304
% of renters here:
23%
State:
28%
March 2022 cost of living index in zip code 29018: 80.2 (low, U.S. average is 100)
Land area: 109.6 sq. mi. Water area: 0.4 sq. mi.
Population density: 31 people per square mile
(very low).
OSM Map
General Map
Google Map
MSN Map
OSM Map
General Map
Google Map
MSN Map
OSM Map
General Map
Google Map
MSN Map
OSM Map
General Map
Google Map
MSN Map
Please wait while loading the map...
Real estate property taxes paid for housing units in 2022:
This zip code:
0.4% ($581)
South Carolina:
0.5% ($1,185)
Median real estate property taxes paid for housing units with mortgages in 2022: $1,243 (0.7%) Median real estate property taxes paid for housing units with no mortgage in 2022: $496 (0.5%)
Business Search- 14 Million verified businesses
Males: 1,473
(42.7%)
Females: 1,978
(57.3%)
For population 25 years and over in 29018:
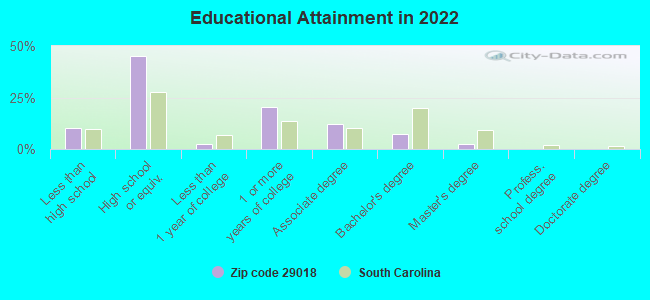
High school or higher: 87.4%
Bachelor's degree or higher: 9.4%
Graduate or professional degree: 2.4%
Unemployed: 9.5%
Mean travel time to work (commute): 30.3 minutes
For population 15 years and over in 29018:
Never married: 39.7%
Now married: 41.1%
Separated: 3.2%
Widowed: 7.0%
Divorced: 9.1%
Zip code 29018 compared to state average:
Median household income below state average.
Median house value below state average.
Unemployed percentage above state average.
Black race population percentage above state average.
Hispanic race population percentage below state average.
Foreign-born population percentage significantly below state average.
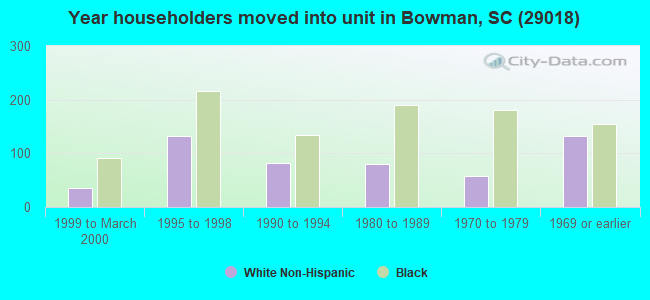
Length of stay since moving in significantly above state average.
Percentage of population with a bachelor's degree or higher significantly below state average.
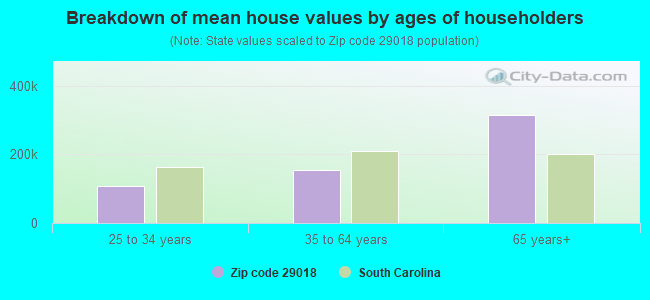
Estimated median house/condo value in 2022: $132,481
29018:
$132,481
South Carolina:
$254,600
According to our research of South Carolina and other state lists, there was 1 registered sex offender living in 29018 zip code as of May 28, 2024. The ratio of all residents to sex offenders in zip code 29018 is 3,155 to 1. The ratio of registered sex offenders to all residents in this zip code is lower than the state average.
Median resident age:
This zip code:
38.7 years
South Carolina median age:
40.5 years
Average household size:
This zip code:
2.6 people
South Carolina:
2.4 people
Averages for the 2020 tax year for zip code 29018, filed in 2021:
Average Adjusted Gross Income (AGI) in 2020: $39,397 (Individual Income Tax Returns)
Here:
$39,397
State:
$65,754
Salary/wage: $33,975 (reported on 83.3% of returns)
Here:
$33,975
State:
$52,566
(% of AGI for various income ranges: 1413.5% for AGIs below $25k, 4145.1% for AGIs $25k-50k, 7075.5% for AGIs $50k-75k, 11635.0% for AGIs $75k-100k, 22960.0% for AGIs $100k-200k)
Taxable interest for individuals: $588 (reported on 16.0% of returns)
This zip code:
$588
South Carolina:
$1,749
(% of AGI for various income ranges: 4.9% for AGIs below $25k, 8.1% for AGIs $25k-50k, 23.6% for AGIs $50k-75k, 25.0% for AGIs $75k-100k, 140.0% for AGIs $100k-200k)
Ordinary dividends: $3,675 (reported on 7.7% of returns)
Here:
$3,675
State:
$8,783
(% of AGI for various income ranges: 11.9% for AGIs $25k-50k, 141.8% for AGIs $50k-75k, 602.5% for AGIs $100k-200k)
Net capital gain/loss in AGI: +$19,630 (reported on 6.4% of returns)
Here:
+$19,630
State:
+$24,194
(% of AGI for various income ranges: 11.6% for AGIs below $25k, 115.5% for AGIs $50k-75k, 4442.5% for AGIs $100k-200k)
Profit/loss from business: +$1,971 (reported on 17.9% of returns)
Here:
+$1,971
State:
+$11,253
(% of AGI for various income ranges: 36.1% for AGIs below $25k, 49.2% for AGIs $25k-50k, 465.0% for AGIs $75k-100k)
Taxable individual retirement arrangement distribution: $13,689 (reported on 5.8% of returns)
29018:
$13,689
South Carolina:
$21,604
(% of AGI for various income ranges: 132.2% for AGIs $25k-50k, 1857.5% for AGIs $75k-100k)
Total itemized deductions: $29,871 (reported on 4.5% of returns)
Here:
$29,871
State:
$35,199
(% of AGI for various income ranges: 86.1% for AGIs below $25k, 466.4% for AGIs $50k-75k, 2847.5% for AGIs $100k-200k)
Charity contributions: $13,257 (reported on 4.5% of returns)
Here:
$13,257
State:
$14,319
(% of AGI for various income ranges: 71.6% for AGIs $25k-50k, 1657.5% for AGIs $100k-200k)
Taxes paid: $6,686 (reported on 4.5% of returns)
29018:
$6,686
State:
$7,486
(% of AGI for various income ranges: 18.0% for AGIs below $25k, 104.5% for AGIs $50k-75k, 652.5% for AGIs $100k-200k)
Earned income credit: $2,694 (reported on 32.7% of returns)
Here:
$2,694
State:
$2,397
(% of AGI for various income ranges: 189.8% for AGIs below $25k, 109.7% for AGIs $25k-50k)
Percentage of individuals using paid preparers for their 2020 taxes: 89.7%
Here:
90%
State:
93%
(% for various income ranges: 89.9% for AGIs below $25k, 90.4% for AGIs $25k-50k, 88.2% for AGIs $50k-75k, 87.5% for AGIs $75k-100k, 90.0% for AGIs $100k-200k)
Averages for the 2012 tax year for zip code 29018, filed in 2013:
Average Adjusted Gross Income (AGI) in 2012: $31,384 (Individual Income Tax Returns)
Here:
$31,384
State:
$51,133
Salary/wage: $27,090 (reported on 84.3% of returns)
Here:
$27,090
State:
$42,173
(% of AGI for various income ranges: 78.3% for AGIs below $25k, 83.4% for AGIs $25k-50k, 75.7% for AGIs $50k-75k, 64.6% for AGIs $75k-100k, 51.6% for AGIs $100k-200k)
Taxable interest for individuals: $608 (reported on 16.4% of returns)
This zip code:
$608
South Carolina:
$1,468
(% of AGI for various income ranges: 0.2% for AGIs below $25k, 0.2% for AGIs $25k-50k, 0.4% for AGIs $50k-75k, 0.9% for AGIs $75k-100k, 0.3% for AGIs $100k-200k)
Ordinary dividends: $3,817 (reported on 7.5% of returns)
Here:
$3,817
State:
$6,511
(% of AGI for various income ranges: 0.3% for AGIs $25k-50k, 2.0% for AGIs $50k-75k, 2.5% for AGIs $100k-200k)
Net capital gain/loss in AGI: +$10,412 (reported on 5.0% of returns)
Here:
+$10,412
State:
+$13,061
(% of AGI for various income ranges: 1.2% for AGIs $25k-50k, 3.9% for AGIs $50k-75k, 3.6% for AGIs $100k-200k)
Profit/loss from business: +$8,262 (reported on 13.2% of returns)
Here:
+$8,262
State:
+$10,167
(% of AGI for various income ranges: 6.0% for AGIs below $25k, 1.2% for AGIs $25k-50k, 16.1% for AGIs $75k-100k)
Taxable individual retirement arrangement distribution: $10,433 (reported on 5.7% of returns)
29018:
$10,433
South Carolina:
$17,019
(% of AGI for various income ranges: 0.9% for AGIs below $25k, 2.1% for AGIs $25k-50k, 10.4% for AGIs $75k-100k)
Total itemized deductions: $19,159 (27% of AGI, reported on 17.0% of returns)
Here:
$19,159
State:
$22,890
Here:
27.2% of AGI
State:
21.4% of AGI
(% of AGI for various income ranges: 4.6% for AGIs below $25k, 9.5% for AGIs $25k-50k, 10.9% for AGIs $50k-75k, 11.9% for AGIs $75k-100k, 17.7% for AGIs $100k-200k)
Charity contributions: $4,744 (reported on 15.7% of returns)
Here:
$4,744
State:
$5,169
(% of AGI for various income ranges: 0.8% for AGIs below $25k, 2.1% for AGIs $25k-50k, 2.8% for AGIs $50k-75k, 2.9% for AGIs $75k-100k, 4.2% for AGIs $100k-200k)
Taxes paid: $5,373 (reported on 16.4% of returns)
29018:
$5,373
State:
$7,644
(% of AGI for various income ranges: 0.7% for AGIs below $25k, 1.6% for AGIs $25k-50k, 3.1% for AGIs $50k-75k, 4.0% for AGIs $75k-100k, 6.5% for AGIs $100k-200k)
Earned income credit: $2,566 (reported on 40.3% of returns)
Here:
$2,566
State:
$2,418
(% of AGI for various income ranges: 11.3% for AGIs below $25k, 1.7% for AGIs $25k-50k)
Percentage of individuals using paid preparers for their 2012 taxes: 61.0%
Here:
61%
State:
57%
(% for various income ranges: 61.1% for AGIs below $25k, 58.1% for AGIs $25k-50k, 61.5% for AGIs $50k-75k, 66.7% for AGIs $75k-100k, 71.4% for AGIs $100k-200k)
Averages for the 2004 tax year for zip code 29018, filed in 2005:
Average Adjusted Gross Income (AGI) in 2004: $25,910 (Individual Income Tax Returns)
Here:
$25,910
State:
$41,965
Salary/wage: $23,448 (reported on 90.4% of returns)
Here:
$23,448
State:
$35,695
(% of AGI for various income ranges: 176.2% for AGIs below $10k, 89.1% for AGIs $10k-25k, 85.9% for AGIs $25k-50k, 70.9% for AGIs $50k-75k, 75.3% for AGIs $75k-100k, 53.2% for AGIs over 100k)
Taxable interest for individuals: $1,315 (reported on 20.7% of returns)
This zip code:
$1,315
South Carolina:
$1,623
(% of AGI for various income ranges: 2.5% for AGIs below $10k, 0.5% for AGIs $10k-25k, 0.9% for AGIs $25k-50k, 1.4% for AGIs $50k-75k, 2.2% for AGIs $75k-100k, 0.8% for AGIs over 100k)
Taxable dividends: $1,862 (reported on 10.3% of returns)
Here:
$1,862
State:
$3,999
(% of AGI for various income ranges: 2.1% for AGIs below $10k, 0.5% for AGIs $10k-25k, 0.5% for AGIs $25k-50k, 1.2% for AGIs $50k-75k, 0.8% for AGIs $75k-100k, 1.0% for AGIs over 100k)
Net capital gain/loss: +$6,678 (reported on 7.0% of returns)
Here:
+$6,678
State:
+$13,100
(% of AGI for various income ranges: 13.0% for AGIs below $10k, 0.5% for AGIs $10k-25k, 2.0% for AGIs $25k-50k, 1.1% for AGIs $50k-75k, 0.6% for AGIs $75k-100k, 3.9% for AGIs over 100k)
Profit/loss from business: +$257 (reported on 8.6% of returns)
Here:
+$257
State:
+$9,144
(% of AGI for various income ranges: -11.3% for AGIs below $10k, 0.1% for AGIs $10k-25k, -0.1% for AGIs $25k-50k, 3.3% for AGIs $50k-75k, -1.2% for AGIs $75k-100k)
IRA payment deduction: $3,379 (reported on 1.7% of returns)
29018:
$3,379
South Carolina:
$2,972
Total itemized deductions: $16,090 (27% of AGI, reported on 17.8% of returns)
Here:
$16,090
State:
$19,039
Here:
27.2% of AGI
State:
22.8% of AGI
(% of AGI for various income ranges: 4.6% for AGIs $10k-25k, 12.5% for AGIs $25k-50k, 14.3% for AGIs $50k-75k, 16.1% for AGIs $75k-100k, 15.1% for AGIs over 100k)
Charity contributions deductions: $4,197 (7% of AGI, reported on 16.6% of returns)
Here:
$4,197
State:
$4,305
Here:
7.0% of AGI
State:
5.0% of AGI
(% of AGI for various income ranges: 1.0% for AGIs $10k-25k, 2.6% for AGIs $25k-50k, 3.5% for AGIs $50k-75k, 3.9% for AGIs $75k-100k, 5.0% for AGIs over 100k)
Total tax: $3,337 (reported on 53.7% of returns)
29018:
$3,337
State:
$6,497
(% of AGI for various income ranges: 2.5% for AGIs below $10k, 2.0% for AGIs $10k-25k, 5.0% for AGIs $25k-50k, 9.1% for AGIs $50k-75k, 9.9% for AGIs $75k-100k, 18.1% for AGIs over 100k)
Earned income credit: $2,015 (reported on 44.2% of returns)
Here:
$2,015
State:
$1,882
Percentage of individuals using paid preparers for their 2004 taxes: 72.8%
Here:
73%
State:
66%
(% for various income ranges: 69.2% for AGIs below $10k, 77.4% for AGIs $10k-25k, 69.0% for AGIs $25k-50k, 71.8% for AGIs $50k-75k, 70.3% for AGIs $75k-100k, 75.0% for AGIs over 100k)
Household received Food Stamps/SNAP in the past 12 months: 208 Household did not receive Food Stamps/SNAP in the past 12 months: 1,126
Women who had a birth in the past 12 months: 11 (0 now married, 10 unmarried) Women who did not have a birth in the past 12 months: 883 (219 now married, 658 unmarried)
Housing units in zip code 29018 with a mortgage: 330 (40 second mortgage, 34 both second mortgage and home equity loan) Median monthly owner costs for units with a mortgage: $1,212 Median monthly owner costs for units without a mortgage: $418
Residents with income below the poverty level in 2022:
This zip code:
15.3%
Whole state:
14.0%
Residents with income below 50% of the poverty level in 2022:
This zip code:
6.3%
Whole state:
7.3%
Median number of rooms in houses and condos:
Here:
6.1
State:
6.4
Median number of rooms in apartments:
Here:
5.7
State:
4.5
Notable locations in this zip code not listed on our city pages
Notable locations in zip code 29018: Jaques Dairy (A), Orangeburg County Fire Department Bowman I - 26 (B), Bowman Fire Department Business (C), Orangeburg County Fire Department Bowman Substation (D), Orangeburg County Fire Department Bowman (E), Bowman Police Department (F). Display/hide their locations on the map
Churches in zip code 29018 include: Prospect Church (A), Saint Stephens Church (B), Pineville Church (C), Antioch Church (D), Shiloh Church (E), Mount Tabor Baptist Church (F), The Second Providence Church (G), Duncan Chapel (H), Bowman Southern Methodist Church (I). Display/hide their locations on the map
Cemeteries: Rigby Cemetery (1), Pineville Cemetery (2), New Mount Zion Cemetery (3), Mount Tabor Cemetery (4), Duncan Chapel Cemetery (5), Ebenezer Cemetery (6), Walnut Grove Cemetery (7). Display/hide their locations on the map
Size of family households: 501 2-persons, 173 3-persons, 95 4-persons, 55 5-persons, 33 6-persons, 26 7-or-more-persons
Size of nonfamily households: 417 1-person, 35 2-persons
336 married couples with children.
199 single-parent households (1 men, 198 women).
96.9% of residents of 29018 zip code speak English at home.
2.9% of residents speak Spanish at home (59% very well, 25% well, 16% not well).
0.1% of residents speak other language at home (100% very well).
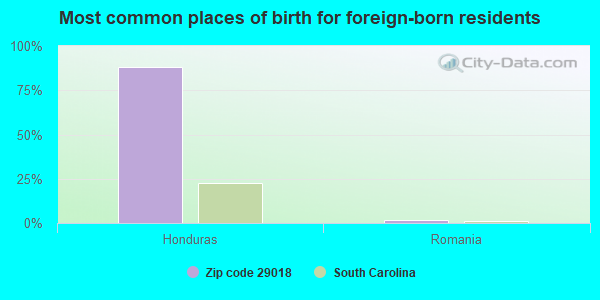
Foreign born population: 48 (1.4%) (4.5% of them are naturalized citizens)
This zip code:
1.4%
Whole state:
5.2%
88%Honduras
2%Romania
6%English
5%American
3%French
2%German
1%Scottish
1%Swedish
1%Irish
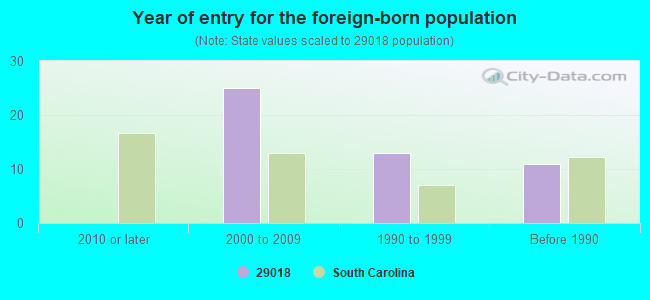
Year of entry for the foreign-born population
02010 or later
252000 to 2009
131990 to 1999
11Before 1990
Facilities with environmental interests located in this zip code:
BOWMAN WWTF (PO BOX 37 in BOWMAN, SC)
CRITERIA AND HAZARDOUS AIR POLLUTANT INVENTORY (Inventory of air pollution sources) National Pollutant Discharge Elimination System NON-MAJOR (Tracking pollutant discharge elimination systems) - permit STATE MASTER (South Carolina database) - National Pollutant Discharge Elimination System Permit Business SIC classification: SEWERAGE SYSTEMS Organizations: BOWMAN TOWN OF (CONTACT/OWNER)
Alternative names: TOWN OF BOWMAN
BOWMAN ELEMENTARY SCHOOL (BOX 158 in BOWMAN, SC)
(Geographic Names Information System) (National Center for Education Statistics) - STATE ID-3805012 Organizations: ORANGEBURG COUNTY SCHOOL DISTRICT 05 (SCHOOL DISTRICT)
BOWMAN HIGH (POST OFFICE BOX 186 in BOWMAN, SC)
(National Center for Education Statistics) - STATE ID-3805010 Organizations: ORANGEBURG COUNTY SCHOOL DISTRICT 05 (SCHOOL DISTRICT)
DBK METHOD (P.O. BOX 466 in BOWMAN, SC)
COMPLIANCE ACTIVITY (Tracking inspections of insecticide, fungicide, and rodenticide, and toxic substances)
DVK METHOD INC (CORNER OF PINE & OLIVER ST. in BOWMAN, SC)
COMPLIANCE ACTIVITY (Tracking inspections of insecticide, fungicide, and rodenticide, and toxic substances)
Housing units lacking complete plumbing facilities: 14.3% Housing units lacking complete kitchen facilities: 11.6%
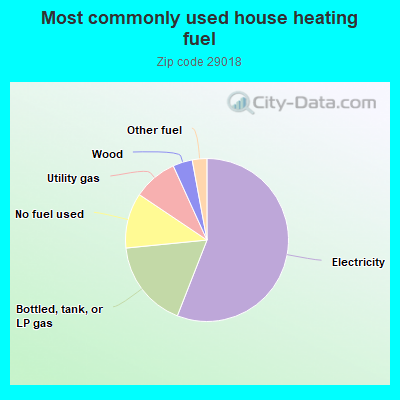
56.0%Electricity
17.5%Bottled, tank, or LP gas
11.0%No fuel used
8.8%Utility gas
3.9%Wood
2.9%Other fuel
Population in 1990: 3,993. Population change in the 1990s: +196 (+4.9%).
Place of birth for U.S.-born residents:
This state: 2,797
Northeast: 262
Midwest: 18
South: 240
West: 20
73% of the 29018 zip code residents lived in the same house 5 years ago. Out of people who lived in different houses, 67% lived in this county. Out of people who lived in different counties, 50% lived in South Carolina.
91% of the 29018 zip code residents lived in the same house 1 year ago. Out of people who lived in different houses, 48% moved from this county. Out of people who lived in different houses, 39% moved from different county within same state. Out of people who lived in different houses, 8% moved from different state.
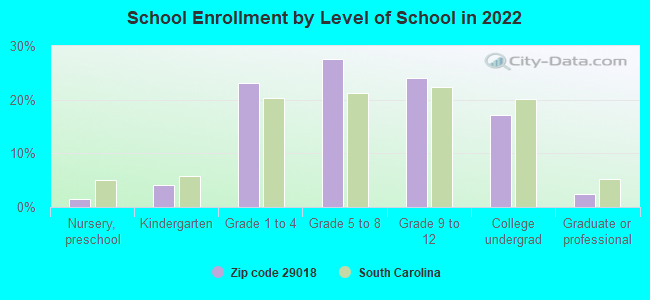
Private vs. public school enrollment:
Students in private schools in grades 1 to 8 (elementary and middle school): 50
Here:
11.7%
South Carolina:
14.4%
Students in private schools in grades 9 to 12 (high school): 106
Here:
50.9%
South Carolina:
11.1%
Students in private undergraduate colleges:
Here:
0.0%
South Carolina:
21.9%
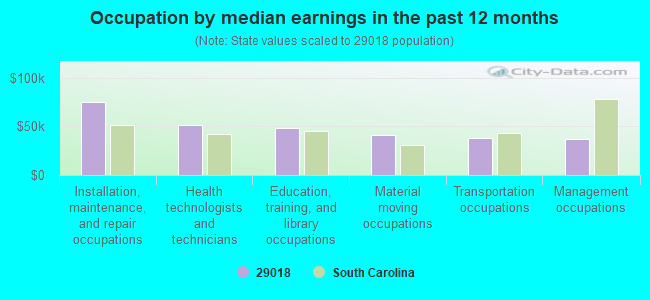
Occupation by median earnings in the past 12 months ($)
74,700Installation, maintenance, and repair occupations
51,402Health technologists and technicians
48,282Education, training, and library occupations
41,050Material moving occupations
38,602Transportation occupations
37,449Management occupations
Top industries in this zip code by the number of employees in 2005:
Accommodation and Food Services: Limited-Service Restaurants (50-99 employees: 1 establishment)
Health Care and Social Assistance: Homes for the Elderly (20-49: 1, 1-4: 1)
Health Care and Social Assistance: Ambulance Services (20-49: 1)
Wholesale Trade: Sporting and Recreational Goods and Supplies Merchant Wholesalers (20-49: 1)
People in group quarters in 2000:
7 people in other noninstitutional group quarters
2 people in other group homes
Fatal accident statistics in 2014:
Fatal accident count: 5
Vehicles involved in fatal accidents: 7
Fatal accidents caused by drunken drivers: 1
Fatalities: 9
Persons involved in fatal accidents: 15
Pedestrians involved in fatal accidents: 0
Fatal accident statistics in 2013:
Fatal accident count: 2
Vehicles involved in fatal accidents: 2
Fatal accidents caused by drunken drivers: 1
Fatalities: 2
Persons involved in fatal accidents: 2
Pedestrians involved in fatal accidents: 0
2003 - 2018 National Fire Incident Reporting System (NFIRS) incidents
According to the data from the years 2003 - 2018 the average number of fires per year is 75. The highest number of reported fire incidents - 161 took place in 2011, and the least - 28 in 2003. The data has an increasing trend.
When looking into fire subcategories, the most reports belonged to: Outside Fires (39.3%), and Structure Fires (30.9%).
Fire incident types reported to NFIRS in Zip Code 29018


 Nearest zip codes: 29471, 29142, 29133, 29047, 29477, 29432.


 According to the data from the years 2003 - 2018 the average number of fires per year is 75. The highest number of reported fire incidents - 161 took place in 2011, and the least - 28 in 2003. The data has an increasing trend.
 When looking into fire subcategories, the most reports belonged to: Outside Fires (39.3%), and Structure Fires (30.9%).