Estimated median house/condo value in 2022: $129,066
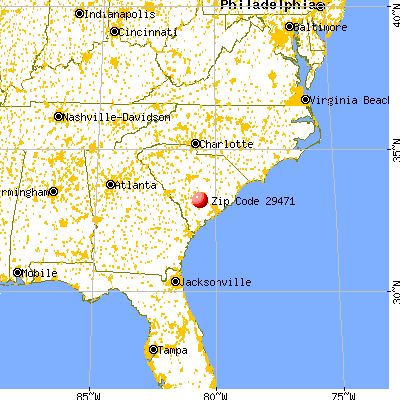
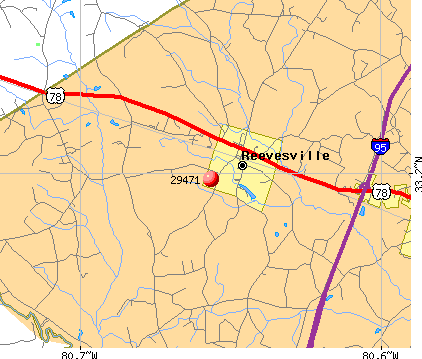
29471:
$129,066
South Carolina:
$254,600
According to our research of South Carolina and other state lists, there was 1 registered sex offender living in 29471 zip code as of May 28, 2024. The ratio of all residents to sex offenders in zip code 29471 is 1,493 to 1. The ratio of registered sex offenders to all residents in this zip code is near the state average.
Median resident age:
This zip code:
47.1 years
South Carolina median age:
40.5 years
Average household size:
This zip code:
2.1 people
South Carolina:
2.4 people
Averages for the 2020 tax year for zip code 29471, filed in 2021:
Average Adjusted Gross Income (AGI) in 2020: $47,100 (Individual Income Tax Returns)
Here:
$47,100
State:
$65,754
Salary/wage: $41,509 (reported on 82.9% of returns)
Here:
$41,509
State:
$52,566
(% of AGI for various income ranges: 1292.7% for AGIs below $25k, 3874.7% for AGIs $25k-50k, 6780.0% for AGIs $50k-75k, 14050.0% for AGIs $75k-100k, 17840.0% for AGIs $100k-200k)
Taxable interest for individuals: $823 (reported on 18.6% of returns)
This zip code:
$823
South Carolina:
$1,749
(% of AGI for various income ranges: 4.5% for AGIs below $25k, 12.7% for AGIs $25k-50k, 23.3% for AGIs $75k-100k, 177.5% for AGIs $100k-200k)
Ordinary dividends: $2,914 (reported on 10.0% of returns)
Here:
$2,914
State:
$8,783
(% of AGI for various income ranges: 53.3% for AGIs $25k-50k, 310.0% for AGIs $100k-200k)
Net capital gain/loss in AGI: +$9,814 (reported on 10.0% of returns)
Here:
+$9,814
State:
+$24,194
(% of AGI for various income ranges: 17.3% for AGIs $25k-50k, 1652.5% for AGIs $100k-200k)
Profit/loss from business: +$3,818 (reported on 15.7% of returns)
Here:
+$3,818
State:
+$11,253
(% of AGI for various income ranges: 75.9% for AGIs below $25k, 26.7% for AGIs $25k-50k, 710.0% for AGIs $75k-100k)
Taxable individual retirement arrangement distribution: $10,000 (reported on 8.6% of returns)
29471:
$10,000
South Carolina:
$21,604
(% of AGI for various income ranges: 93.2% for AGIs below $25k, 658.3% for AGIs $50k-75k)
Total itemized deductions: $29,533 (reported on 4.3% of returns)
Here:
$29,533
State:
$35,199
(% of AGI for various income ranges: 1476.7% for AGIs $50k-75k)
Charity contributions: $10,350 (reported on 2.9% of returns)
Here:
$10,350
State:
$14,319
(% of AGI for various income ranges: 138.0% for AGIs $25k-50k)
Taxes paid: $5,800 (reported on 4.3% of returns)
29471:
$5,800
State:
$7,486
(% of AGI for various income ranges: 290.0% for AGIs $50k-75k)
Earned income credit: $2,265 (reported on 24.3% of returns)
Here:
$2,265
State:
$2,397
(% of AGI for various income ranges: 120.0% for AGIs below $25k, 80.7% for AGIs $25k-50k)
Percentage of individuals using paid preparers for their 2020 taxes: 91.4%
Here:
91%
State:
93%
(% for various income ranges: 92.9% for AGIs below $25k, 90.0% for AGIs $25k-50k, 88.9% for AGIs $50k-75k, 83.3% for AGIs $75k-100k, 100.0% for AGIs $100k-200k)
Averages for the 2012 tax year for zip code 29471, filed in 2013:
Average Adjusted Gross Income (AGI) in 2012: $37,117 (Individual Income Tax Returns)
Here:
$37,117
State:
$51,133
Salary/wage: $32,796 (reported on 81.2% of returns)
Here:
$32,796
State:
$42,173
(% of AGI for various income ranges: 75.6% for AGIs below $25k, 75.0% for AGIs $25k-50k, 67.5% for AGIs $50k-75k, 74.0% for AGIs $75k-100k, 67.4% for AGIs $100k-200k)
Taxable interest for individuals: $1,067 (reported on 23.4% of returns)
This zip code:
$1,067
South Carolina:
$1,468
(% of AGI for various income ranges: 0.7% for AGIs below $25k, 0.4% for AGIs $25k-50k, 0.7% for AGIs $50k-75k, 0.7% for AGIs $75k-100k, 0.9% for AGIs $100k-200k)
Ordinary dividends: $4,888 (reported on 12.5% of returns)
Here:
$4,888
State:
$6,511
Net capital gain/loss in AGI: +$3,160 (reported on 7.8% of returns)
Here:
+$3,160
State:
+$13,061
Profit/loss from business: +$5,289 (reported on 14.1% of returns)
Here:
+$5,289
State:
+$10,167
Taxable individual retirement arrangement distribution: $6,500 (reported on 4.7% of returns)
29471:
$6,500
South Carolina:
$17,019
Total itemized deductions: $18,746 (26% of AGI, reported on 20.3% of returns)
Here:
$18,746
State:
$22,890
Here:
25.8% of AGI
State:
21.4% of AGI
(% of AGI for various income ranges: 12.0% for AGIs $25k-50k, 11.2% for AGIs $50k-75k, 11.4% for AGIs $75k-100k, 14.8% for AGIs $100k-200k)
Charity contributions: $5,027 (reported on 17.2% of returns)
Here:
$5,027
State:
$5,169
(% of AGI for various income ranges: 2.9% for AGIs $25k-50k, 5.3% for AGIs $50k-75k, 2.3% for AGIs $100k-200k)
Taxes paid: $5,062 (reported on 20.3% of returns)
29471:
$5,062
State:
$7,644
(% of AGI for various income ranges: 2.3% for AGIs $25k-50k, 2.7% for AGIs $50k-75k, 3.3% for AGIs $75k-100k, 5.4% for AGIs $100k-200k)
Earned income credit: $2,410 (reported on 31.2% of returns)
Here:
$2,410
State:
$2,418
(% of AGI for various income ranges: 9.7% for AGIs below $25k, 1.3% for AGIs $25k-50k)
Percentage of individuals using paid preparers for their 2012 taxes: 53.1%
Here:
53%
State:
57%
(% for various income ranges: 46.7% for AGIs below $25k, 50.0% for AGIs $25k-50k, 62.5% for AGIs $50k-75k, 75.0% for AGIs $75k-100k, 75.0% for AGIs $100k-200k)
Averages for the 2004 tax year for zip code 29471, filed in 2005:
Average Adjusted Gross Income (AGI) in 2004: $32,498 (Individual Income Tax Returns)
Here:
$32,498
State:
$41,965
Salary/wage: $27,515 (reported on 86.8% of returns)
Here:
$27,515
State:
$35,695
(% of AGI for various income ranges: 105.0% for AGIs below $10k, 82.8% for AGIs $10k-25k, 81.9% for AGIs $25k-50k, 78.6% for AGIs $50k-75k, 80.9% for AGIs $75k-100k, 36.1% for AGIs over 100k)
Taxable interest for individuals: $1,276 (reported on 29.0% of returns)
This zip code:
$1,276
South Carolina:
$1,623
(% of AGI for various income ranges: 2.2% for AGIs below $10k, 1.5% for AGIs $10k-25k, 1.0% for AGIs $25k-50k, 1.3% for AGIs $50k-75k, 0.1% for AGIs $75k-100k, 1.2% for AGIs over 100k)
Taxable dividends: $1,178 (reported on 13.3% of returns)
Here:
$1,178
State:
$3,999
(% of AGI for various income ranges: 0.4% for AGIs $10k-25k, 0.3% for AGIs $25k-50k, 0.8% for AGIs $50k-75k, 0.3% for AGIs $75k-100k, 0.7% for AGIs over 100k)
Net capital gain/loss: +$20,877 (reported on 8.4% of returns)
Here:
+$20,877
State:
+$13,100
Profit/loss from business: +$6,258 (reported on 9.8% of returns)
Here:
+$6,258
State:
+$9,144
Total itemized deductions: $15,937 (23% of AGI, reported on 21.2% of returns)
Here:
$15,937
State:
$19,039
Here:
22.5% of AGI
State:
22.8% of AGI
(% of AGI for various income ranges: 5.3% for AGIs $10k-25k, 8.5% for AGIs $25k-50k, 16.1% for AGIs $50k-75k, 12.2% for AGIs $75k-100k, 11.9% for AGIs over 100k)
Charity contributions deductions: $3,758 (5% of AGI, reported on 19.0% of returns)
Here:
$3,758
State:
$4,305
Here:
5.2% of AGI
State:
5.0% of AGI
(% of AGI for various income ranges: 0.9% for AGIs $10k-25k, 2.3% for AGIs $25k-50k, 3.9% for AGIs $50k-75k, 2.1% for AGIs $75k-100k, 1.7% for AGIs over 100k)
Total tax: $3,942 (reported on 64.0% of returns)
29471:
$3,942
State:
$6,497
(% of AGI for various income ranges: 1.4% for AGIs below $10k, 2.8% for AGIs $10k-25k, 6.2% for AGIs $25k-50k, 7.9% for AGIs $50k-75k, 10.9% for AGIs $75k-100k, 13.7% for AGIs over 100k)
Earned income credit: $2,084 (reported on 31.7% of returns)
Here:
$2,084
State:
$1,882
Percentage of individuals using paid preparers for their 2004 taxes: 63.9%
Here:
64%
State:
66%
(% for various income ranges: 51.7% for AGIs below $10k, 63.6% for AGIs $10k-25k, 70.1% for AGIs $25k-50k, 70.9% for AGIs $50k-75k, 56.2% for AGIs $75k-100k, 90.0% for AGIs over 100k)
Likely homosexual households (counted as self-reported same-sex unmarried-partner households)
Lesbian couples: 0.5% of all households
Gay men: 0.0% of all households
Household received Food Stamps/SNAP in the past 12 months: 120 Household did not receive Food Stamps/SNAP in the past 12 months: 399
Women who had a birth in the past 12 months: 48 (0 now married, 43 unmarried) Women who did not have a birth in the past 12 months: 129 (40 now married, 88 unmarried)
Housing units in zip code 29471 with a mortgage: 79 Median monthly owner costs for units with a mortgage: $1,532 Median monthly owner costs for units without a mortgage: $366
Residents with income below the poverty level in 2022:
This zip code:
40.9%
Whole state:
14.0%
Residents with income below 50% of the poverty level in 2022:
This zip code:
34.0%
Whole state:
7.3%
Median number of rooms in houses and condos:
Here:
6.0
State:
6.4
Median number of rooms in apartments:
Here:
5.8
State:
4.5
Notable locations in this zip code not listed on our city pages
Notable locations in zip code 29471: Cattle Creek Fire Department Station 1 (A), Reevesville Fire Department Number 1 (B). Display/hide their locations on the map
Churches in zip code 29471 include: Whitestone Church (A), Saint Matthews Church (B), Reevesville Baptist Church (C), Greenville Church (D), Bethel Church (E), Jericho Church (F). Display/hide their locations on the map
Cemeteries: Whitestone Cemetery (1), Magnolia Cemetery (2), Heaton Cemetery (3), Hagerman Cemetery (4), Bethel Cemetery (5). Display/hide their locations on the map
Size of family households: 179 2-persons, 29 3-persons, 89 4-persons, 5 5-persons, 5 6-persons, 2 7-or-more-persons
Size of nonfamily households: 202 1-person, 3 2-persons
68 married couples with children.
0 single-parent households ().
100.1% of residents of 29471 zip code speak English at home.
0.1% of residents speak Spanish at home (100% very well).
Foreign born population: 0 (0.0%)
:
0.0%
Whole state:
5.2%
21%English
8%American
3%Irish
2%German
0%European
0%Italian
0%Scottish
Year of entry for the foreign-born population
02010 or later
02000 to 2009
01990 to 1999
1Before 1990
Housing units lacking complete plumbing facilities: 6.7% Housing units lacking complete kitchen facilities: 1.6%
83.4%Electricity
13.7%Bottled, tank, or LP gas
2.9%Wood
Population in 1990: 1,342. Population change in the 1990s: +218 (+16.2%).
Place of birth for U.S.-born residents:
This state: 758
Northeast: 96
Midwest: 35
South: 153
West: 13
80% of the 29471 zip code residents lived in the same house 5 years ago. Out of people who lived in different houses, 57% lived in this county. Out of people who lived in different counties, 50% lived in South Carolina.
92% of the 29471 zip code residents lived in the same house 1 year ago. Out of people who lived in different houses, 61% moved from this county. Out of people who lived in different houses, 24% moved from different county within same state. Out of people who lived in different houses, 5% moved from different state.
Private vs. public school enrollment:
Students in private schools in grades 1 to 8 (elementary and middle school): 2
Here:
3.0%
South Carolina:
14.4%
Students in private schools in grades 9 to 12 (high school): 3
Here:
8.7%
South Carolina:
11.1%
Students in private undergraduate colleges: 1
Here:
66.6%
South Carolina:
21.9%
Occupation by median earnings in the past 12 months ($)
63,811Material moving occupations
38,407Management occupations
34,470Community and social service occupations
27,437Production occupations
21,438Health diagnosing and treating practitioners and other technical occupations
16,382Education, training, and library occupations
Top industries in this zip code by the number of employees in 2005:
Wholesale Trade: General Line Grocery Merchant Wholesalers (10-19 employees: 1 establishment)
Wholesale Trade: Recyclable Material Merchant Wholesalers (10-19: 1)
Construction: Electrical Contractors (10-19: 1)
Construction: Plumbing, Heating, and Air-Conditioning Contractors (1-4: 2)
Other Services (except Public Administration): Religious Organizations (1-4: 2)
Professional, Scientific, and Technical Services: Surveying and Mapping (except Geophysical) Services (1-4: 1)
Health Care and Social Assistance: All Other Outpatient Care Centers (1-4: 1)
Wholesale Trade: Other Grocery and Related Products Merchant Wholesalers (1-4: 1)
Fatal accident statistics in 2012:
Fatal accident count: 1
Vehicles involved in fatal accidents: 1
Fatal accidents caused by drunken drivers: 1
Fatalities: 1
Persons involved in fatal accidents: 1
Pedestrians involved in fatal accidents: 0
Home Mortgage Disclosure Act Aggregated Statistics For Year 2009 (Based on 2 partial tracts)
A) FHA, FSA/RHS & VA Home Purchase Loans
B) Conventional Home Purchase Loans
C) Refinancings
D) Home Improvement Loans
F) Non-occupant Loans on < 5 Family Dwellings (A B C & D)
G) Loans On Manufactured Home Dwelling (A B C & D)
Number
Average Value
Number
Average Value
Number
Average Value
Number
Average Value
Number
Average Value
Number
Average Value
LOANS ORIGINATED
2
$80,905
14
$83,778
31
$116,777
12
$30,657
6
$88,417
16
$35,219
APPLICATIONS APPROVED, NOT ACCEPTED
0
$0
2
$22,140
2
$76,075
2
$3,625
0
$0
2
$22,140
APPLICATIONS DENIED
1
$43,470
5
$56,188
13
$140,070
1
$4,030
0
$0
5
$77,442
APPLICATIONS WITHDRAWN
2
$97,405
1
$56,350
3
$143,023
0
$0
0
$0
2
$76,075
FILES CLOSED FOR INCOMPLETENESS
2
$83,320
0
$0
2
$111,495
0
$0
1
$120,750
0
$0
Aggregated Statistics For Year 2008 (Based on 2 partial tracts)
A) FHA, FSA/RHS & VA Home Purchase Loans
B) Conventional Home Purchase Loans
C) Refinancings
D) Home Improvement Loans
F) Non-occupant Loans on < 5 Family Dwellings (A B C & D)
G) Loans On Manufactured Home Dwelling (A B C & D)
Number
Average Value
Number
Average Value
Number
Average Value
Number
Average Value
Number
Average Value
Number
Average Value
LOANS ORIGINATED
6
$99,687
4
$66,010
28
$132,595
7
$5,750
2
$161,805
13
$64,276
APPLICATIONS APPROVED, NOT ACCEPTED
0
$0
2
$25,760
2
$98,210
0
$0
0
$0
2
$37,030
APPLICATIONS DENIED
2
$77,280
8
$109,581
10
$122,119
7
$26,220
1
$6,440
10
$78,327
APPLICATIONS WITHDRAWN
0
$0
0
$0
2
$140,470
0
$0
0
$0
0
$0
FILES CLOSED FOR INCOMPLETENESS
0
$0
0
$0
0
$0
0
$0
0
$0
0
$0
Aggregated Statistics For Year 2007 (Based on 2 partial tracts)
A) FHA, FSA/RHS & VA Home Purchase Loans
B) Conventional Home Purchase Loans
C) Refinancings
D) Home Improvement Loans
F) Non-occupant Loans on < 5 Family Dwellings (A B C & D)
G) Loans On Manufactured Home Dwelling (A B C & D)
Number
Average Value
Number
Average Value
Number
Average Value
Number
Average Value
Number
Average Value
Number
Average Value
LOANS ORIGINATED
1
$87,750
8
$74,060
43
$101,730
14
$20,758
6
$59,570
17
$37,078
APPLICATIONS APPROVED, NOT ACCEPTED
0
$0
2
$37,435
2
$127,190
1
$16,100
0
$0
2
$67,620
APPLICATIONS DENIED
2
$108,675
10
$151,179
20
$97,727
5
$33,650
0
$0
9
$76,653
APPLICATIONS WITHDRAWN
0
$0
2
$68,425
4
$99,418
0
$0
0
$0
2
$68,425
FILES CLOSED FOR INCOMPLETENESS
0
$0
0
$0
2
$158,990
0
$0
0
$0
0
$0
Aggregated Statistics For Year 2006 (Based on 2 partial tracts)
A) FHA, FSA/RHS & VA Home Purchase Loans
B) Conventional Home Purchase Loans
C) Refinancings
D) Home Improvement Loans
F) Non-occupant Loans on < 5 Family Dwellings (A B C & D)
G) Loans On Manufactured Home Dwelling (A B C & D)
Number
Average Value
Number
Average Value
Number
Average Value
Number
Average Value
Number
Average Value
Number
Average Value
LOANS ORIGINATED
2
$139,670
27
$105,932
39
$84,484
12
$32,670
8
$50,916
29
$57,932
APPLICATIONS APPROVED, NOT ACCEPTED
0
$0
4
$61,582
8
$98,210
1
$64,400
1
$14,490
4
$71,645
APPLICATIONS DENIED
2
$53,535
19
$62,027
28
$119,169
6
$89,623
2
$167,845
25
$53,323
APPLICATIONS WITHDRAWN
0
$0
2
$84,525
11
$113,432
0
$0
0
$0
1
$68,420
FILES CLOSED FOR INCOMPLETENESS
0
$0
0
$0
2
$173,075
1
$24,150
0
$0
2
$173,075
Aggregated Statistics For Year 2005 (Based on 2 partial tracts)
A) FHA, FSA/RHS & VA Home Purchase Loans
B) Conventional Home Purchase Loans
C) Refinancings
D) Home Improvement Loans
F) Non-occupant Loans on < 5 Family Dwellings (A B C & D)
G) Loans On Manufactured Home Dwelling (A B C & D)
Number
Average Value
Number
Average Value
Number
Average Value
Number
Average Value
Number
Average Value
Number
Average Value
LOANS ORIGINATED
1
$96,600
21
$95,872
31
$84,084
10
$27,451
10
$49,910
20
$55,746
APPLICATIONS APPROVED, NOT ACCEPTED
1
$47,500
2
$99,015
3
$84,527
0
$0
1
$67,620
3
$100,627
APPLICATIONS DENIED
1
$40,250
16
$78,639
30
$72,128
6
$15,162
0
$0
25
$60,890
APPLICATIONS WITHDRAWN
0
$0
2
$81,710
8
$91,066
1
$16,100
0
$0
1
$70,040
FILES CLOSED FOR INCOMPLETENESS
1
$53,130
0
$0
1
$75,670
1
$17,710
0
$0
1
$53,130
Aggregated Statistics For Year 2004 (Based on 2 partial tracts)
A) FHA, FSA/RHS & VA Home Purchase Loans
B) Conventional Home Purchase Loans
C) Refinancings
D) Home Improvement Loans
F) Non-occupant Loans on < 5 Family Dwellings (A B C & D)
G) Loans On Manufactured Home Dwelling (A B C & D)
Number
Average Value
Number
Average Value
Number
Average Value
Number
Average Value
Number
Average Value
Number
Average Value
LOANS ORIGINATED
2
$127,595
27
$90,250
27
$65,861
13
$32,943
10
$72,370
21
$51,022
APPLICATIONS APPROVED, NOT ACCEPTED
1
$126,390
2
$92,575
8
$111,492
0
$0
0
$0
6
$62,120
APPLICATIONS DENIED
1
$24,150
10
$65,849
32
$84,777
5
$18,032
2
$53,935
13
$42,046
APPLICATIONS WITHDRAWN
0
$0
1
$32,200
11
$131,215
0
$0
0
$0
0
$0
FILES CLOSED FOR INCOMPLETENESS
0
$0
0
$0
6
$125,043
1
$61,180
0
$0
2
$78,890
Aggregated Statistics For Year 2003 (Based on 2 partial tracts)
A) FHA, FSA/RHS & VA Home Purchase Loans
B) Conventional Home Purchase Loans
C) Refinancings
D) Home Improvement Loans
F) Non-occupant Loans on < 5 Family Dwellings (A B C & D)
Number
Average Value
Number
Average Value
Number
Average Value
Number
Average Value
Number
Average Value
LOANS ORIGINATED
5
$82,754
36
$68,336
65
$90,754
8
$15,496
6
$61,315
APPLICATIONS APPROVED, NOT ACCEPTED
3
$48,300
22
$38,091
6
$90,027
0
$0
1
$44,280
APPLICATIONS DENIED
9
$39,713
89
$38,541
46
$93,573
3
$25,760
2
$49,510
APPLICATIONS WITHDRAWN
1
$101,430
2
$112,300
21
$114,195
1
$5,640
1
$31,400
FILES CLOSED FOR INCOMPLETENESS
0
$0
0
$0
19
$128,165
0
$0
0
$0
Aggregated Statistics For Year 2002 (Based on 2 partial tracts)
A) FHA, FSA/RHS & VA Home Purchase Loans
B) Conventional Home Purchase Loans
C) Refinancings
D) Home Improvement Loans
F) Non-occupant Loans on < 5 Family Dwellings (A B C & D)
Number
Average Value
Number
Average Value
Number
Average Value
Number
Average Value
Number
Average Value
LOANS ORIGINATED
5
$44,920
19
$86,771
39
$75,670
8
$13,886
2
$108,275
APPLICATIONS APPROVED, NOT ACCEPTED
2
$43,875
20
$39,808
10
$59,651
1
$45,890
0
$0
APPLICATIONS DENIED
10
$42,585
57
$45,588
30
$59,570
6
$16,772
1
$25,760
APPLICATIONS WITHDRAWN
0
$0
2
$71,645
10
$93,863
0
$0
0
$0
FILES CLOSED FOR INCOMPLETENESS
0
$0
0
$0
2
$59,570
0
$0
0
$0
Aggregated Statistics For Year 2001 (Based on 2 partial tracts)
B) Conventional Home Purchase Loans
C) Refinancings
D) Home Improvement Loans
F) Non-occupant Loans on < 5 Family Dwellings (A B C & D)
Number
Average Value
Number
Average Value
Number
Average Value
Number
Average Value
LOANS ORIGINATED
20
$55,666
36
$69,319
11
$20,491
2
$16,100
APPLICATIONS APPROVED, NOT ACCEPTED
7
$76,706
2
$96,600
0
$0
0
$0
APPLICATIONS DENIED
31
$43,834
34
$52,917
1
$4,030
4
$31,395
APPLICATIONS WITHDRAWN
2
$107,470
11
$63,010
0
$0
0
$0
FILES CLOSED FOR INCOMPLETENESS
0
$0
2
$66,815
0
$0
0
$0
Aggregated Statistics For Year 2000 (Based on 2 partial tracts)
A) FHA, FSA/RHS & VA Home Purchase Loans
B) Conventional Home Purchase Loans
C) Refinancings
D) Home Improvement Loans
F) Non-occupant Loans on < 5 Family Dwellings (A B C & D)
Number
Average Value
Number
Average Value
Number
Average Value
Number
Average Value
Number
Average Value
LOANS ORIGINATED
2
$72,050
27
$47,734
19
$56,901
6
$36,092
3
$31,933
APPLICATIONS APPROVED, NOT ACCEPTED
1
$37,840
18
$43,336
8
$58,464
0
$0
1
$28,980
APPLICATIONS DENIED
2
$58,765
87
$38,353
21
$55,852
3
$11,540
1
$9,660
APPLICATIONS WITHDRAWN
1
$24,150
3
$62,523
8
$39,244
0
$0
0
$0
FILES CLOSED FOR INCOMPLETENESS
0
$0
0
$0
5
$40,090
0
$0
1
$20,930
Aggregated Statistics For Year 1999 (Based on 1 partial tract)
A) FHA, FSA/RHS & VA Home Purchase Loans
B) Conventional Home Purchase Loans
C) Refinancings
D) Home Improvement Loans
F) Non-occupant Loans on < 5 Family Dwellings (A B C & D)


 Nearest zip codes: 29477, 29432, 29481, 29018, 29133, 29448.


