Estimated zip code population in 2022: 16,801 Zip code population in 2010: 15,330 Zip code population in 2000: 13,206
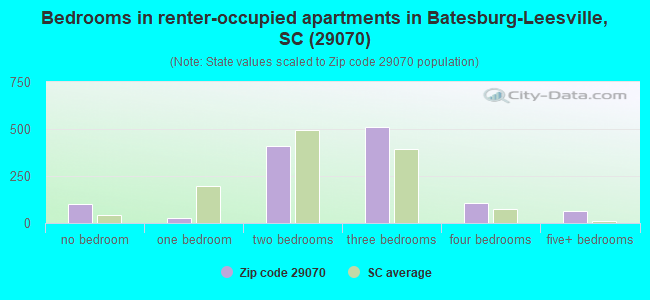
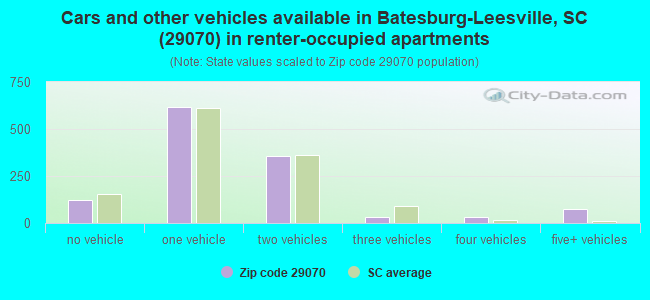
Houses and condos: 8,049 Renter-occupied apartments: 1,237
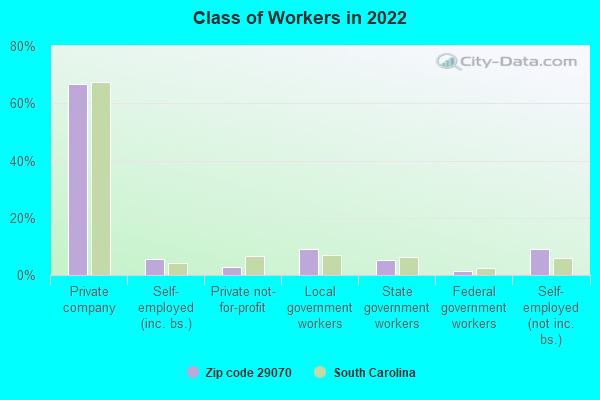
% of renters here:
19%
State:
28%
March 2022 cost of living index in zip code 29070: 80.6 (low, U.S. average is 100)
Land area: 165.3 sq. mi. Water area: 8.6 sq. mi.
Population density: 102 people per square mile
(very low).
OSM Map
General Map
Google Map
MSN Map
OSM Map
General Map
Google Map
MSN Map
OSM Map
General Map
Google Map
MSN Map
OSM Map
General Map
Google Map
MSN Map
Please wait while loading the map...
Real estate property taxes paid for housing units in 2022:
This zip code:
0.4% ($786)
South Carolina:
0.5% ($1,185)
Median real estate property taxes paid for housing units with mortgages in 2022: $923 (0.5%) Median real estate property taxes paid for housing units with no mortgage in 2022: $643 (0.4%)
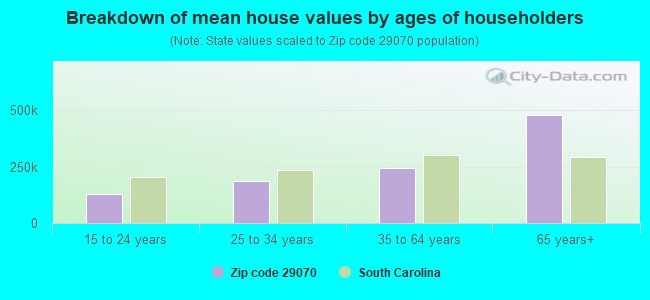
Estimated median house/condo value in 2022: $183,708
29070:
$183,708
South Carolina:
$254,600
According to our research of South Carolina and other state lists, there were 7 registered sex offenders living in 29070 zip code as of May 28, 2024. The ratio of all residents to sex offenders in zip code 29070 is 2,166 to 1. The ratio of registered sex offenders to all residents in this zip code is lower than the state average.
Median resident age:
This zip code:
41.2 years
South Carolina median age:
40.5 years
Average household size:
This zip code:
2.6 people
South Carolina:
2.4 people
Averages for the 2020 tax year for zip code 29070, filed in 2021:
Average Adjusted Gross Income (AGI) in 2020: $60,002 (Individual Income Tax Returns)
Here:
$60,002
State:
$65,754
Salary/wage: $48,628 (reported on 80.6% of returns)
Here:
$48,628
State:
$52,566
(% of AGI for various income ranges: 1302.7% for AGIs below $25k, 3879.9% for AGIs $25k-50k, 7209.7% for AGIs $50k-75k, 10540.5% for AGIs $75k-100k, 18588.4% for AGIs $100k-200k, 82306.0% for AGIs over 200k)
Taxable interest for individuals: $1,252 (reported on 23.9% of returns)
This zip code:
$1,252
South Carolina:
$1,749
(% of AGI for various income ranges: 11.8% for AGIs below $25k, 17.1% for AGIs $25k-50k, 29.1% for AGIs $50k-75k, 99.2% for AGIs $75k-100k, 114.9% for AGIs $100k-200k, 1358.0% for AGIs over 200k)
Ordinary dividends: $5,742 (reported on 14.6% of returns)
Here:
$5,742
State:
$8,783
(% of AGI for various income ranges: 16.6% for AGIs below $25k, 38.6% for AGIs $25k-50k, 64.9% for AGIs $50k-75k, 186.3% for AGIs $75k-100k, 409.1% for AGIs $100k-200k, 4762.0% for AGIs over 200k)
Net capital gain/loss in AGI: +$13,844 (reported on 13.7% of returns)
Here:
+$13,844
State:
+$24,194
(% of AGI for various income ranges: 10.2% for AGIs below $25k, 23.8% for AGIs $25k-50k, 93.4% for AGIs $50k-75k, 232.9% for AGIs $75k-100k, 870.0% for AGIs $100k-200k, 16360.0% for AGIs over 200k)
Profit/loss from business: +$12,392 (reported on 15.5% of returns)
Here:
+$12,392
State:
+$11,253
(% of AGI for various income ranges: 139.3% for AGIs below $25k, 206.0% for AGIs $25k-50k, 176.9% for AGIs $50k-75k, 341.6% for AGIs $75k-100k, 775.8% for AGIs $100k-200k, 5844.0% for AGIs over 200k)
Taxable individual retirement arrangement distribution: $21,099 (reported on 10.4% of returns)
29070:
$21,099
South Carolina:
$21,604
(% of AGI for various income ranges: 62.1% for AGIs below $25k, 123.0% for AGIs $25k-50k, 314.5% for AGIs $50k-75k, 578.9% for AGIs $75k-100k, 1397.3% for AGIs $100k-200k, 5648.0% for AGIs over 200k)
Total itemized deductions: $34,941 (reported on 5.5% of returns)
Here:
$34,941
State:
$35,199
(% of AGI for various income ranges: 25.7% for AGIs below $25k, 110.0% for AGIs $25k-50k, 221.3% for AGIs $50k-75k, 380.0% for AGIs $75k-100k, 984.9% for AGIs $100k-200k, 9926.0% for AGIs over 200k)
Charity contributions: $11,403 (reported on 4.7% of returns)
Here:
$11,403
State:
$14,319
(% of AGI for various income ranges: 17.2% for AGIs $25k-50k, 52.2% for AGIs $50k-75k, 99.7% for AGIs $75k-100k, 342.9% for AGIs $100k-200k, 2954.0% for AGIs over 200k)
Taxes paid: $7,298 (reported on 5.5% of returns)
29070:
$7,298
State:
$7,486
(% of AGI for various income ranges: 16.7% for AGIs $25k-50k, 43.7% for AGIs $50k-75k, 93.7% for AGIs $75k-100k, 278.9% for AGIs $100k-200k, 1704.0% for AGIs over 200k)
Earned income credit: $2,405 (reported on 19.4% of returns)
Here:
$2,405
State:
$2,397
(% of AGI for various income ranges: 127.0% for AGIs below $25k, 85.8% for AGIs $25k-50k, 2.5% for AGIs $50k-75k)
Percentage of individuals using paid preparers for their 2020 taxes: 93.7%
Here:
94%
State:
93%
(% for various income ranges: 92.4% for AGIs below $25k, 93.9% for AGIs $25k-50k, 94.5% for AGIs $50k-75k, 94.2% for AGIs $75k-100k, 94.8% for AGIs $100k-200k, 95.5% for AGIs over 200k)
Averages for the 2012 tax year for zip code 29070, filed in 2013:
Average Adjusted Gross Income (AGI) in 2012: $44,688 (Individual Income Tax Returns)
Here:
$44,688
State:
$51,133
Salary/wage: $38,920 (reported on 84.0% of returns)
Here:
$38,920
State:
$42,173
(% of AGI for various income ranges: 75.7% for AGIs below $25k, 80.8% for AGIs $25k-50k, 75.6% for AGIs $50k-75k, 73.4% for AGIs $75k-100k, 68.7% for AGIs $100k-200k, 54.4% for AGIs over 200k)
Taxable interest for individuals: $1,032 (reported on 26.4% of returns)
This zip code:
$1,032
South Carolina:
$1,468
(% of AGI for various income ranges: 0.9% for AGIs below $25k, 0.5% for AGIs $25k-50k, 0.5% for AGIs $50k-75k, 0.5% for AGIs $75k-100k, 0.6% for AGIs $100k-200k, 1.1% for AGIs over 200k)
Ordinary dividends: $3,165 (reported on 14.8% of returns)
Here:
$3,165
State:
$6,511
(% of AGI for various income ranges: 0.9% for AGIs below $25k, 0.5% for AGIs $25k-50k, 0.6% for AGIs $50k-75k, 1.0% for AGIs $75k-100k, 1.0% for AGIs $100k-200k, 3.9% for AGIs over 200k)
Net capital gain/loss in AGI: +$4,726 (reported on 10.5% of returns)
Here:
+$4,726
State:
+$13,061
(% of AGI for various income ranges: 0.3% for AGIs below $25k, 0.4% for AGIs $25k-50k, 0.9% for AGIs $50k-75k, 1.0% for AGIs $75k-100k, 2.2% for AGIs $100k-200k, 1.9% for AGIs over 200k)
Profit/loss from business: +$9,904 (reported on 14.9% of returns)
Here:
+$9,904
State:
+$10,167
(% of AGI for various income ranges: 7.6% for AGIs below $25k, 1.9% for AGIs $25k-50k, 1.1% for AGIs $50k-75k, 1.6% for AGIs $75k-100k, 3.1% for AGIs $100k-200k, 10.4% for AGIs over 200k)
Taxable individual retirement arrangement distribution: $14,534 (reported on 9.3% of returns)
29070:
$14,534
South Carolina:
$17,019
(% of AGI for various income ranges: 2.9% for AGIs below $25k, 2.2% for AGIs $25k-50k, 2.9% for AGIs $50k-75k, 2.9% for AGIs $75k-100k, 5.1% for AGIs $100k-200k)
Total itemized deductions: $19,510 (23% of AGI, reported on 26.4% of returns)
Here:
$19,510
State:
$22,890
Here:
22.9% of AGI
State:
21.4% of AGI
(% of AGI for various income ranges: 6.7% for AGIs below $25k, 7.7% for AGIs $25k-50k, 11.8% for AGIs $50k-75k, 13.2% for AGIs $75k-100k, 15.2% for AGIs $100k-200k, 14.2% for AGIs over 200k)
Charity contributions: $4,125 (reported on 21.6% of returns)
Here:
$4,125
State:
$5,169
(% of AGI for various income ranges: 0.8% for AGIs below $25k, 1.1% for AGIs $25k-50k, 1.8% for AGIs $50k-75k, 2.3% for AGIs $75k-100k, 3.1% for AGIs $100k-200k, 3.1% for AGIs over 200k)
Taxes paid: $6,330 (reported on 26.2% of returns)
29070:
$6,330
State:
$7,644
(% of AGI for various income ranges: 1.0% for AGIs below $25k, 1.6% for AGIs $25k-50k, 3.1% for AGIs $50k-75k, 4.5% for AGIs $75k-100k, 6.2% for AGIs $100k-200k, 6.6% for AGIs over 200k)
Earned income credit: $2,413 (reported on 23.0% of returns)
Here:
$2,413
State:
$2,418
(% of AGI for various income ranges: 8.0% for AGIs below $25k, 1.3% for AGIs $25k-50k)
Percentage of individuals using paid preparers for their 2012 taxes: 64.2%
Here:
64%
State:
57%
(% for various income ranges: 60.9% for AGIs below $25k, 63.0% for AGIs $25k-50k, 68.4% for AGIs $50k-75k, 70.9% for AGIs $75k-100k, 67.3% for AGIs $100k-200k, 85.7% for AGIs over 200k)
Averages for the 2004 tax year for zip code 29070, filed in 2005:
Average Adjusted Gross Income (AGI) in 2004: $39,818 (Individual Income Tax Returns)
Here:
$39,818
State:
$41,965
Salary/wage: $34,791 (reported on 86.1% of returns)
Here:
$34,791
State:
$35,695
(% of AGI for various income ranges: 105.8% for AGIs below $10k, 79.0% for AGIs $10k-25k, 83.7% for AGIs $25k-50k, 81.3% for AGIs $50k-75k, 83.3% for AGIs $75k-100k, 52.0% for AGIs over 100k)
Taxable interest for individuals: $1,249 (reported on 35.3% of returns)
This zip code:
$1,249
South Carolina:
$1,623
(% of AGI for various income ranges: 3.9% for AGIs below $10k, 1.5% for AGIs $10k-25k, 1.0% for AGIs $25k-50k, 0.9% for AGIs $50k-75k, 0.7% for AGIs $75k-100k, 1.2% for AGIs over 100k)
Taxable dividends: $4,339 (reported on 16.4% of returns)
Here:
$4,339
State:
$3,999
(% of AGI for various income ranges: 1.7% for AGIs below $10k, 0.4% for AGIs $10k-25k, 0.5% for AGIs $25k-50k, 0.8% for AGIs $50k-75k, 0.7% for AGIs $75k-100k, 5.3% for AGIs over 100k)
Net capital gain/loss: +$6,288 (reported on 11.2% of returns)
Here:
+$6,288
State:
+$13,100
(% of AGI for various income ranges: -0.4% for AGIs below $10k, 0.6% for AGIs $10k-25k, 0.5% for AGIs $25k-50k, 0.6% for AGIs $50k-75k, 1.1% for AGIs $75k-100k, 5.4% for AGIs over 100k)
Profit/loss from business: +$8,116 (reported on 15.2% of returns)
Here:
+$8,116
State:
+$9,144
(% of AGI for various income ranges: 7.1% for AGIs below $10k, 5.7% for AGIs $10k-25k, 1.9% for AGIs $25k-50k, 2.4% for AGIs $50k-75k, 0.2% for AGIs $75k-100k, 5.2% for AGIs over 100k)
IRA payment deduction: $2,829 (reported on 2.4% of returns)
29070:
$2,829
South Carolina:
$2,972
(% of AGI for various income ranges: 0.2% for AGIs $10k-25k, 0.3% for AGIs $25k-50k, 0.2% for AGIs $50k-75k, 0.1% for AGIs $75k-100k, 0.1% for AGIs over 100k)
Self-employed pension: $8,350 (reported on 0.3% of returns)
Here:
$8,350
South Carolina:
$15,117
Total itemized deductions: $18,693 (25% of AGI, reported on 30.6% of returns)
Here:
$18,693
State:
$19,039
Here:
25.2% of AGI
State:
22.8% of AGI
(% of AGI for various income ranges: 11.7% for AGIs below $10k, 7.3% for AGIs $10k-25k, 10.3% for AGIs $25k-50k, 15.1% for AGIs $50k-75k, 17.5% for AGIs $75k-100k, 19.9% for AGIs over 100k)
Charity contributions deductions: $4,084 (6% of AGI, reported on 26.1% of returns)
Here:
$4,084
State:
$4,305
Here:
5.6% of AGI
State:
5.0% of AGI
(% of AGI for various income ranges: 0.9% for AGIs below $10k, 1.1% for AGIs $10k-25k, 1.5% for AGIs $25k-50k, 2.4% for AGIs $50k-75k, 3.6% for AGIs $75k-100k, 4.6% for AGIs over 100k)
Total tax: $5,276 (reported on 72.9% of returns)
29070:
$5,276
State:
$6,497
(% of AGI for various income ranges: 3.3% for AGIs below $10k, 3.8% for AGIs $10k-25k, 6.5% for AGIs $25k-50k, 8.5% for AGIs $50k-75k, 9.9% for AGIs $75k-100k, 17.2% for AGIs over 100k)
Earned income credit: $1,904 (reported on 19.7% of returns)
Here:
$1,904
State:
$1,882
Percentage of individuals using paid preparers for their 2004 taxes: 71.1%
Here:
71%
State:
66%
(% for various income ranges: 64.1% for AGIs below $10k, 72.9% for AGIs $10k-25k, 72.5% for AGIs $25k-50k, 73.4% for AGIs $50k-75k, 72.2% for AGIs $75k-100k, 70.6% for AGIs over 100k)
Likely homosexual households (counted as self-reported same-sex unmarried-partner households)
Lesbian couples: 0.0% of all households
Gay men: 0.1% of all households
Household received Food Stamps/SNAP in the past 12 months: 1,153 Household did not receive Food Stamps/SNAP in the past 12 months: 5,398
Women who had a birth in the past 12 months: 247 (120 now married, 121 unmarried) Women who did not have a birth in the past 12 months: 3,383 (1,487 now married, 1,898 unmarried)
Housing units in zip code 29070 with a mortgage: 2,708 (179 second mortgage, 170 both second mortgage and home equity loan) Houses without a mortgage: 82
Median monthly owner costs for units with a mortgage: $1,179 Median monthly owner costs for units without a mortgage: $344
Residents with income below the poverty level in 2022:
This zip code:
17.8%
Whole state:
14.0%
Residents with income below 50% of the poverty level in 2022:
This zip code:
7.7%
Whole state:
7.3%
Median number of rooms in houses and condos:
Here:
6.1
State:
6.4
Median number of rooms in apartments:
Here:
5.0
State:
4.5
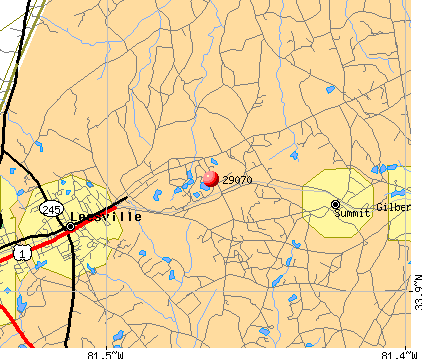
Notable locations in this zip code not listed on our city pages
Notable locations in zip code 29070: Camp Kinard (A), Camp Clark (B), Lexington County Fire Service Cedar Grove (C), Circle Fire Department Station 800 (D), Batesburg - Leesville Fire Department Station 25 (E), Lexington County Fire Service Fairview (F), Delmar Community Center (G). Display/hide their locations on the map
Churches in zip code 29070 include: Pleasant Hill Church (A), Pine Grove Church (B), Old Lexington Church (C), Mount Pleasant Church (D), Beulah Church (E), Friendship Church (F), Enon Lutheran Church (G), Ebenezer Church (H), Convent Church (I). Display/hide their locations on the map
Cemeteries: Wise Cemetery (1), Foulk Cemetery (2), Fullmer Cemetery (3), Banks Cemetery (4), Barr Cemetery (5), Bouknight Cemetery (6), Butler Cemetery (7). Display/hide their locations on the map
Lakes and reservoirs: Altman Pond (A), Old Bay (B), Lucas Ponds (C), Gantts Pond (D), Ponderosos Pond (E), Halls Pond (F), Steedman Pond (G), Hall Pond (H). Display/hide their locations on the map
Streams, rivers, and creeks: Wolf Pit Branch (A), Tanker Branch (B), Spring Creek (C), West Creek (D), Rocky Ford Creek (E), Rocky Creek (F), Rambo Branch (G), Hood Branch (H), Black Creek (I). Display/hide their locations on the map
2,177 married couples with children.
799 single-parent households (104 men, 695 women).
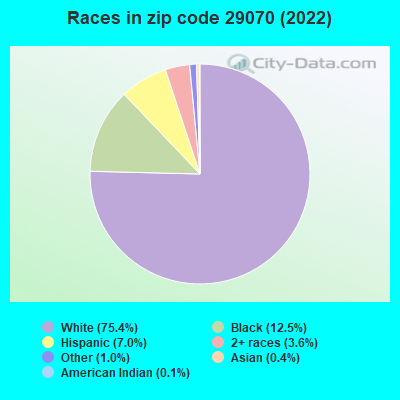
90.6% of residents of 29070 zip code speak English at home.
6.8% of residents speak Spanish at home (64% very well, 16% well, 21% not well).
1.6% of residents speak other Indo-European language at home (91% very well, 9% well).
0.8% of residents speak Asian or Pacific Island language at home (95% very well, 5% well).
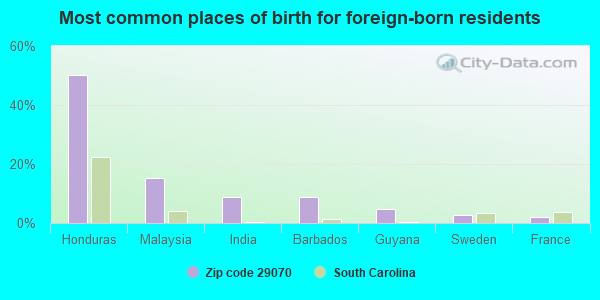
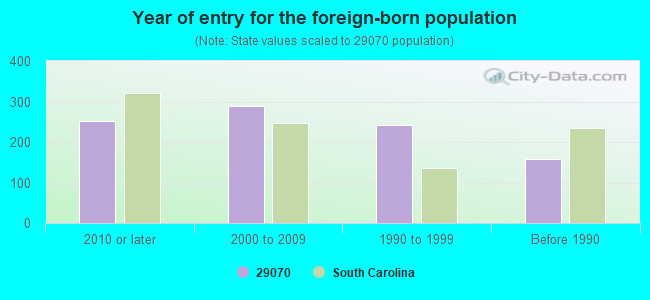
Foreign born population: 748 (4.5%) (38.5% of them are naturalized citizens)
This zip code:
4.5%
Whole state:
5.2%
50%Honduras
15%Malaysia
9%India
9%Barbados
5%Guyana
3%Sweden
2%France
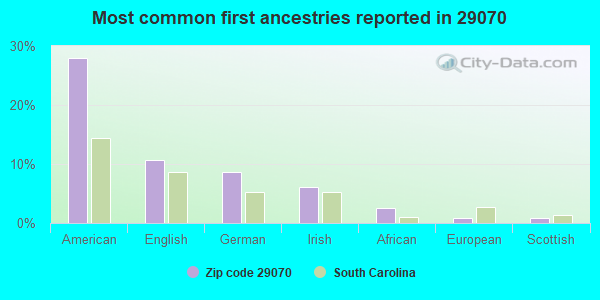
28%American
11%English
9%German
6%Irish
3%African
1%European
1%Scottish
Year of entry for the foreign-born population
2522010 or later
2882000 to 2009
2411990 to 1999
157Before 1990
Facilities with environmental interests located in this zip code:
COLUMBIA FARMS LEESVILLE (125 NORTH LEE STREET in LEESVILLE, SC)
AIR MINOR (AIRS/AFS) National Pollutant Discharge Elimination System NON-MAJOR (Tracking pollutant discharge elimination systems) - permit STATE MASTER (South Carolina database) - AIR PROGRAM, UNDERGROUND STORAGE TANK PROGRAM, National Pollutant Discharge Elimination System Permit, AIR PROGRAM Business SIC classification: POULTRY HATCHERIES; MEAT PACKING PLANTS; POULTRY SLAUGHTERING AND PROCESSING; PREPARED FEEDS AND FEED INGREDIENTS FOR ANIMALS AND FOWLS, EXCEPT DOGS AND CATS; FOOD PREPARATIONS Organizations: COLUMBIA FARMS HATCHERY-FEED M (CONTACT/OWNER)
Alternative names: COLUMBIA FARMS INC - LEESVILLE, COLUMBIA FARMS HATCHERY-FEED M
EMERALD WELDING (404 DIXIE DRIVE in GREENWOOD, SC)
AIR MINOR (AIRS/AFS) STATE MASTER (South Carolina database) - AIR PROGRAM, Business SIC classification: MISCELLANEOUS STRUCTURAL METALWORK; ELECTRIC AND GAS WELDING AND SOLDERING EQUIPMENT
BATESBURG-LEESVILLE ELEMENTARY (403 SOUTH LEE STREET in LEESVILLE, SC)
(National Center for Education Statistics) - STATE ID-3203028 Organizations: LEXINGTON COUNTY SCHOOL DISTRICT 03 (SCHOOL DISTRICT)
Housing units lacking complete plumbing facilities: 4.2% Housing units lacking complete kitchen facilities: 2.3%
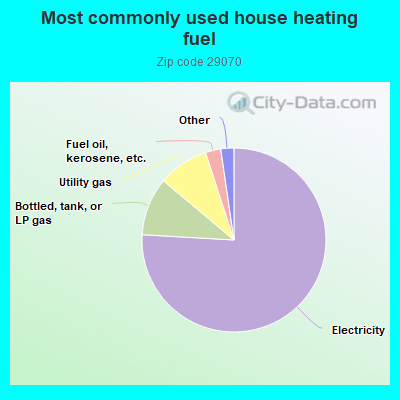
76.0%Electricity
10.2%Bottled, tank, or LP gas
8.9%Utility gas
2.7%Fuel oil, kerosene, etc.
0.9%Other fuel
0.8%No fuel used
Population in 1990: 8,605. Population change in the 1990s: +4,601 (+53.5%).
Place of birth for U.S.-born residents:
This state: 11,910
Northeast: 848
Midwest: 871
South: 1,863
West: 146
61% of the 29070 zip code residents lived in the same house 5 years ago. Out of people who lived in different houses, 62% lived in this county. Out of people who lived in different counties, 50% lived in South Carolina.
91% of the 29070 zip code residents lived in the same house 1 year ago. Out of people who lived in different houses, 36% moved from this county. Out of people who lived in different houses, 28% moved from different county within same state. Out of people who lived in different houses, 13% moved from different state. Out of people who lived in different houses, 21% moved from abroad.
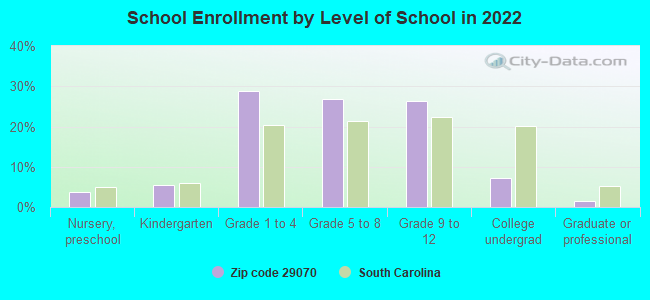
Private vs. public school enrollment:
Students in private schools in grades 1 to 8 (elementary and middle school): 177
Here:
9.4%
South Carolina:
14.4%
Students in private schools in grades 9 to 12 (high school): 139
Here:
15.3%
South Carolina:
11.1%
Students in private undergraduate colleges: 27
Here:
11.2%
South Carolina:
21.9%
Occupation by median earnings in the past 12 months ($)
82,831Health diagnosing and treating practitioners and other technical occupations
81,204Architecture and engineering occupations
65,709Life, physical, and social science occupations
64,135Computer and mathematical occupations
59,634Law enforcement workers including supervisors
58,768Management occupations
Companies with federal contracts located in this zip code (LEESVILLE, SC):
A O INC (130 TOP-O-LAKE DRIVE; small business) : $37,026 in 8 contractsfrom 2003 to 2006
Contracts for Miscellaneous Construction Materials, Centrifugals, Separators, and Pressure and Vacuum Filters, Construction of Structures and Facilities -- Other Utilities by Army Signed by year:2000: $0; 2001: $0; 2002: $0; 2003: $17,725; 2004: $10,634; 2005: $0; 2006: $8,667.
Biggest contracts:
$9,333 with Army for Miscellaneous Construction Materials. Signed on 2003-04-29. Completion date: 2003-05-27.
$8,667 with Army for Centrifugals, Separators, and Pressure and Vacuum Filters. Signed on 2006-04-17. Completion date: 2006-06-11.
$6,592 with Army for Miscellaneous Construction Materials. Signed on 2003-07-01. Completion date: 2003-05-27.
$5,667 with Army for Construction of Structures and Facilities -- Other Utilities. Signed on 2004-05-20. Completion date: 2004-06-18.
OSWALD WHOLESALE LUMBER INC (6707 AUGUSTA HWY; small business) : $24,902 in 3 contractsin 2005
$27,074 with Army for Miscellaneous Construction Materials. Signed on 2005-04-20. Completion date: 2005-05-20.
$4,527, same as above.Signed on 2005-05-04. Completion date: 2005-05-04.
-$6,699, same as above.Signed on 2005-05-13. Completion date: 2005-05-20.
VINTAGE AVIATION INC (129 S EAST AVENUE; small business) : $11,900 in 3 contractsfrom 2003 to 2006
$4,500 with Air Force for Other Professional Services. Taking place in TN. Signed on 2003-04-21. Completion date: 2003-06-30.
$4,200 with Air Force for Other Professional Services. Signed on 2006-03-06. Completion date: 2006-04-08.
$3,200 with Air Force for Recreational Services. Signed on 2005-02-10. Completion date: 2005-04-23.
MEDICAL DYNAMICS OF SC, INC (808 MEDDYN CIRCLE; small business) : $9,998 in 4 contractsfrom 2004 to 2006
$3,552 with Army for ADP Software. Taking place in GA. Signed on 2006-06-06. Completion date: 2005-04-30.
$3,246, same as above.Signed on 2004-09-04. Completion date: 2005-04-30.
$3,200, same as above.Signed on 2005-05-26. Completion date: 2005-04-30.
$0, same as above.Signed on 2004-09-04. Completion date: 2005-04-30.
SHEALYS BAR-B-QUE HOUSE INC (340 E COLUMBIA AVE; small business)
$3,649 with Army for Food Services. Signed on 2002-10-31. Completion date: 2002-11-02.
Top industries in this zip code by the number of employees in 2005:
2002 - 2018 National Fire Incident Reporting System (NFIRS) incidents
Based on the data from the years 2002 - 2018 the average number of fires per year is 105. The highest number of fires - 190 took place in 2013, and the least - 21 in 2002. The data has an increasing trend.
When looking into fire subcategories, the most incidents belonged to: Outside Fires (58.8%), and Structure Fires (26.8%).
Fire incident types reported to NFIRS in Zip Code 29070

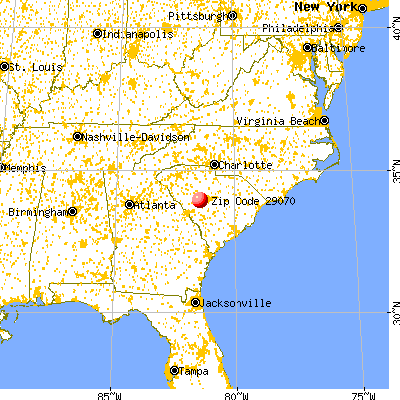


 Nearest zip codes: 29054, 29006, 29105, 29072, 29073, 29123.


 Based on the data from the years 2002 - 2018 the average number of fires per year is 105. The highest number of fires - 190 took place in 2013, and the least - 21 in 2002. The data has an increasing trend.
 When looking into fire subcategories, the most incidents belonged to: Outside Fires (58.8%), and Structure Fires (26.8%).