Estimated median house/condo value in 2022: $88,321
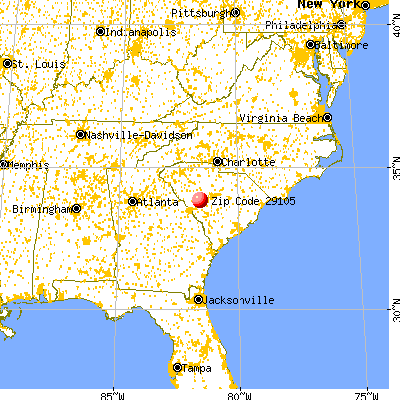
29105:
$88,321
South Carolina:
$254,600
According to our research of South Carolina and other state lists, there was 1 registered sex offender living in 29105 zip code as of May 28, 2024. The ratio of all residents to sex offenders in zip code 29105 is 1,297 to 1. The ratio of registered sex offenders to all residents in this zip code is near the state average.
Median resident age:
This zip code:
50.9 years
South Carolina median age:
40.5 years
Average household size:
This zip code:
3.1 people
South Carolina:
2.4 people
Averages for the 2020 tax year for zip code 29105, filed in 2021:
Average Adjusted Gross Income (AGI) in 2020: $37,507 (Individual Income Tax Returns)
Here:
$37,507
State:
$65,754
Salary/wage: $34,063 (reported on 87.8% of returns)
Here:
$34,063
State:
$52,566
(% of AGI for various income ranges: 1990.5% for AGIs below $25k, 3994.6% for AGIs $25k-50k, 6811.4% for AGIs $50k-75k, 12026.7% for AGIs $75k-100k, 15303.3% for AGIs $100k-200k)
Taxable interest for individuals: $230 (reported on 13.5% of returns)
This zip code:
$230
South Carolina:
$1,749
(% of AGI for various income ranges: 3.5% for AGIs below $25k, 8.5% for AGIs $25k-50k, 16.7% for AGIs $75k-100k)
Ordinary dividends: $1,140 (reported on 6.8% of returns)
Here:
$1,140
State:
$8,783
(% of AGI for various income ranges: 16.5% for AGIs below $25k, 34.3% for AGIs $50k-75k)
Net capital gain/loss in AGI: +$1,075 (reported on 5.4% of returns)
Here:
+$1,075
State:
+$24,194
(% of AGI for various income ranges: 61.4% for AGIs $50k-75k)
Profit/loss from business: +$4,638 (reported on 10.8% of returns)
Here:
+$4,638
State:
+$11,253
(% of AGI for various income ranges: 110.0% for AGIs below $25k, 215.7% for AGIs $50k-75k)
Taxable individual retirement arrangement distribution: $9,067 (reported on 4.1% of returns)
29105:
$9,067
South Carolina:
$21,604
(% of AGI for various income ranges: 209.2% for AGIs $25k-50k)
Total itemized deductions: $36,950 (reported on 2.7% of returns)
Here:
$36,950
State:
$35,199
(% of AGI for various income ranges: 568.5% for AGIs $25k-50k)
Taxes paid: $5,600 (reported on 4.1% of returns)
29105:
$5,600
State:
$7,486
(% of AGI for various income ranges: 129.2% for AGIs $25k-50k)
Earned income credit: $1,896 (reported on 33.8% of returns)
Here:
$1,896
State:
$2,397
(% of AGI for various income ranges: 157.0% for AGIs below $25k, 123.1% for AGIs $25k-50k)
Percentage of individuals using paid preparers for their 2020 taxes: 90.5%
Here:
91%
State:
93%
(% for various income ranges: 89.2% for AGIs below $25k, 94.1% for AGIs $25k-50k, 90.0% for AGIs $50k-75k, 100.0% for AGIs $75k-100k, 80.0% for AGIs $100k-200k)
Averages for the 2012 tax year for zip code 29105, filed in 2013:
Average Adjusted Gross Income (AGI) in 2012: $29,274 (Individual Income Tax Returns)
Here:
$29,274
State:
$51,133
Salary/wage: $26,238 (reported on 92.6% of returns)
Here:
$26,238
State:
$42,173
(% of AGI for various income ranges: 91.2% for AGIs below $25k, 87.6% for AGIs $25k-50k, 86.1% for AGIs $50k-75k, 139.9% for AGIs $75k-100k)
Taxable interest for individuals: $225 (reported on 11.8% of returns)
This zip code:
$225
South Carolina:
$1,468
Ordinary dividends: $1,180 (reported on 7.4% of returns)
Here:
$1,180
State:
$6,511
Profit/loss from business: +$2,983 (reported on 8.8% of returns)
Here:
+$2,983
State:
+$10,167
Taxable individual retirement arrangement distribution: $5,167 (reported on 4.4% of returns)
29105:
$5,167
South Carolina:
$17,019
Total itemized deductions: $16,289 (23% of AGI, reported on 13.2% of returns)
Here:
$16,289
State:
$22,890
Here:
23.4% of AGI
State:
21.4% of AGI
(% of AGI for various income ranges: 9.2% for AGIs $25k-50k, 14.9% for AGIs $50k-75k, 14.4% for AGIs $100k-200k)
Charity contributions: $5,500 (reported on 10.3% of returns)
Here:
$5,500
State:
$5,169
Taxes paid: $4,789 (reported on 13.2% of returns)
29105:
$4,789
State:
$7,644
(% of AGI for various income ranges: 1.7% for AGIs $25k-50k, 4.3% for AGIs $50k-75k, 6.1% for AGIs $100k-200k)
Earned income credit: $2,314 (reported on 32.4% of returns)
Here:
$2,314
State:
$2,418
(% of AGI for various income ranges: 8.8% for AGIs below $25k, 1.4% for AGIs $25k-50k)
Percentage of individuals using paid preparers for their 2012 taxes: 66.2%
Here:
66%
State:
57%
(% for various income ranges: 68.3% for AGIs below $25k, 56.2% for AGIs $25k-50k, 66.7% for AGIs $50k-75k, 133.3% for AGIs $75k-100k)
Averages for the 2004 tax year for zip code 29105, filed in 2005:
Average Adjusted Gross Income (AGI) in 2004: $29,207 (Individual Income Tax Returns)
Here:
$29,207
State:
$41,965
Salary/wage: $27,888 (reported on 90.2% of returns)
Here:
$27,888
State:
$35,695
(% of AGI for various income ranges: 120.4% for AGIs below $10k, 87.5% for AGIs $10k-25k, 87.8% for AGIs $25k-50k, 82.1% for AGIs $50k-75k, 90.2% for AGIs $75k-100k, 74.9% for AGIs over 100k)
Taxable interest for individuals: $548 (reported on 20.0% of returns)
This zip code:
$548
South Carolina:
$1,623
(% of AGI for various income ranges: 0.6% for AGIs below $10k, 0.2% for AGIs $10k-25k, 0.1% for AGIs $25k-50k, 1.0% for AGIs $50k-75k, 0.3% for AGIs $75k-100k)
Taxable dividends: $1,154 (reported on 9.1% of returns)
Here:
$1,154
State:
$3,999
Net capital gain/loss: +$31 (reported on 5.6% of returns)
Here:
+$31
State:
+$13,100
Profit/loss from business: +$1,655 (reported on 10.1% of returns)
Here:
+$1,655
State:
+$9,144
(% of AGI for various income ranges: 4.2% for AGIs below $10k, 2.0% for AGIs $10k-25k, 0.2% for AGIs $25k-50k, -0.2% for AGIs $50k-75k)
Total itemized deductions: $16,222 (28% of AGI, reported on 17.2% of returns)
Here:
$16,222
State:
$19,039
Here:
28.0% of AGI
State:
22.8% of AGI
(% of AGI for various income ranges: 6.4% for AGIs $10k-25k, 8.8% for AGIs $25k-50k, 11.1% for AGIs $50k-75k, 13.0% for AGIs $75k-100k, 14.1% for AGIs over 100k)
Charity contributions deductions: $4,562 (8% of AGI, reported on 15.5% of returns)
Here:
$4,562
State:
$4,305
Here:
7.7% of AGI
State:
5.0% of AGI
(% of AGI for various income ranges: 5.9% for AGIs below $10k, 2.9% for AGIs $25k-50k, 2.9% for AGIs $50k-75k, 3.5% for AGIs $75k-100k, 3.0% for AGIs over 100k)
Total tax: $3,160 (reported on 59.9% of returns)
29105:
$3,160
State:
$6,497
(% of AGI for various income ranges: 2.1% for AGIs below $10k, 2.3% for AGIs $10k-25k, 5.5% for AGIs $25k-50k, 7.8% for AGIs $50k-75k, 9.9% for AGIs $75k-100k, 13.0% for AGIs over 100k)
Earned income credit: $1,974 (reported on 33.3% of returns)
Here:
$1,974
State:
$1,882
Percentage of individuals using paid preparers for their 2004 taxes: 72.6%
Here:
73%
State:
66%
(% for various income ranges: 66.4% for AGIs below $10k, 79.4% for AGIs $10k-25k, 74.3% for AGIs $25k-50k, 57.5% for AGIs $50k-75k, 65.0% for AGIs $75k-100k, 92.9% for AGIs over 100k)
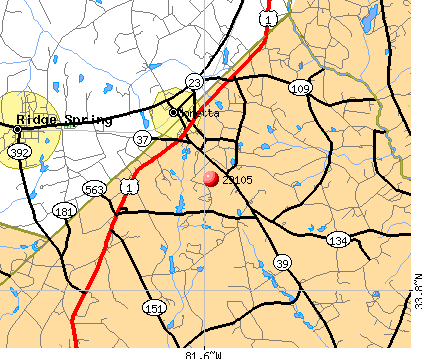
Churches in zip code 29105 include: Coleman Thankful Church (A), Double Branches Church (B), Bethel Church (C), Monetta Church (D), Ridge Branch Church (E). Display/hide their locations on the map
Cemeteries: Asbill Cemetery (1), Sawyer Cemetery (2), Burton Cemetery (3), Corley Cemetery (4), Bethel Cemetery (5), Williams Cemetery (6). Display/hide their locations on the map
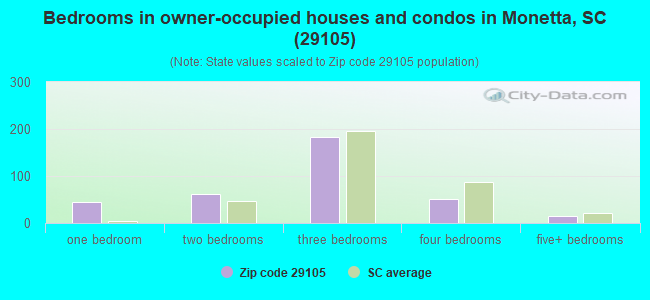
Size of family households: 124 2-persons, 37 3-persons, 35 4-persons, 5 5-persons
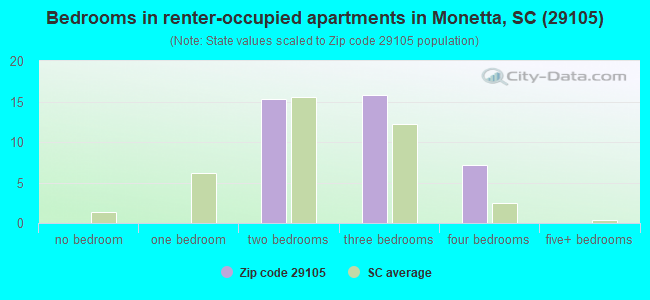
Size of nonfamily households: 91 1-person, 1 2-persons, 99 5-persons
68 married couples with children.
1 single-parent households (1 women).
98.2% of residents of 29105 zip code speak English at home.
1.9% of residents speak Spanish at home (100% very well).
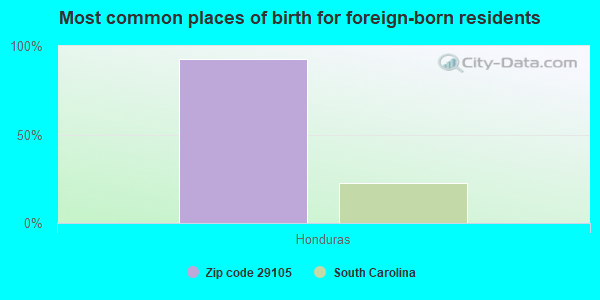
Foreign born population: 15 (1.2%) (100.0% of them are naturalized citizens)
This zip code:
1.2%
Whole state:
5.2%
93%Honduras
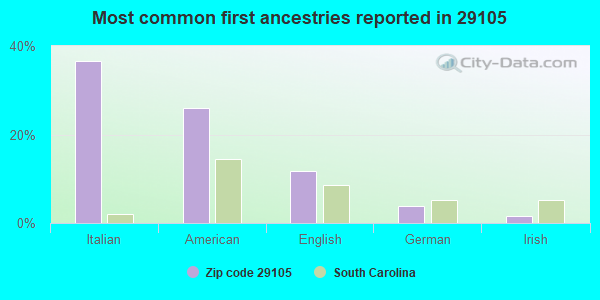
37%Italian
26%American
12%English
4%German
1%Irish
0%French Canadian
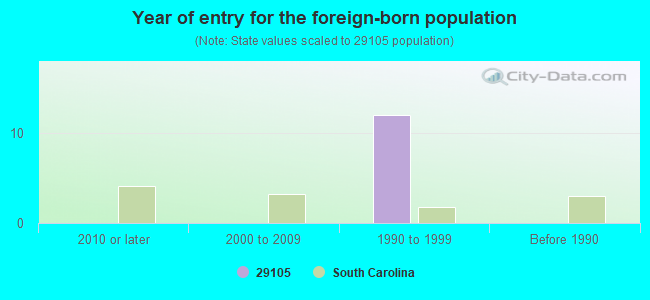
Year of entry for the foreign-born population
02010 or later
02000 to 2009
121990 to 1999
0Before 1990
Facilities with environmental interests located in this zip code:
COLUMBIA FARMS, INC. (5901 COLUMBIA HWY. NORTH in MONETTA, SC)
AIR MINOR (AIRS/AFS) STATE MASTER (South Carolina database) - AIR PROGRAM Business SIC classification: PREPARED FEEDS AND FEED INGREDIENTS FOR ANIMALS AND FOWLS, EXCEPT DOGS AND CATS
AMICK FARMS: MONETTA (HIGHWAY 23 in MONETTA, SC)
AIR SYNTHETIC MINOR (AIRS/AFS) CRITERIA AND HAZARDOUS AIR POLLUTANT INVENTORY (Inventory of air pollution sources) STATE MASTER (South Carolina database) - AIR PROGRAM, AIR MAJOR, DRINKING WATER SYSTEM Business SIC classification: CROP PREPARATION SERVICES FOR MARKET, EXCEPT COTTON GINNING Business NAICS classification: POSTHARVEST CROP ACTIVITIES (EXCEPT COTTON GINNING).; OTHER ANIMAL FOOD MANUFACTURING.
AMICK'S FARMS (FEED MILL) (3706 HWY 23 in MONETTA, SC)
National Pollutant Discharge Elimination System NON-MAJOR (Tracking pollutant discharge elimination systems) - permit Business SIC classification: PREPARED FEEDS AND FEED INGREDIENTS FOR ANIMALS AND FOWLS, EXCEPT DOGS AND CATS Alternative names: AMICK'S FEED MILL
Housing units lacking complete plumbing facilities: 5.5% Housing units lacking complete kitchen facilities: 3.4%
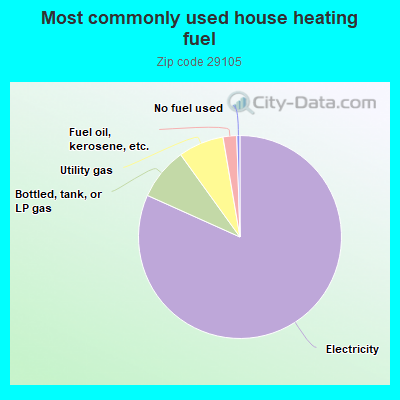
82.3%Electricity
8.4%Bottled, tank, or LP gas
7.3%Utility gas
2.2%Fuel oil, kerosene, etc.
0.5%No fuel used
Population in 1990: 2,068.
Place of birth for U.S.-born residents:
This state: 609
Northeast: 301
Midwest: 34
South: 256
West: 17
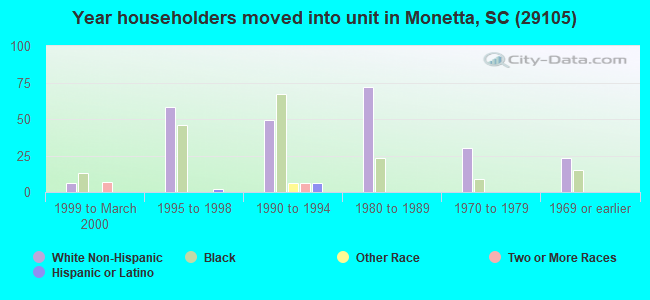
71% of the 29105 zip code residents lived in the same house 5 years ago. Out of people who lived in different houses, 31% lived in this county. Out of people who lived in different counties, 50% lived in South Carolina.
99% of the 29105 zip code residents lived in the same house 1 year ago. Out of people who lived in different houses, 100% moved from different county within same state.
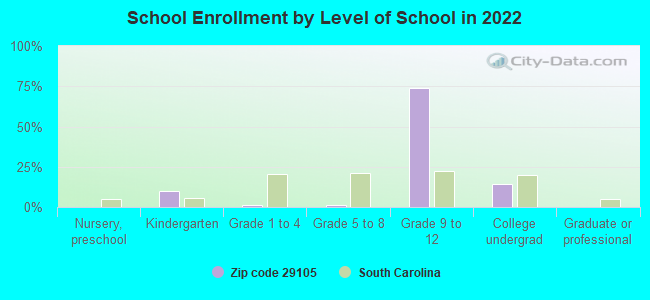
Private vs. public school enrollment:
Students in private schools in grades 1 to 8 (elementary and middle school): 1
Here:
39.1%
South Carolina:
14.4%
Students in private schools in grades 9 to 12 (high school): 21
Here:
30.7%
South Carolina:
11.1%
Students in private undergraduate colleges: 12
Here:
81.2%
South Carolina:
21.9%
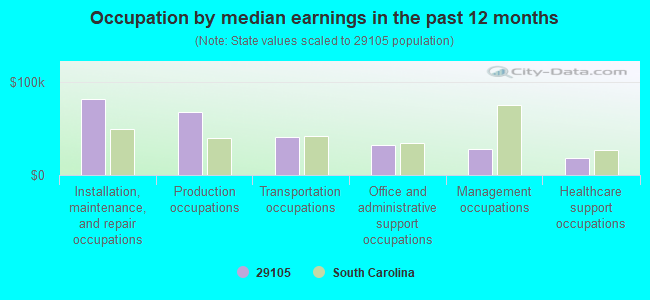
Occupation by median earnings in the past 12 months ($)
81,483Installation, maintenance, and repair occupations
67,905Production occupations
40,321Transportation occupations
32,182Office and administrative support occupations
27,956Management occupations
17,729Healthcare support occupations
Top industries in this zip code by the number of employees in 2005:
Other Services (except Public Administration): Religious Organizations (5-9 employees: 2 establishments, 1-4 employees: 1 establishment)
Construction: Plumbing, Heating, and Air-Conditioning Contractors (10-19: 1)
Other Services (except Public Administration): Automotive Body, Paint, and Interior Repair and Maintenance (5-9: 1)
Other Services (except Public Administration): Commercial and Industrial Machinery and Equipment (except Automotive and Electronic) Repair and Maintenance (1-4: 1)
People in group quarters in 2010:
20 people in workers' group living quarters and job corps centers
People in group quarters in 2000:
14 people in other nonhousehold living situations
Fatal accident statistics in 2013:
Fatal accident count: 1
Vehicles involved in fatal accidents: 1
Fatal accidents caused by drunken drivers: 1
Fatalities: 1
Persons involved in fatal accidents: 1
Pedestrians involved in fatal accidents: 0
Fatal accident statistics in 2012:
Fatal accident count: 1
Vehicles involved in fatal accidents: 2
Fatal accidents caused by drunken drivers: 1
Fatalities: 2
Persons involved in fatal accidents: 5
Pedestrians involved in fatal accidents: 0
Home Mortgage Disclosure Act Aggregated Statistics For Year 2009 (Based on 2 partial tracts)
A) FHA, FSA/RHS & VA Home Purchase Loans
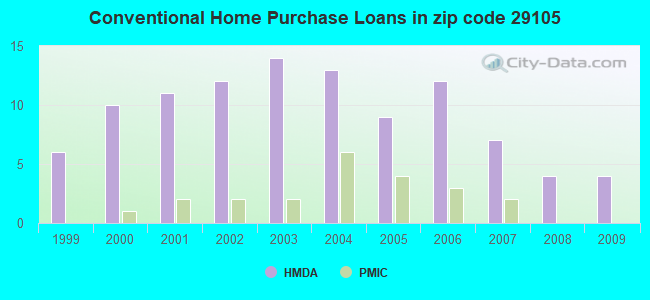
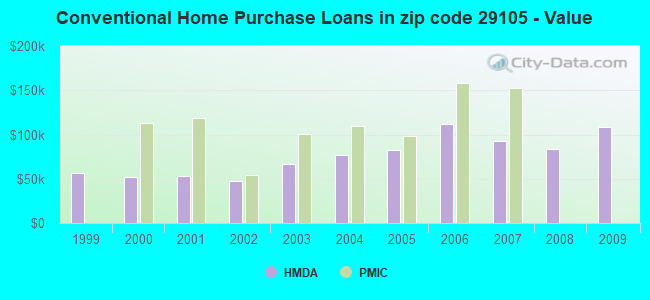
B) Conventional Home Purchase Loans
C) Refinancings
D) Home Improvement Loans
F) Non-occupant Loans on < 5 Family Dwellings (A B C & D)
G) Loans On Manufactured Home Dwelling (A B C & D)
Number
Average Value
Number
Average Value
Number
Average Value
Number
Average Value
Number
Average Value
Number
Average Value
LOANS ORIGINATED
2
$56,145
4
$108,105
14
$159,111
2
$101,900
1
$142,380
4
$47,150
APPLICATIONS APPROVED, NOT ACCEPTED
0
$0
0
$0
2
$177,435
0
$0
0
$0
0
$0
APPLICATIONS DENIED
0
$0
3
$79,203
7
$116,414
2
$38,775
0
$0
3
$69,277
APPLICATIONS WITHDRAWN
0
$0
1
$151,070
3
$202,250
0
$0
0
$0
1
$43,430
FILES CLOSED FOR INCOMPLETENESS
0
$0
0
$0
1
$412,570
0
$0
0
$0
0
$0
Aggregated Statistics For Year 2008 (Based on 2 partial tracts)
A) FHA, FSA/RHS & VA Home Purchase Loans
B) Conventional Home Purchase Loans
C) Refinancings
D) Home Improvement Loans
F) Non-occupant Loans on < 5 Family Dwellings (A B C & D)
G) Loans On Manufactured Home Dwelling (A B C & D)
Number
Average Value
Number
Average Value
Number
Average Value
Number
Average Value
Number
Average Value
Number
Average Value
LOANS ORIGINATED
2
$81,740
4
$83,445
9
$116,463
2
$54,130
2
$71,655
5
$54,596
APPLICATIONS APPROVED, NOT ACCEPTED
0
$0
2
$55,370
3
$85,720
1
$11,480
0
$0
2
$55,525
APPLICATIONS DENIED
0
$0
3
$100,297
10
$97,837
4
$71,422
1
$204,730
7
$55,969
APPLICATIONS WITHDRAWN
0
$0
1
$49,940
4
$75,845
1
$84,990
0
$0
1
$56,460
FILES CLOSED FOR INCOMPLETENESS
1
$77,860
0
$0
2
$61,265
0
$0
0
$0
0
$0
Aggregated Statistics For Year 2007 (Based on 2 partial tracts)
A) FHA, FSA/RHS & VA Home Purchase Loans
B) Conventional Home Purchase Loans
C) Refinancings
D) Home Improvement Loans
F) Non-occupant Loans on < 5 Family Dwellings (A B C & D)
G) Loans On Manufactured Home Dwelling (A B C & D)
Number
Average Value
Number
Average Value
Number
Average Value
Number
Average Value
Number
Average Value
Number
Average Value
LOANS ORIGINATED
1
$132,770
7
$92,750
19
$116,358
2
$10,545
3
$59,143
8
$52,036
APPLICATIONS APPROVED, NOT ACCEPTED
0
$0
2
$54,440
4
$128,190
1
$68,550
1
$49,940
3
$50,563
APPLICATIONS DENIED
0
$0
3
$56,560
12
$106,967
5
$27,236
0
$0
5
$51,370
APPLICATIONS WITHDRAWN
1
$54,600
1
$118,810
6
$96,213
1
$154,790
0
$0
2
$69,020
FILES CLOSED FOR INCOMPLETENESS
0
$0
0
$0
1
$75,070
0
$0
0
$0
0
$0
Aggregated Statistics For Year 2006 (Based on 2 partial tracts)
B) Conventional Home Purchase Loans
C) Refinancings
D) Home Improvement Loans
F) Non-occupant Loans on < 5 Family Dwellings (A B C & D)
G) Loans On Manufactured Home Dwelling (A B C & D)
Number
Average Value
Number
Average Value
Number
Average Value
Number
Average Value
Number
Average Value
LOANS ORIGINATED
12
$111,801
14
$69,972
3
$47,150
3
$87,993
7
$55,747
APPLICATIONS APPROVED, NOT ACCEPTED
2
$31,330
5
$92,936
1
$20,160
0
$0
2
$23,730
APPLICATIONS DENIED
6
$80,393
19
$75,036
4
$26,755
1
$51,490
9
$62,937
APPLICATIONS WITHDRAWN
2
$57,695
6
$108,312
2
$42,650
0
$0
0
$0
FILES CLOSED FOR INCOMPLETENESS
0
$0
2
$117,565
0
$0
0
$0
0
$0
Aggregated Statistics For Year 2005 (Based on 2 partial tracts)
A) FHA, FSA/RHS & VA Home Purchase Loans
B) Conventional Home Purchase Loans
C) Refinancings
D) Home Improvement Loans
F) Non-occupant Loans on < 5 Family Dwellings (A B C & D)
G) Loans On Manufactured Home Dwelling (A B C & D)
Number
Average Value
Number
Average Value
Number
Average Value
Number
Average Value
Number
Average Value
Number
Average Value
LOANS ORIGINATED
2
$81,895
9
$82,444
12
$118,807
3
$16,543
1
$7,750
8
$57,736
APPLICATIONS APPROVED, NOT ACCEPTED
0
$0
2
$100,815
3
$126,457
0
$0
0
$0
2
$44,980
APPLICATIONS DENIED
0
$0
7
$65,940
19
$88,717
4
$47,848
1
$175,260
12
$54,750
APPLICATIONS WITHDRAWN
0
$0
1
$127,490
7
$93,769
1
$57,080
1
$60,490
2
$65,915
FILES CLOSED FOR INCOMPLETENESS
0
$0
1
$46,530
3
$134,730
0
$0
0
$0
1
$42,190
Aggregated Statistics For Year 2004 (Based on 2 partial tracts)
A) FHA, FSA/RHS & VA Home Purchase Loans
B) Conventional Home Purchase Loans
C) Refinancings
D) Home Improvement Loans
F) Non-occupant Loans on < 5 Family Dwellings (A B C & D)
G) Loans On Manufactured Home Dwelling (A B C & D)
Number
Average Value
Number
Average Value
Number
Average Value
Number
Average Value
Number
Average Value
Number
Average Value
LOANS ORIGINATED
2
$69,330
13
$76,643
17
$90,268
2
$18,455
0
$0
11
$48,419
APPLICATIONS APPROVED, NOT ACCEPTED
0
$0
2
$39,240
5
$66,506
1
$29,470
0
$0
3
$55,320
APPLICATIONS DENIED
0
$0
6
$31,743
16
$69,408
5
$18,922
0
$0
9
$46,151
APPLICATIONS WITHDRAWN
0
$0
1
$273,910
7
$94,966
1
$27,300
1
$132,770
1
$56,150
FILES CLOSED FOR INCOMPLETENESS
0
$0
1
$42,190
2
$118,805
1
$25,750
0
$0
1
$29,780
Aggregated Statistics For Year 2003 (Based on 2 partial tracts)
A) FHA, FSA/RHS & VA Home Purchase Loans
B) Conventional Home Purchase Loans
C) Refinancings
D) Home Improvement Loans
F) Non-occupant Loans on < 5 Family Dwellings (A B C & D)
Number
Average Value
Number
Average Value
Number
Average Value
Number
Average Value
Number
Average Value
LOANS ORIGINATED
1
$106,710
14
$66,250
29
$82,823
1
$24,820
2
$55,835
APPLICATIONS APPROVED, NOT ACCEPTED
0
$0
4
$34,432
8
$90,151
1
$36,600
0
$0
APPLICATIONS DENIED
0
$0
16
$33,870
32
$81,893
1
$19,230
0
$0
APPLICATIONS WITHDRAWN
0
$0
2
$52,735
15
$97,423
0
$0
0
$0
FILES CLOSED FOR INCOMPLETENESS
0
$0
0
$0
7
$126,650
0
$0
0
$0
Aggregated Statistics For Year 2002 (Based on 2 partial tracts)
A) FHA, FSA/RHS & VA Home Purchase Loans
B) Conventional Home Purchase Loans
C) Refinancings
D) Home Improvement Loans
F) Non-occupant Loans on < 5 Family Dwellings (A B C & D)
Number
Average Value
Number
Average Value
Number
Average Value
Number
Average Value
Number
Average Value
LOANS ORIGINATED
0
$0
12
$47,512
26
$82,489
1
$23,890
2
$97,560
APPLICATIONS APPROVED, NOT ACCEPTED
0
$0
4
$33,270
6
$68,865
0
$0
0
$0
APPLICATIONS DENIED
1
$57,080
19
$37,567
24
$67,637
2
$7,755
3
$42,703
APPLICATIONS WITHDRAWN
0
$0
1
$78,480
8
$67,740
1
$18,610
0
$0
FILES CLOSED FOR INCOMPLETENESS
0
$0
0
$0
3
$83,753
0
$0
0
$0
Aggregated Statistics For Year 2001 (Based on 2 partial tracts)
A) FHA, FSA/RHS & VA Home Purchase Loans
B) Conventional Home Purchase Loans
C) Refinancings
D) Home Improvement Loans
F) Non-occupant Loans on < 5 Family Dwellings (A B C & D)
Number
Average Value
Number
Average Value
Number
Average Value
Number
Average Value
Number
Average Value
LOANS ORIGINATED
2
$55,525
11
$53,016
18
$81,858
2
$17,990
0
$0
APPLICATIONS APPROVED, NOT ACCEPTED
0
$0
8
$41,605
2
$55,680
0
$0
1
$42,500
APPLICATIONS DENIED
0
$0
18
$44,324
19
$65,795
2
$31,020
1
$54,600
APPLICATIONS WITHDRAWN
0
$0
2
$78,480
8
$76,502
0
$0
0
$0
FILES CLOSED FOR INCOMPLETENESS
0
$0
0
$0
2
$114,155
0
$0
0
$0
Aggregated Statistics For Year 2000 (Based on 2 partial tracts)
A) FHA, FSA/RHS & VA Home Purchase Loans
B) Conventional Home Purchase Loans
C) Refinancings
D) Home Improvement Loans
F) Non-occupant Loans on < 5 Family Dwellings (A B C & D)
Number
Average Value
Number
Average Value
Number
Average Value
Number
Average Value
Number
Average Value
LOANS ORIGINATED
1
$75,380
10
$51,555
7
$58,850
2
$7,135
2
$31,950
APPLICATIONS APPROVED, NOT ACCEPTED
1
$45,290
5
$37,224
3
$37,223
1
$14,270
0
$0
APPLICATIONS DENIED
1
$23,580
30
$38,372
15
$51,679
4
$14,735
1
$29,470
APPLICATIONS WITHDRAWN
1
$60,180
1
$74,760
6
$42,808
1
$5,890
0
$0
FILES CLOSED FOR INCOMPLETENESS
0
$0
0
$0
3
$48,390
0
$0
0
$0
Aggregated Statistics For Year 1999 (Based on 1 partial tract)
B) Conventional Home Purchase Loans
C) Refinancings
D) Home Improvement Loans
F) Non-occupant Loans on < 5 Family Dwellings (A B C & D)
Detailed PMIC statistics for the following Tracts:0201.00
2002 - 2018 National Fire Incident Reporting System (NFIRS) incidents
Based on the data from the years 2002 - 2018 the average number of fire incidents per year is 22. The highest number of fire incidents - 70 took place in 2010, and the least - 2 in 2003. The data has a rising trend.
When looking into fire subcategories, the most reports belonged to: Outside Fires (47.2%), and Structure Fires (36.5%).
Fire incident types reported to NFIRS in Zip Code 29105


 Nearest zip codes: 29006, 29129, 29166, 29805, 29070, 29832.


 Based on the data from the years 2002 - 2018 the average number of fire incidents per year is 22. The highest number of fire incidents - 70 took place in 2010, and the least - 2 in 2003. The data has a rising trend.
 When looking into fire subcategories, the most reports belonged to: Outside Fires (47.2%), and Structure Fires (36.5%).