Estimated zip code population in 2022: 1,498 Zip code population in 2010: 2,190 Zip code population in 2000: 2,327
Houses and condos: 790 Renter-occupied apartments: 79
% of renters here:
14%
State:
28%
March 2022 cost of living index in zip code 29114: 79.1 (low, U.S. average is 100)
Land area: 37.1 sq. mi. Water area: 0.0 sq. mi.
Population density: 40 people per square mile
(very low).
OSM Map
General Map
Google Map
MSN Map
OSM Map
General Map
Google Map
MSN Map
OSM Map
General Map
Google Map
MSN Map
OSM Map
General Map
Google Map
MSN Map
Please wait while loading the map...
Real estate property taxes paid for housing units in 2022:
This zip code:
0.3% ($349)
South Carolina:
0.5% ($1,185)
Median real estate property taxes paid for housing units with mortgages in 2022: $304 (0.3%) Median real estate property taxes paid for housing units with no mortgage in 2022: $375 (0.3%)
Business Search- 14 Million verified businesses
Males: 658
(43.9%)
Females: 840
(56.1%)
For population 25 years and over in 29114:
High school or higher: 80.0%
Bachelor's degree or higher: 11.7%
Graduate or professional degree: 3.0%
Unemployed: 3.7%
Mean travel time to work (commute): 28.8 minutes
For population 15 years and over in 29114:
Never married: 30.8%
Now married: 51.6%
Separated: 3.0%
Widowed: 10.7%
Divorced: 4.0%
Zip code 29114 compared to state average:
Median house value significantly below state average.
Black race population percentage above state average.
Hispanic race population percentage significantly below state average.
Median age significantly above state average.
Foreign-born population percentage significantly below state average.
Renting percentage below state average.
Length of stay since moving in significantly above state average.
Percentage of population with a bachelor's degree or higher significantly below state average.
Estimated median house/condo value in 2022: $112,344
29114:
$112,344
South Carolina:
$254,600
Median resident age:
This zip code:
55.1 years
South Carolina median age:
40.5 years
Average household size:
This zip code:
2.6 people
South Carolina:
2.4 people
Averages for the 2020 tax year for zip code 29114, filed in 2021:
Average Adjusted Gross Income (AGI) in 2020: $36,344 (Individual Income Tax Returns)
Here:
$36,344
State:
$65,754
Salary/wage: $34,740 (reported on 85.7% of returns)
Here:
$34,740
State:
$52,566
(% of AGI for various income ranges: 1300.6% for AGIs below $25k, 4294.4% for AGIs $25k-50k, 8326.7% for AGIs $50k-75k, 11336.7% for AGIs $75k-100k, 28565.0% for AGIs $100k-200k)
Taxable interest for individuals: $373 (reported on 13.1% of returns)
This zip code:
$373
South Carolina:
$1,749
(% of AGI for various income ranges: 5.8% for AGIs below $25k, 5.0% for AGIs $25k-50k, 50.0% for AGIs $75k-100k)
Ordinary dividends: $1,533 (reported on 7.1% of returns)
Here:
$1,533
State:
$8,783
(% of AGI for various income ranges: 19.0% for AGIs below $25k, 55.0% for AGIs $50k-75k)
Net capital gain/loss in AGI: +$6,400 (reported on 4.8% of returns)
Here:
+$6,400
State:
+$24,194
(% of AGI for various income ranges: 160.0% for AGIs $25k-50k)
Profit/loss from business: +$4,346 (reported on 15.5% of returns)
Here:
+$4,346
State:
+$11,253
(% of AGI for various income ranges: 87.4% for AGIs below $25k, 645.0% for AGIs $50k-75k)
Taxable individual retirement arrangement distribution: $7,100 (reported on 4.8% of returns)
29114:
$7,100
South Carolina:
$21,604
(% of AGI for various income ranges: 91.6% for AGIs below $25k)
Earned income credit: $2,680 (reported on 35.7% of returns)
Here:
$2,680
State:
$2,397
(% of AGI for various income ranges: 193.2% for AGIs below $25k, 128.1% for AGIs $25k-50k)
Percentage of individuals using paid preparers for their 2020 taxes: 94.0%
Here:
94%
State:
93%
(% for various income ranges: 92.7% for AGIs below $25k, 95.7% for AGIs $25k-50k, 90.0% for AGIs $50k-75k, 100.0% for AGIs $75k-100k, 100.0% for AGIs $100k-200k)
Averages for the 2012 tax year for zip code 29114, filed in 2013:
Average Adjusted Gross Income (AGI) in 2012: $30,251 (Individual Income Tax Returns)
Here:
$30,251
State:
$51,133
Salary/wage: $28,206 (reported on 84.7% of returns)
Here:
$28,206
State:
$42,173
(% of AGI for various income ranges: 82.1% for AGIs below $25k, 86.3% for AGIs $25k-50k, 78.5% for AGIs $50k-75k, 78.2% for AGIs $75k-100k, 66.6% for AGIs $100k-200k)
Taxable interest for individuals: $1,086 (reported on 16.5% of returns)
This zip code:
$1,086
South Carolina:
$1,468
(% of AGI for various income ranges: 0.6% for AGIs below $25k, 0.3% for AGIs $25k-50k, 0.4% for AGIs $50k-75k, 2.7% for AGIs $75k-100k)
Ordinary dividends: $1,286 (reported on 8.2% of returns)
Here:
$1,286
State:
$6,511
Net capital gain/loss in AGI: +$6,733 (reported on 7.1% of returns)
Here:
+$6,733
State:
+$13,061
Profit/loss from business: +$5,613 (reported on 17.6% of returns)
Here:
+$5,613
State:
+$10,167
(% of AGI for various income ranges: 8.4% for AGIs below $25k, 6.2% for AGIs $50k-75k)
Taxable individual retirement arrangement distribution: $6,725 (reported on 4.7% of returns)
29114:
$6,725
South Carolina:
$17,019
Total itemized deductions: $19,783 (27% of AGI, reported on 14.1% of returns)
Here:
$19,783
State:
$22,890
Here:
27.2% of AGI
State:
21.4% of AGI
(% of AGI for various income ranges: 11.9% for AGIs $25k-50k, 19.0% for AGIs $50k-75k, 14.4% for AGIs $100k-200k)
Charity contributions: $5,100 (reported on 11.8% of returns)
Here:
$5,100
State:
$5,169
(% of AGI for various income ranges: 2.1% for AGIs $25k-50k, 3.9% for AGIs $50k-75k, 3.8% for AGIs $100k-200k)
Taxes paid: $4,425 (reported on 14.1% of returns)
29114:
$4,425
State:
$7,644
(% of AGI for various income ranges: 1.6% for AGIs $25k-50k, 4.1% for AGIs $50k-75k, 4.6% for AGIs $100k-200k)
Earned income credit: $2,808 (reported on 43.5% of returns)
Here:
$2,808
State:
$2,418
(% of AGI for various income ranges: 13.5% for AGIs below $25k, 1.9% for AGIs $25k-50k)
Percentage of individuals using paid preparers for their 2012 taxes: 64.7%
Here:
65%
State:
57%
(% for various income ranges: 63.5% for AGIs below $25k, 61.1% for AGIs $25k-50k, 75.0% for AGIs $50k-75k, 66.7% for AGIs $75k-100k, 75.0% for AGIs $100k-200k)
Averages for the 2004 tax year for zip code 29114, filed in 2005:
Average Adjusted Gross Income (AGI) in 2004: $25,184 (Individual Income Tax Returns)
Here:
$25,184
State:
$41,965
Salary/wage: $23,867 (reported on 88.9% of returns)
Here:
$23,867
State:
$35,695
(% of AGI for various income ranges: 102.1% for AGIs below $10k, 89.9% for AGIs $10k-25k, 86.2% for AGIs $25k-50k, 82.3% for AGIs $50k-75k, 73.6% for AGIs $75k-100k, 64.5% for AGIs over 100k)
Taxable interest for individuals: $1,500 (reported on 18.8% of returns)
This zip code:
$1,500
South Carolina:
$1,623
(% of AGI for various income ranges: 1.5% for AGIs below $10k, 1.1% for AGIs $10k-25k, 1.3% for AGIs $25k-50k, 0.7% for AGIs $50k-75k, 1.1% for AGIs $75k-100k, 1.1% for AGIs over 100k)
Taxable dividends: $943 (reported on 7.7% of returns)
Here:
$943
State:
$3,999
Net capital gain/loss: +$286 (reported on 5.4% of returns)
Here:
+$286
State:
+$13,100
Profit/loss from business: +$2,930 (reported on 15.8% of returns)
Here:
+$2,930
State:
+$9,144
(% of AGI for various income ranges: 14.4% for AGIs below $10k, 1.9% for AGIs $10k-25k, 1.7% for AGIs $25k-50k, 0.8% for AGIs $50k-75k)
Profit/loss from farming: +$83 (reported on 1.3% of returns)
Here:
+$83
State:
-$4,882
Total itemized deductions: $13,909 (27% of AGI, reported on 18.2% of returns)
Here:
$13,909
State:
$19,039
Here:
26.8% of AGI
State:
22.8% of AGI
(% of AGI for various income ranges: 6.5% for AGIs $10k-25k, 10.2% for AGIs $25k-50k, 13.3% for AGIs $50k-75k, 14.6% for AGIs $75k-100k, 13.1% for AGIs over 100k)
Charity contributions deductions: $3,098 (6% of AGI, reported on 16.9% of returns)
Here:
$3,098
State:
$4,305
Here:
6.0% of AGI
State:
5.0% of AGI
(% of AGI for various income ranges: 1.1% for AGIs $10k-25k, 2.2% for AGIs $25k-50k, 3.1% for AGIs $50k-75k, 2.8% for AGIs $75k-100k, 2.3% for AGIs over 100k)
Total tax: $2,938 (reported on 55.3% of returns)
29114:
$2,938
State:
$6,497
(% of AGI for various income ranges: 3.4% for AGIs below $10k, 2.5% for AGIs $10k-25k, 5.5% for AGIs $25k-50k, 8.4% for AGIs $50k-75k, 10.0% for AGIs $75k-100k, 16.0% for AGIs over 100k)
Earned income credit: $2,106 (reported on 45.8% of returns)
Here:
$2,106
State:
$1,882
Percentage of individuals using paid preparers for their 2004 taxes: 74.2%
Here:
74%
State:
66%
(% for various income ranges: 70.9% for AGIs below $10k, 74.6% for AGIs $10k-25k, 76.9% for AGIs $25k-50k, 70.7% for AGIs $50k-75k, 119.2% for AGIs $75k-100k)
Household received Food Stamps/SNAP in the past 12 months: 132 Household did not receive Food Stamps/SNAP in the past 12 months: 450
Women who had a birth in the past 12 months: 8 (2 now married, 5 unmarried) Women who did not have a birth in the past 12 months: 320 (87 now married, 230 unmarried)
Housing units in zip code 29114 with a mortgage: 230 Median monthly owner costs for units with a mortgage: $1,080 Median monthly owner costs for units without a mortgage: $379
Residents with income below the poverty level in 2022:
This zip code:
11.2%
Whole state:
14.0%
Residents with income below 50% of the poverty level in 2022:
This zip code:
4.9%
Whole state:
7.3%
Median number of rooms in houses and condos:
Here:
6.0
State:
6.4
Median number of rooms in apartments:
Here:
5.4
State:
4.5
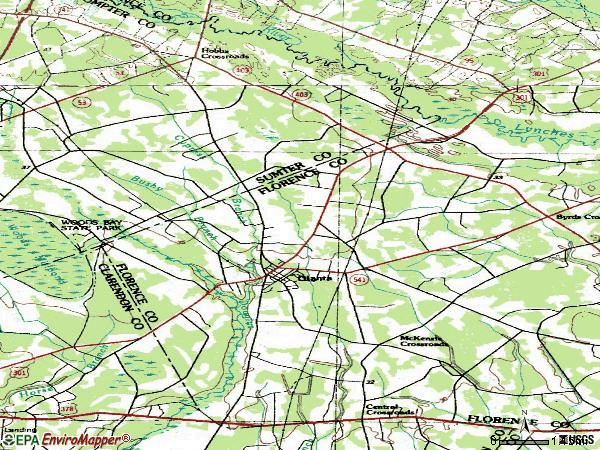
Notable locations in this zip code not listed on our city pages
Notable locations in zip code 29114: Olanta Public Library (A), Olanta Rural Fire Department (B), Olanta Police Department (C). Display/hide their locations on the map
Churches in zip code 29114 include: Olanta Presbyterian Church (A), Jordan Chapel Baptist Church (B), Olanta First Pentecostal Holiness Church (C), Beulah Mission Church (D), Zion Church (E), Saint Mark Church (F), Aimwell Church (G). Display/hide their locations on the map
In group quarters: 3 (-1 institutionalized population)
Size of family households: 260 2-persons, 82 3-persons, 56 4-persons, 22 5-persons, 14 6-persons, 10 7-or-more-persons
Size of nonfamily households: 124 1-person, 12 2-persons
95 married couples with children.
60 single-parent households (1 men, 59 women).
99.6% of residents of 29114 zip code speak English at home.
0.3% of residents speak Asian or Pacific Island language at home (100% not well).
Foreign born population: 0 (0.0%)
:
0.0%
Whole state:
5.2%
10%American
4%English
3%African
1%Irish
1%Welsh
0%Scottish
0%Scotch-Irish
Housing units lacking complete plumbing facilities: 8.4% Housing units lacking complete kitchen facilities: 9.6%
79.5%Electricity
13.5%Bottled, tank, or LP gas
4.7%Utility gas
2.6%Wood
Population in 1990: 2,415.
Place of birth for U.S.-born residents:
This state: 1,280
Northeast: 97
Midwest: 15
South: 75
75% of the 29114 zip code residents lived in the same house 5 years ago. Out of people who lived in different houses, 63% lived in this county. Out of people who lived in different counties, 50% lived in South Carolina.
96% of the 29114 zip code residents lived in the same house 1 year ago. Out of people who lived in different houses, 40% moved from this county. Out of people who lived in different houses, 21% moved from different county within same state. Out of people who lived in different houses, 31% moved from abroad.
Private vs. public school enrollment:
Students in private schools in grades 1 to 8 (elementary and middle school): 26
Here:
28.0%
South Carolina:
14.4%
Students in private schools in grades 9 to 12 (high school): 19
Here:
14.3%
South Carolina:
11.1%
Students in private undergraduate colleges:
Here:
0.0%
South Carolina:
21.9%
Occupation by median earnings in the past 12 months ($)
78,091Health diagnosing and treating practitioners and other technical occupations
71,851Management occupations
70,945Fire fighting and prevention, and other protective service workers including supervisors
61,489Transportation occupations
60,323Computer and mathematical occupations
42,780Installation, maintenance, and repair occupations
Top industries in this zip code by the number of employees in 2005:
Health Care and Social Assistance: Homes for the Elderly (20-49 employees: 1 establishment)
Finance and Insurance: Commercial Banking (10-19: 1)
Other Services (except Public Administration): Religious Organizations (5-9: 1, 1-4: 1)
Wholesale Trade: Grain and Field Bean Merchant Wholesalers (5-9: 1)
Educational Services: Fine Arts Schools (5-9: 1)
People in group quarters in 2000:
96 people in other noninstitutional group quarters
8 people in homes for the mentally retarded
Fatal accident statistics in 2014:
Fatal accident count: 1
Vehicles involved in fatal accidents: 2
Fatal accidents caused by drunken drivers: 1
Fatalities: 1
Persons involved in fatal accidents: 5
Pedestrians involved in fatal accidents: 0
Home Mortgage Disclosure Act Aggregated Statistics For Year 2009 (Based on 4 partial tracts)
A) FHA, FSA/RHS & VA Home Purchase Loans
B) Conventional Home Purchase Loans
C) Refinancings
D) Home Improvement Loans
F) Non-occupant Loans on < 5 Family Dwellings (A B C & D)
G) Loans On Manufactured Home Dwelling (A B C & D)
Number
Average Value
Number
Average Value
Number
Average Value
Number
Average Value
Number
Average Value
Number
Average Value
LOANS ORIGINATED
6
$82,402
12
$67,198
31
$117,574
18
$14,912
8
$42,398
15
$30,479
APPLICATIONS APPROVED, NOT ACCEPTED
0
$0
1
$51,400
2
$109,015
0
$0
1
$51,400
1
$51,400
APPLICATIONS DENIED
2
$134,520
5
$67,912
15
$110,894
5
$26,586
0
$0
4
$31,278
APPLICATIONS WITHDRAWN
1
$45,600
1
$115,230
11
$103,295
0
$0
0
$0
1
$70,470
FILES CLOSED FOR INCOMPLETENESS
2
$107,355
0
$0
3
$136,777
0
$0
0
$0
0
$0
Aggregated Statistics For Year 2008 (Based on 4 partial tracts)
A) FHA, FSA/RHS & VA Home Purchase Loans
B) Conventional Home Purchase Loans
C) Refinancings
D) Home Improvement Loans
F) Non-occupant Loans on < 5 Family Dwellings (A B C & D)
G) Loans On Manufactured Home Dwelling (A B C & D)
Number
Average Value
Number
Average Value
Number
Average Value
Number
Average Value
Number
Average Value
Number
Average Value
LOANS ORIGINATED
4
$92,158
13
$64,282
30
$92,929
18
$31,507
11
$38,866
17
$37,096
APPLICATIONS APPROVED, NOT ACCEPTED
0
$0
2
$51,400
5
$90,044
1
$7,460
1
$79,120
2
$63,420
APPLICATIONS DENIED
2
$140,510
14
$51,705
36
$91,220
11
$31,602
1
$66,420
14
$47,086
APPLICATIONS WITHDRAWN
0
$0
0
$0
11
$120,068
0
$0
0
$0
0
$0
FILES CLOSED FOR INCOMPLETENESS
1
$81,240
1
$62,180
1
$142,300
0
$0
0
$0
1
$53,590
Aggregated Statistics For Year 2007 (Based on 4 partial tracts)
B) Conventional Home Purchase Loans
C) Refinancings
D) Home Improvement Loans
E) Loans on Dwellings For 5+ Families
F) Non-occupant Loans on < 5 Family Dwellings (A B C & D)
G) Loans On Manufactured Home Dwelling (A B C & D)
Number
Average Value
Number
Average Value
Number
Average Value
Number
Average Value
Number
Average Value
Number
Average Value
LOANS ORIGINATED
20
$75,596
31
$90,776
18
$23,421
0
$0
9
$44,568
10
$42,492
APPLICATIONS APPROVED, NOT ACCEPTED
6
$70,337
3
$128,423
1
$67,520
0
$0
0
$0
3
$86,513
APPLICATIONS DENIED
28
$81,057
37
$88,339
9
$16,930
0
$0
3
$86,253
14
$48,254
APPLICATIONS WITHDRAWN
4
$106,055
15
$107,109
0
$0
2
$161,655
0
$0
0
$0
FILES CLOSED FOR INCOMPLETENESS
3
$91,743
2
$260,300
0
$0
0
$0
0
$0
0
$0
Aggregated Statistics For Year 2006 (Based on 4 partial tracts)
A) FHA, FSA/RHS & VA Home Purchase Loans
B) Conventional Home Purchase Loans
C) Refinancings
D) Home Improvement Loans
F) Non-occupant Loans on < 5 Family Dwellings (A B C & D)
G) Loans On Manufactured Home Dwelling (A B C & D)
Number
Average Value
Number
Average Value
Number
Average Value
Number
Average Value
Number
Average Value
Number
Average Value
LOANS ORIGINATED
2
$119,790
21
$59,439
41
$70,153
19
$14,527
10
$71,465
24
$25,156
APPLICATIONS APPROVED, NOT ACCEPTED
0
$0
2
$67,565
5
$81,816
1
$13,260
1
$58,860
2
$38,135
APPLICATIONS DENIED
1
$69,860
27
$53,230
43
$72,362
11
$14,135
3
$47,340
19
$39,645
APPLICATIONS WITHDRAWN
0
$0
4
$65,410
20
$92,634
0
$0
0
$0
4
$43,932
FILES CLOSED FOR INCOMPLETENESS
0
$0
1
$181,320
4
$110,840
0
$0
1
$61,950
0
$0
Aggregated Statistics For Year 2005 (Based on 4 partial tracts)
A) FHA, FSA/RHS & VA Home Purchase Loans
B) Conventional Home Purchase Loans
C) Refinancings
D) Home Improvement Loans
F) Non-occupant Loans on < 5 Family Dwellings (A B C & D)
G) Loans On Manufactured Home Dwelling (A B C & D)
Number
Average Value
Number
Average Value
Number
Average Value
Number
Average Value
Number
Average Value
Number
Average Value
LOANS ORIGINATED
3
$67,427
32
$59,408
43
$72,079
13
$16,382
16
$51,094
27
$29,521
APPLICATIONS APPROVED, NOT ACCEPTED
1
$55,850
5
$84,494
13
$53,787
2
$12,435
0
$0
5
$49,240
APPLICATIONS DENIED
2
$65,905
27
$54,872
44
$77,870
10
$22,603
0
$0
25
$44,505
APPLICATIONS WITHDRAWN
0
$0
6
$63,053
16
$88,958
2
$53,115
0
$0
3
$41,677
FILES CLOSED FOR INCOMPLETENESS
0
$0
0
$0
6
$96,743
0
$0
1
$59,690
1
$49,740
Aggregated Statistics For Year 2004 (Based on 4 partial tracts)
A) FHA, FSA/RHS & VA Home Purchase Loans
B) Conventional Home Purchase Loans
C) Refinancings
D) Home Improvement Loans
F) Non-occupant Loans on < 5 Family Dwellings (A B C & D)
G) Loans On Manufactured Home Dwelling (A B C & D)
Number
Average Value
Number
Average Value
Number
Average Value
Number
Average Value
Number
Average Value
Number
Average Value
LOANS ORIGINATED
2
$98,085
37
$47,785
59
$75,416
23
$15,533
14
$39,574
39
$34,541
APPLICATIONS APPROVED, NOT ACCEPTED
0
$0
8
$47,688
11
$62,639
2
$26,565
0
$0
7
$46,654
APPLICATIONS DENIED
0
$0
24
$55,042
39
$76,520
12
$30,582
1
$80,130
17
$42,285
APPLICATIONS WITHDRAWN
0
$0
4
$75,800
12
$76,796
1
$38,130
1
$47,940
4
$36,028
FILES CLOSED FOR INCOMPLETENESS
0
$0
2
$97,820
4
$74,818
1
$24,870
0
$0
2
$92,850
Aggregated Statistics For Year 2003 (Based on 4 partial tracts)
A) FHA, FSA/RHS & VA Home Purchase Loans
B) Conventional Home Purchase Loans
C) Refinancings
D) Home Improvement Loans
E) Loans on Dwellings For 5+ Families
F) Non-occupant Loans on < 5 Family Dwellings (A B C & D)
Number
Average Value
Number
Average Value
Number
Average Value
Number
Average Value
Number
Average Value
Number
Average Value
LOANS ORIGINATED
1
$64,930
30
$54,941
53
$71,594
9
$15,283
2
$25,700
8
$34,526
APPLICATIONS APPROVED, NOT ACCEPTED
1
$81,240
7
$53,037
13
$62,162
1
$124,350
0
$0
0
$0
APPLICATIONS DENIED
2
$46,500
30
$51,242
68
$68,180
4
$22,140
0
$0
4
$49,948
APPLICATIONS WITHDRAWN
1
$53,890
2
$71,235
18
$69,201
0
$0
0
$0
0
$0
FILES CLOSED FOR INCOMPLETENESS
0
$0
1
$169,120
2
$81,200
0
$0
0
$0
0
$0
Aggregated Statistics For Year 2002 (Based on 2 partial tracts)
A) FHA, FSA/RHS & VA Home Purchase Loans
B) Conventional Home Purchase Loans
C) Refinancings
D) Home Improvement Loans
F) Non-occupant Loans on < 5 Family Dwellings (A B C & D)
Number
Average Value
Number
Average Value
Number
Average Value
Number
Average Value
Number
Average Value
LOANS ORIGINATED
0
$0
5
$42,196
10
$52,822
3
$15,193
1
$11,400
APPLICATIONS APPROVED, NOT ACCEPTED
0
$0
2
$44,660
2
$48,510
0
$0
0
$0
APPLICATIONS DENIED
1
$38,190
10
$42,843
10
$55,471
2
$9,700
0
$0
APPLICATIONS WITHDRAWN
0
$0
0
$0
4
$63,448
0
$0
0
$0
FILES CLOSED FOR INCOMPLETENESS
0
$0
0
$0
1
$15,090
0
$0
0
$0
Aggregated Statistics For Year 2001 (Based on 2 partial tracts)
B) Conventional Home Purchase Loans
C) Refinancings
D) Home Improvement Loans
F) Non-occupant Loans on < 5 Family Dwellings (A B C & D)
Number
Average Value
Number
Average Value
Number
Average Value
Number
Average Value
LOANS ORIGINATED
6
$50,512
4
$78,770
3
$5,647
2
$64,990
APPLICATIONS APPROVED, NOT ACCEPTED
3
$31,417
4
$37,115
0
$0
0
$0
APPLICATIONS DENIED
15
$37,412
12
$48,177
1
$32,650
1
$68,070
APPLICATIONS WITHDRAWN
1
$31,420
3
$36,447
0
$0
0
$0
FILES CLOSED FOR INCOMPLETENESS
0
$0
1
$42,500
0
$0
0
$0
Aggregated Statistics For Year 2000 (Based on 2 partial tracts)
B) Conventional Home Purchase Loans
C) Refinancings
D) Home Improvement Loans
F) Non-occupant Loans on < 5 Family Dwellings (A B C & D)
Number
Average Value
Number
Average Value
Number
Average Value
Number
Average Value
LOANS ORIGINATED
11
$229,516
8
$47,894
2
$12,010
2
$30,185
APPLICATIONS APPROVED, NOT ACCEPTED
6
$36,190
2
$45,430
0
$0
0
$0
APPLICATIONS DENIED
24
$34,637
14
$38,302
3
$23,510
2
$22,945
APPLICATIONS WITHDRAWN
0
$0
3
$63,757
1
$9,240
0
$0
FILES CLOSED FOR INCOMPLETENESS
0
$0
1
$39,120
0
$0
0
$0
Aggregated Statistics For Year 1999 (Based on 2 partial tracts)
A) FHA, FSA/RHS & VA Home Purchase Loans
B) Conventional Home Purchase Loans
C) Refinancings
D) Home Improvement Loans
F) Non-occupant Loans on < 5 Family Dwellings (A B C & D)


+$83
-$4,882
 Nearest zip codes: 29162, 29161, 29080, 29591, 29111, 29518.