Estimated zip code population in 2022: 3,513 Zip code population in 2010: 4,122 Zip code population in 2000: 2,675
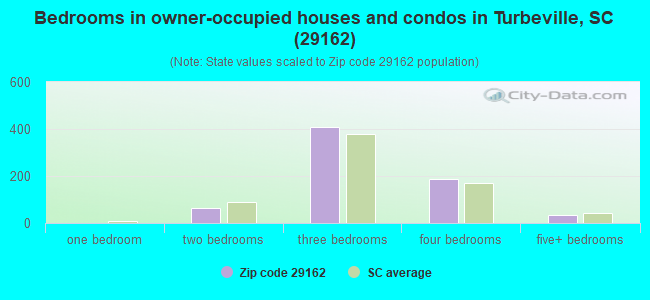
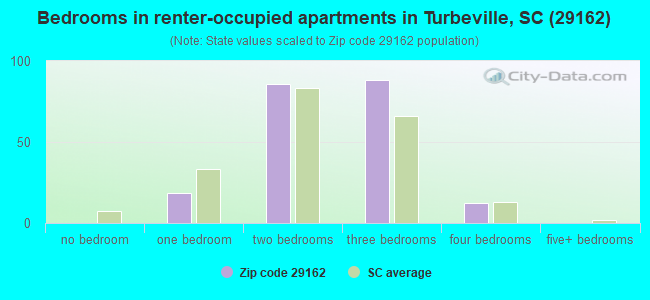
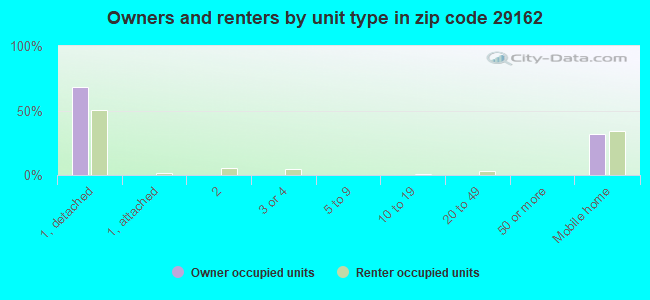
Houses and condos: 1,017 Renter-occupied apartments: 206
% of renters here:
23%
State:
28%
March 2022 cost of living index in zip code 29162: 79.3 (low, U.S. average is 100)
Land area: 33.5 sq. mi. Water area: 0.0 sq. mi.
Population density: 105 people per square mile
(very low).
OSM Map
General Map
Google Map
MSN Map
OSM Map
General Map
Google Map
MSN Map
OSM Map
General Map
Google Map
MSN Map
OSM Map
General Map
Google Map
MSN Map
Please wait while loading the map...
Real estate property taxes paid for housing units in 2022:
This zip code:
0.5% ($829)
South Carolina:
0.5% ($1,185)
Median real estate property taxes paid for housing units with mortgages in 2022: $1,157 (0.4%) Median real estate property taxes paid for housing units with no mortgage in 2022: $487 (0.4%)
Business Search- 14 Million verified businesses
Males: 2,289
(65.2%)
Females: 1,219
(34.8%)
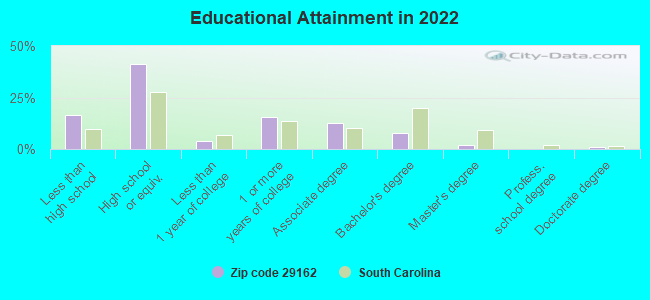
For population 25 years and over in 29162:
High school or higher: 81.0%
Bachelor's degree or higher: 10.2%
Graduate or professional degree: 2.8%
Unemployed: 5.0%
Mean travel time to work (commute): 30.8 minutes
For population 15 years and over in 29162:
Never married: 51.3%
Now married: 35.1%
Separated: 1.8%
Widowed: 5.2%
Divorced: 6.5%
Zip code 29162 compared to state average:
Median house value below state average.
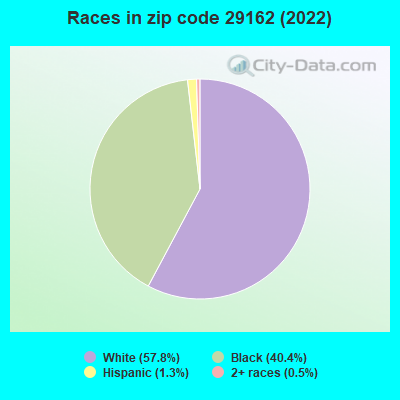
Hispanic race population percentage significantly below state average.
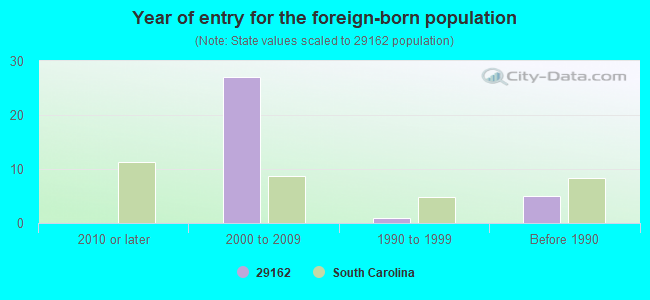
Foreign-born population percentage significantly below state average.
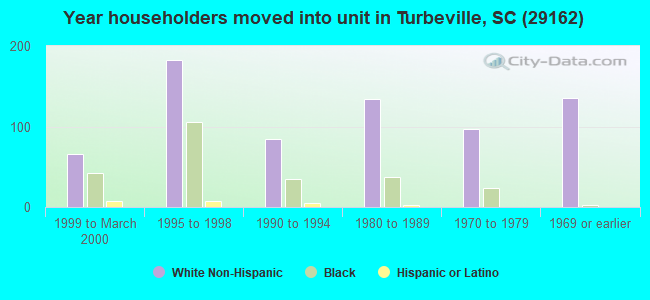
Length of stay since moving in significantly above state average.
Number of college students below state average.
Percentage of population with a bachelor's degree or higher significantly below state average.
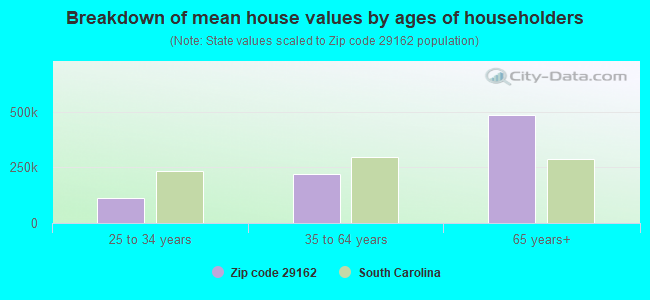
Estimated median house/condo value in 2022: $155,209
29162:
$155,209
South Carolina:
$254,600
According to our research of South Carolina and other state lists, there were 3 registered sex offenders living in 29162 zip code as of May 28, 2024. The ratio of all residents to sex offenders in zip code 29162 is 986 to 1.
Median resident age:
This zip code:
38.1 years
South Carolina median age:
40.5 years
Average household size:
This zip code:
2.7 people
South Carolina:
2.4 people
Averages for the 2020 tax year for zip code 29162, filed in 2021:
Average Adjusted Gross Income (AGI) in 2020: $47,503 (Individual Income Tax Returns)
Here:
$47,503
State:
$65,754
Salary/wage: $42,994 (reported on 81.5% of returns)
Here:
$42,994
State:
$52,566
(% of AGI for various income ranges: 1252.6% for AGIs below $25k, 3980.0% for AGIs $25k-50k, 6518.9% for AGIs $50k-75k, 9916.0% for AGIs $75k-100k, 19961.4% for AGIs $100k-200k)
Taxable interest for individuals: $500 (reported on 19.4% of returns)
This zip code:
$500
South Carolina:
$1,749
(% of AGI for various income ranges: 4.8% for AGIs below $25k, 4.8% for AGIs $25k-50k, 38.9% for AGIs $50k-75k, 6.0% for AGIs $75k-100k, 58.6% for AGIs $100k-200k)
Ordinary dividends: $2,209 (reported on 10.2% of returns)
Here:
$2,209
State:
$8,783
(% of AGI for various income ranges: 7.4% for AGIs below $25k, 108.9% for AGIs $50k-75k, 174.3% for AGIs $100k-200k)
Net capital gain/loss in AGI: +$6,233 (reported on 8.3% of returns)
Here:
+$6,233
State:
+$24,194
(% of AGI for various income ranges: 2.3% for AGIs below $25k, 226.7% for AGIs $50k-75k, 500.0% for AGIs $100k-200k)
Profit/loss from business: +$7,055 (reported on 18.5% of returns)
Here:
+$7,055
State:
+$11,253
(% of AGI for various income ranges: 172.9% for AGIs below $25k, 53.0% for AGIs $25k-50k, 451.1% for AGIs $50k-75k, 495.7% for AGIs $100k-200k)
Taxable individual retirement arrangement distribution: $13,000 (reported on 6.5% of returns)
29162:
$13,000
South Carolina:
$21,604
(% of AGI for various income ranges: 173.9% for AGIs $25k-50k, 1020.0% for AGIs $75k-100k)
Total itemized deductions: $30,425 (reported on 3.7% of returns)
Here:
$30,425
State:
$35,199
(% of AGI for various income ranges: 1738.6% for AGIs $100k-200k)
Charity contributions: $12,525 (reported on 3.7% of returns)
Here:
$12,525
State:
$14,319
(% of AGI for various income ranges: 715.7% for AGIs $100k-200k)
Taxes paid: $6,850 (reported on 3.7% of returns)
29162:
$6,850
State:
$7,486
(% of AGI for various income ranges: 391.4% for AGIs $100k-200k)
Earned income credit: $2,646 (reported on 25.9% of returns)
Here:
$2,646
State:
$2,397
(% of AGI for various income ranges: 157.4% for AGIs below $25k, 110.0% for AGIs $25k-50k)
Percentage of individuals using paid preparers for their 2020 taxes: 94.4%
Here:
94%
State:
93%
(% for various income ranges: 90.7% for AGIs below $25k, 93.3% for AGIs $25k-50k, 100.0% for AGIs $50k-75k, 100.0% for AGIs $75k-100k, 100.0% for AGIs $100k-200k, 100.0% for AGIs over 200k)
Averages for the 2012 tax year for zip code 29162, filed in 2013:
Average Adjusted Gross Income (AGI) in 2012: $38,716 (Individual Income Tax Returns)
Here:
$38,716
State:
$51,133
Salary/wage: $33,520 (reported on 87.6% of returns)
Here:
$33,520
State:
$42,173
(% of AGI for various income ranges: 78.0% for AGIs below $25k, 84.9% for AGIs $25k-50k, 77.5% for AGIs $50k-75k, 72.8% for AGIs $75k-100k, 67.9% for AGIs $100k-200k)
Taxable interest for individuals: $774 (reported on 23.7% of returns)
This zip code:
$774
South Carolina:
$1,468
(% of AGI for various income ranges: 0.8% for AGIs below $25k, 0.3% for AGIs $25k-50k, 0.6% for AGIs $50k-75k, 0.2% for AGIs $75k-100k, 0.5% for AGIs $100k-200k)
Ordinary dividends: $1,050 (reported on 8.2% of returns)
Here:
$1,050
State:
$6,511
(% of AGI for various income ranges: 0.3% for AGIs below $25k, 0.3% for AGIs $25k-50k, 0.7% for AGIs $75k-100k)
Net capital gain/loss in AGI: +$800 (reported on 9.3% of returns)
Here:
+$800
State:
+$13,061
(% of AGI for various income ranges: 0.5% for AGIs below $25k, 0.3% for AGIs $25k-50k, 0.2% for AGIs $75k-100k)
Profit/loss from business: +$4,883 (reported on 18.6% of returns)
Here:
+$4,883
State:
+$10,167
(% of AGI for various income ranges: 9.4% for AGIs below $25k, 1.1% for AGIs $25k-50k, 3.5% for AGIs $50k-75k)
Taxable individual retirement arrangement distribution: $9,643 (reported on 7.2% of returns)
29162:
$9,643
South Carolina:
$17,019
Total itemized deductions: $19,605 (23% of AGI, reported on 20.6% of returns)
Here:
$19,605
State:
$22,890
Here:
22.7% of AGI
State:
21.4% of AGI
(% of AGI for various income ranges: 4.0% for AGIs below $25k, 6.1% for AGIs $25k-50k, 8.1% for AGIs $50k-75k, 14.0% for AGIs $75k-100k, 17.2% for AGIs $100k-200k)
Charity contributions: $6,153 (reported on 17.5% of returns)
Here:
$6,153
State:
$5,169
(% of AGI for various income ranges: 2.0% for AGIs $25k-50k, 2.2% for AGIs $50k-75k, 4.2% for AGIs $75k-100k, 4.7% for AGIs $100k-200k)
Taxes paid: $5,905 (reported on 20.6% of returns)
29162:
$5,905
State:
$7,644
(% of AGI for various income ranges: 1.7% for AGIs $25k-50k, 2.1% for AGIs $50k-75k, 4.6% for AGIs $75k-100k, 6.0% for AGIs $100k-200k)
Earned income credit: $2,678 (reported on 33.0% of returns)
Here:
$2,678
State:
$2,418
(% of AGI for various income ranges: 10.6% for AGIs below $25k, 1.8% for AGIs $25k-50k)
Percentage of individuals using paid preparers for their 2012 taxes: 76.3%
Here:
76%
State:
57%
(% for various income ranges: 73.5% for AGIs below $25k, 76.0% for AGIs $25k-50k, 77.8% for AGIs $50k-75k, 85.7% for AGIs $75k-100k, 85.7% for AGIs $100k-200k)
Averages for the 2004 tax year for zip code 29162, filed in 2005:
Average Adjusted Gross Income (AGI) in 2004: $32,819 (Individual Income Tax Returns)
Here:
$32,819
State:
$41,965
Salary/wage: $29,153 (reported on 89.0% of returns)
Here:
$29,153
State:
$35,695
(% of AGI for various income ranges: 100.1% for AGIs below $10k, 81.8% for AGIs $10k-25k, 88.2% for AGIs $25k-50k, 84.9% for AGIs $50k-75k, 81.1% for AGIs $75k-100k, 53.0% for AGIs over 100k)
Taxable interest for individuals: $1,171 (reported on 29.4% of returns)
This zip code:
$1,171
South Carolina:
$1,623
(% of AGI for various income ranges: 1.6% for AGIs below $10k, 1.6% for AGIs $10k-25k, 0.8% for AGIs $25k-50k, 0.4% for AGIs $50k-75k, 0.4% for AGIs $75k-100k, 2.0% for AGIs over 100k)
Taxable dividends: $1,516 (reported on 9.4% of returns)
Here:
$1,516
State:
$3,999
(% of AGI for various income ranges: 0.4% for AGIs $10k-25k, 0.1% for AGIs $25k-50k, 0.2% for AGIs $50k-75k, 0.3% for AGIs $75k-100k, 1.4% for AGIs over 100k)
Net capital gain/loss: +$5,047 (reported on 8.6% of returns)
Here:
+$5,047
State:
+$13,100
(% of AGI for various income ranges: 0.6% for AGIs $10k-25k, 0.2% for AGIs $25k-50k, 0.0% for AGIs $50k-75k, 6.6% for AGIs $75k-100k, 0.6% for AGIs over 100k)
Profit/loss from business: +$4,295 (reported on 17.7% of returns)
Here:
+$4,295
State:
+$9,144
(% of AGI for various income ranges: 11.1% for AGIs below $10k, 6.8% for AGIs $10k-25k, 2.7% for AGIs $25k-50k, -0.3% for AGIs $50k-75k, -0.2% for AGIs $75k-100k, 1.0% for AGIs over 100k)
IRA payment deduction: $2,769 (reported on 1.3% of returns)
29162:
$2,769
South Carolina:
$2,972
Total itemized deductions: $16,824 (24% of AGI, reported on 21.7% of returns)
Here:
$16,824
State:
$19,039
Here:
23.8% of AGI
State:
22.8% of AGI
(% of AGI for various income ranges: 6.4% for AGIs $10k-25k, 8.4% for AGIs $25k-50k, 12.4% for AGIs $50k-75k, 16.5% for AGIs $75k-100k, 15.4% for AGIs over 100k)
Charity contributions deductions: $4,564 (6% of AGI, reported on 18.9% of returns)
Here:
$4,564
State:
$4,305
Here:
6.1% of AGI
State:
5.0% of AGI
(% of AGI for various income ranges: 0.9% for AGIs $10k-25k, 1.9% for AGIs $25k-50k, 3.0% for AGIs $50k-75k, 4.4% for AGIs $75k-100k, 3.9% for AGIs over 100k)
Total tax: $4,328 (reported on 65.4% of returns)
29162:
$4,328
State:
$6,497
(% of AGI for various income ranges: 2.4% for AGIs below $10k, 3.6% for AGIs $10k-25k, 6.3% for AGIs $25k-50k, 7.8% for AGIs $50k-75k, 9.1% for AGIs $75k-100k, 17.9% for AGIs over 100k)
Earned income credit: $1,971 (reported on 31.0% of returns)
Here:
$1,971
State:
$1,882
Percentage of individuals using paid preparers for their 2004 taxes: 76.0%
Here:
76%
State:
66%
(% for various income ranges: 70.6% for AGIs below $10k, 78.3% for AGIs $10k-25k, 73.4% for AGIs $25k-50k, 76.0% for AGIs $50k-75k, 85.2% for AGIs $75k-100k, 86.8% for AGIs over 100k)
Household received Food Stamps/SNAP in the past 12 months: 129 Household did not receive Food Stamps/SNAP in the past 12 months: 765
Women who had a birth in the past 12 months: 13 (10 now married, 2 unmarried) Women who did not have a birth in the past 12 months: 480 (281 now married, 201 unmarried)
Housing units in zip code 29162 with a mortgage: 307 (88 second mortgage, 85 both second mortgage and home equity loan) Houses without a mortgage: 1
Median monthly owner costs for units with a mortgage: $1,588 Median monthly owner costs for units without a mortgage: $366
Residents with income below the poverty level in 2022:
This zip code:
19.2%
Whole state:
14.0%
Residents with income below 50% of the poverty level in 2022:
This zip code:
15.3%
Whole state:
7.3%
Median number of rooms in houses and condos:
Here:
6.4
State:
6.4
Median number of rooms in apartments:
Here:
4.6
State:
4.5
Notable locations in this zip code not listed on our city pages
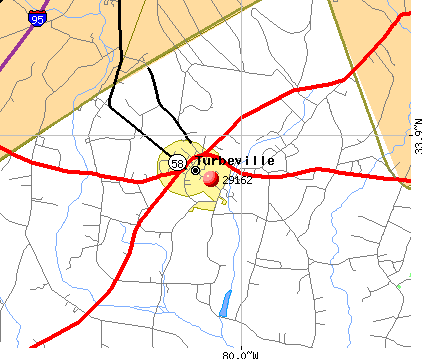
Notable locations in zip code 29162: Turbeville Town Hall (A), Dennis Memorial Auditorium (B), Clarendon County Rural Fire Department Turbeville (C), Turbeville Police Department (D), Free Will Baptist Childrens Home (E). Display/hide their locations on the map
Churches in zip code 29162 include: Holiness Church (A), Hickory Grove Church (B), Oak Grove Church (C), Saint Paul Church (D), Union Hill Church (E). Display/hide their locations on the map
In group quarters: 1,081 (-1 institutionalized population)
Size of family households: 222 2-persons, 105 3-persons, 216 4-persons, 34 5-persons, 3 6-persons, 32 7-or-more-persons
Size of nonfamily households: 229 1-person, 46 2-persons
349 married couples with children.
183 single-parent households (12 men, 171 women).
97.7% of residents of 29162 zip code speak English at home.
1.5% of residents speak Spanish at home (54% very well, 46% well).
0.1% of residents speak other Indo-European language at home (100% not well).
0.3% of residents speak other language at home (56% very well, 44% well).
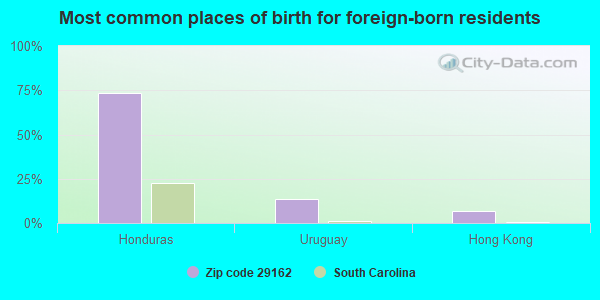
Foreign born population: 28 (0.8%) (7.7% of them are naturalized citizens)
This zip code:
0.8%
Whole state:
5.2%
73%Honduras
13%Uruguay
7%Hong Kong
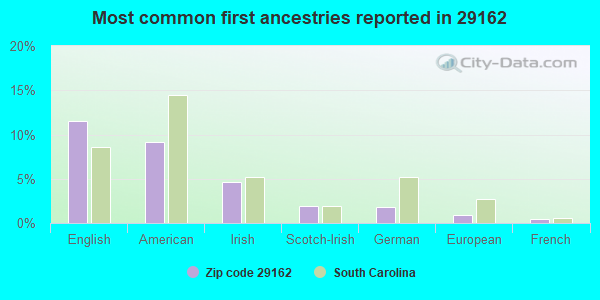
11%English
9%American
5%Irish
2%Scotch-Irish
2%German
1%European
0%French
Year of entry for the foreign-born population
02010 or later
272000 to 2009
11990 to 1999
5Before 1990
Facilities with environmental interests located in this zip code:
G&M ENTERPRISE SUNOCO SERVICE STATION (I95 & HWY 378 in TURBEVILLE, SC)
(Resource Conservation and Recovery Act (tracking hazardous waste)) STATE MASTER (South Carolina database) - HAZARDOUS WASTE PROGRAM Organizations: OPERNAME (CONTACT/OPERATOR)
, OWNERNAME (CONTACT/OWNER)
Alternative names: G&M ENTERPRISE SUNOCO SERV DEACTIVATED
E C REDI-MIX (GAMBLE ST in TURBEVILLE, SC)
AIR MINOR (AIRS/AFS) STATE MASTER (South Carolina database) - AIR PROGRAM Business SIC classification: READY-MIXED CONCRETE
COKER BUILDERS (214 GAMBLE ST in TURBEVILLE, SC)
AIR MINOR (AIRS/AFS) STATE MASTER (South Carolina database) - AIR PROGRAM Business SIC classification: PREFABRICATED WOOD BUILDINGS AND COMPONENTS
EAST CLARENDON HIGH SCHOOL (1171 POPE ST. in TURBEVILLE, SC)
(Geographic Names Information System) (National Center for Education Statistics) - STATE ID-1403016 Organizations: CLARENDON COUNTY SCHOOL DISTRICT 03 (SCHOOL DISTRICT)
EAST CLARENDON MIDDLE SCHOOL (1101 POPE ST. in TURBEVILLE, SC)
(Geographic Names Information System) (National Center for Education Statistics) - STATE ID-1403018 Organizations: CLARENDON COUNTY SCHOOL DISTRICT 03 (SCHOOL DISTRICT)
CLARENDON COUNTY SCHOOL DISTRICT #3 (HIGHWAY 378 EAST in TURBEVILLE, SC)
COMPLIANCE ACTIVITY (Tracking inspections of insecticide, fungicide, and rodenticide, and toxic substances)
Housing units lacking complete plumbing facilities: 3.2% Housing units lacking complete kitchen facilities: 4.2%
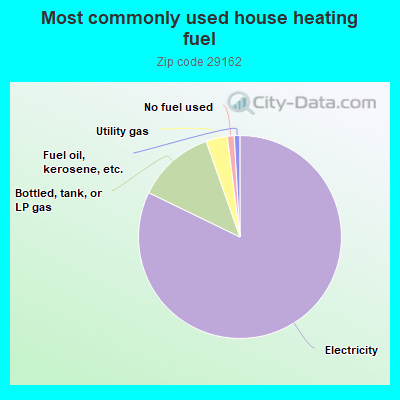
82.2%Electricity
12.4%Bottled, tank, or LP gas
3.4%Utility gas
1.1%No fuel used
0.9%Fuel oil, kerosene, etc.
Population in 1990: 3,138.
Place of birth for U.S.-born residents:
This state: 2,654
Northeast: 209
Midwest: 175
South: 354
West: 37
62% of the 29162 zip code residents lived in the same house 5 years ago. Out of people who lived in different houses, 63% lived in this county. Out of people who lived in different counties, 50% lived in South Carolina.
93% of the 29162 zip code residents lived in the same house 1 year ago. Out of people who lived in different houses, 9% moved from this county. Out of people who lived in different houses, 80% moved from different county within same state. Out of people who lived in different houses, 15% moved from different state.
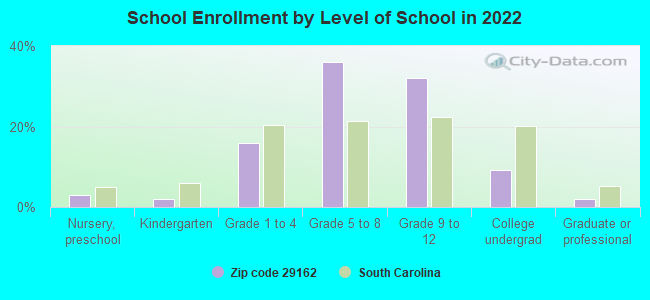
Private vs. public school enrollment:
Students in private schools in grades 1 to 8 (elementary and middle school): 17
Here:
5.9%
South Carolina:
14.4%
Students in private schools in grades 9 to 12 (high school):
Here:
0.0%
South Carolina:
11.1%
Students in private undergraduate colleges: 6
Here:
11.7%
South Carolina:
21.9%
Occupation by median earnings in the past 12 months ($)
97,353Business and financial operations occupations
82,546Management occupations
60,987Education, training, and library occupations
43,858Installation, maintenance, and repair occupations
39,900Transportation occupations
37,632Office and administrative support occupations
Top industries in this zip code by the number of employees in 2005:
Construction: All Other Specialty Trade Contractors (20-49: 1)
Administrative and Support and Waste Management and Remediation Services: Facilities Support Services (20-49: 1)
Finance and Insurance: Commercial Banking (10-19: 2)
Accommodation and Food Services: Hotels (except Casino Hotels) and Motels (10-19: 2)
Other Services (except Public Administration): General Automotive Repair (5-9: 2, 1-4: 2)
Other Services (except Public Administration): Religious Organizations (5-9: 2, 1-4: 2)
Construction: Water and Sewer Line and Related Structures Construction (10-19: 1)
People in group quarters in 2010:
1,390 people in state prisons
19 people in group homes for juveniles (non-correctional)
4 people in group homes intended for adults
People in group quarters in 2000:
28 people in homes for abused, dependent, and neglected children
Fatal accident statistics in 2010:
Fatal accident count: 1
Vehicles involved in fatal accidents: 1
Fatal accidents caused by drunken drivers: 0
Fatalities: 1
Persons involved in fatal accidents: 1
Pedestrians involved in fatal accidents: 0
2003 - 2018 National Fire Incident Reporting System (NFIRS) incidents
Based on the data from the years 2003 - 2018 the average number of fire incidents per year is 23. The highest number of fire incidents - 43 took place in 2017, and the least - 0 in 2008. The data has a declining trend.
When looking into fire subcategories, the most reports belonged to: Outside Fires (55.0%), and Structure Fires (27.1%).
Fire incident types reported to NFIRS in Zip Code 29162

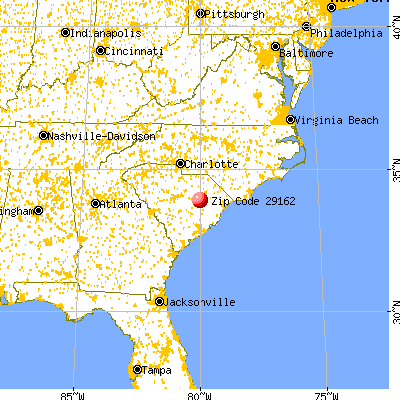


 Nearest zip codes: 29111, 29114, 29051, 29080, 29001, 29518.


 Based on the data from the years 2003 - 2018 the average number of fire incidents per year is 23. The highest number of fire incidents - 43 took place in 2017, and the least - 0 in 2008. The data has a declining trend.
 When looking into fire subcategories, the most reports belonged to: Outside Fires (55.0%), and Structure Fires (27.1%).