Estimated zip code population in 2022: 2,574 Zip code population in 2010: 2,356 Zip code population in 2000: 2,388
Houses and condos: 1,106 Renter-occupied apartments: 243
% of renters here:
23%
State:
28%
March 2022 cost of living index in zip code 29448: 81.1 (low, U.S. average is 100)
Land area: 48.4 sq. mi. Water area: 0.4 sq. mi.
Population density: 53 people per square mile
(very low).
OSM Map
General Map
Google Map
MSN Map
OSM Map
General Map
Google Map
MSN Map
OSM Map
General Map
Google Map
MSN Map
OSM Map
General Map
Google Map
MSN Map
Please wait while loading the map...
Real estate property taxes paid for housing units in 2022:
This zip code:
0.6% ($1,157)
South Carolina:
0.5% ($1,185)
Median real estate property taxes paid for housing units with mortgages in 2022: $1,956 (0.7%) Median real estate property taxes paid for housing units with no mortgage in 2022: $883 (0.5%)
Estimated median house/condo value in 2022: $195,013
29448:
$195,013
South Carolina:
$254,600
According to our research of South Carolina and other state lists, there were 2 registered sex offenders living in 29448 zip code as of May 28, 2024. The ratio of all residents to sex offenders in zip code 29448 is 930 to 1.
Median resident age:
This zip code:
33.3 years
South Carolina median age:
40.5 years
Average household size:
This zip code:
2.4 people
South Carolina:
2.4 people
Averages for the 2020 tax year for zip code 29448, filed in 2021:
Average Adjusted Gross Income (AGI) in 2020: $47,138 (Individual Income Tax Returns)
Here:
$47,138
State:
$65,754
Salary/wage: $42,413 (reported on 83.8% of returns)
Here:
$42,413
State:
$52,566
(% of AGI for various income ranges: 1237.5% for AGIs below $25k, 3783.8% for AGIs $25k-50k, 7616.0% for AGIs $50k-75k, 10241.7% for AGIs $75k-100k, 21070.0% for AGIs $100k-200k)
Taxable interest for individuals: $448 (reported on 18.9% of returns)
This zip code:
$448
South Carolina:
$1,749
(% of AGI for various income ranges: 3.8% for AGIs below $25k, 6.2% for AGIs $25k-50k, 11.0% for AGIs $50k-75k, 55.0% for AGIs $75k-100k, 38.3% for AGIs $100k-200k)
Ordinary dividends: $1,844 (reported on 8.1% of returns)
Here:
$1,844
State:
$8,783
(% of AGI for various income ranges: 8.4% for AGIs below $25k, 46.0% for AGIs $50k-75k, 155.0% for AGIs $100k-200k)
Net capital gain/loss in AGI: +$3,089 (reported on 8.1% of returns)
Here:
+$3,089
State:
+$24,194
(% of AGI for various income ranges: 94.0% for AGIs $50k-75k, 318.3% for AGIs $100k-200k)
Profit/loss from business: +$3,659 (reported on 15.3% of returns)
Here:
+$3,659
State:
+$11,253
(% of AGI for various income ranges: 125.3% for AGIs below $25k, 12.5% for AGIs $25k-50k, 320.0% for AGIs $75k-100k)
Taxable individual retirement arrangement distribution: $16,929 (reported on 6.3% of returns)
29448:
$16,929
South Carolina:
$21,604
(% of AGI for various income ranges: 139.6% for AGIs $25k-50k, 1416.7% for AGIs $75k-100k)
Total itemized deductions: $22,400 (reported on 3.6% of returns)
Here:
$22,400
State:
$35,199
(% of AGI for various income ranges: 896.0% for AGIs $50k-75k)
Charity contributions: $6,467 (reported on 2.7% of returns)
Here:
$6,467
State:
$14,319
(% of AGI for various income ranges: 194.0% for AGIs $50k-75k)
Taxes paid: $5,825 (reported on 3.6% of returns)
29448:
$5,825
State:
$7,486
(% of AGI for various income ranges: 233.0% for AGIs $50k-75k)
Earned income credit: $2,548 (reported on 26.1% of returns)
Here:
$2,548
State:
$2,397
(% of AGI for various income ranges: 156.2% for AGIs below $25k, 99.6% for AGIs $25k-50k)
Percentage of individuals using paid preparers for their 2020 taxes: 91.0%
Here:
91%
State:
93%
(% for various income ranges: 90.2% for AGIs below $25k, 93.5% for AGIs $25k-50k, 87.5% for AGIs $50k-75k, 90.0% for AGIs $75k-100k, 92.3% for AGIs $100k-200k)
Averages for the 2012 tax year for zip code 29448, filed in 2013:
Average Adjusted Gross Income (AGI) in 2012: $38,616 (Individual Income Tax Returns)
Here:
$38,616
State:
$51,133
Salary/wage: $35,762 (reported on 83.3% of returns)
Here:
$35,762
State:
$42,173
(% of AGI for various income ranges: 75.8% for AGIs below $25k, 79.2% for AGIs $25k-50k, 75.9% for AGIs $50k-75k, 79.5% for AGIs $75k-100k, 75.4% for AGIs $100k-200k)
Taxable interest for individuals: $600 (reported on 20.6% of returns)
This zip code:
$600
South Carolina:
$1,468
(% of AGI for various income ranges: 0.6% for AGIs below $25k, 0.5% for AGIs $25k-50k, 0.2% for AGIs $50k-75k, 0.3% for AGIs $75k-100k)
Ordinary dividends: $1,478 (reported on 8.8% of returns)
Here:
$1,478
State:
$6,511
(% of AGI for various income ranges: 0.8% for AGIs $25k-50k, 0.2% for AGIs $50k-75k, 0.4% for AGIs $100k-200k)
Net capital gain/loss in AGI: +$1,980 (reported on 4.9% of returns)
Here:
+$1,980
State:
+$13,061
Profit/loss from business: +$5,564 (reported on 13.7% of returns)
Here:
+$5,564
State:
+$10,167
(% of AGI for various income ranges: 6.9% for AGIs below $25k, 0.6% for AGIs $25k-50k, 3.3% for AGIs $50k-75k, 0.2% for AGIs $75k-100k)
Taxable individual retirement arrangement distribution: $9,867 (reported on 5.9% of returns)
29448:
$9,867
South Carolina:
$17,019
Total itemized deductions: $17,961 (26% of AGI, reported on 22.5% of returns)
Here:
$17,961
State:
$22,890
Here:
26.5% of AGI
State:
21.4% of AGI
(% of AGI for various income ranges: 6.9% for AGIs below $25k, 8.6% for AGIs $25k-50k, 11.1% for AGIs $50k-75k, 9.6% for AGIs $75k-100k, 15.3% for AGIs $100k-200k)
Charity contributions: $3,895 (reported on 19.6% of returns)
Here:
$3,895
State:
$5,169
(% of AGI for various income ranges: 1.5% for AGIs below $25k, 1.6% for AGIs $25k-50k, 2.2% for AGIs $50k-75k, 1.8% for AGIs $75k-100k, 2.7% for AGIs $100k-200k)
Taxes paid: $5,287 (reported on 22.5% of returns)
29448:
$5,287
State:
$7,644
(% of AGI for various income ranges: 0.7% for AGIs below $25k, 1.9% for AGIs $25k-50k, 2.7% for AGIs $50k-75k, 3.2% for AGIs $75k-100k, 6.3% for AGIs $100k-200k)
Earned income credit: $2,694 (reported on 31.4% of returns)
Here:
$2,694
State:
$2,418
(% of AGI for various income ranges: 11.0% for AGIs below $25k, 1.5% for AGIs $25k-50k)
Percentage of individuals using paid preparers for their 2012 taxes: 59.8%
Here:
60%
State:
57%
(% for various income ranges: 53.1% for AGIs below $25k, 60.0% for AGIs $25k-50k, 69.2% for AGIs $50k-75k, 75.0% for AGIs $75k-100k, 71.4% for AGIs $100k-200k)
Averages for the 2004 tax year for zip code 29448, filed in 2005:
Average Adjusted Gross Income (AGI) in 2004: $34,321 (Individual Income Tax Returns)
Here:
$34,321
State:
$41,965
Salary/wage: $32,334 (reported on 87.2% of returns)
Here:
$32,334
State:
$35,695
(% of AGI for various income ranges: 129.0% for AGIs below $10k, 78.3% for AGIs $10k-25k, 84.8% for AGIs $25k-50k, 88.4% for AGIs $50k-75k, 86.7% for AGIs $75k-100k, 60.3% for AGIs over 100k)
Taxable interest for individuals: $1,206 (reported on 30.1% of returns)
This zip code:
$1,206
South Carolina:
$1,623
(% of AGI for various income ranges: 6.0% for AGIs below $10k, 2.1% for AGIs $10k-25k, 0.6% for AGIs $25k-50k, 0.5% for AGIs $50k-75k, 0.6% for AGIs $75k-100k, 1.5% for AGIs over 100k)
Taxable dividends: $1,150 (reported on 10.1% of returns)
Here:
$1,150
State:
$3,999
(% of AGI for various income ranges: 0.3% for AGIs $10k-25k, 0.3% for AGIs $25k-50k, 0.1% for AGIs $50k-75k, 0.2% for AGIs $75k-100k, 0.9% for AGIs over 100k)
Net capital gain/loss: +$10,229 (reported on 7.8% of returns)
Here:
+$10,229
State:
+$13,100
(% of AGI for various income ranges: 2.1% for AGIs below $10k, -0.1% for AGIs $10k-25k, 0.7% for AGIs $25k-50k, 0.1% for AGIs $50k-75k, 4.4% for AGIs $75k-100k, 8.3% for AGIs over 100k)
Profit/loss from business: +$1,792 (reported on 11.3% of returns)
Here:
+$1,792
State:
+$9,144
(% of AGI for various income ranges: 9.6% for AGIs below $10k, 4.4% for AGIs $10k-25k, -0.7% for AGIs $25k-50k, -0.3% for AGIs $50k-75k, -0.1% for AGIs $75k-100k)
Total itemized deductions: $16,012 (24% of AGI, reported on 24.4% of returns)
Here:
$16,012
State:
$19,039
Here:
24.0% of AGI
State:
22.8% of AGI
(% of AGI for various income ranges: 6.3% for AGIs $10k-25k, 11.0% for AGIs $25k-50k, 11.2% for AGIs $50k-75k, 16.0% for AGIs $75k-100k, 13.5% for AGIs over 100k)
Charity contributions deductions: $3,506 (5% of AGI, reported on 22.1% of returns)
Here:
$3,506
State:
$4,305
Here:
5.2% of AGI
State:
5.0% of AGI
(% of AGI for various income ranges: 1.1% for AGIs $10k-25k, 2.0% for AGIs $25k-50k, 2.1% for AGIs $50k-75k, 4.1% for AGIs $75k-100k, 2.2% for AGIs over 100k)
Total tax: $4,330 (reported on 64.7% of returns)
29448:
$4,330
State:
$6,497
(% of AGI for various income ranges: 1.9% for AGIs below $10k, 3.1% for AGIs $10k-25k, 5.7% for AGIs $25k-50k, 9.0% for AGIs $50k-75k, 9.6% for AGIs $75k-100k, 14.6% for AGIs over 100k)
Earned income credit: $1,965 (reported on 29.4% of returns)
Here:
$1,965
State:
$1,882
Percentage of individuals using paid preparers for their 2004 taxes: 72.7%
Here:
73%
State:
66%
(% for various income ranges: 65.3% for AGIs below $10k, 76.8% for AGIs $10k-25k, 73.0% for AGIs $25k-50k, 68.2% for AGIs $50k-75k, 74.4% for AGIs $75k-100k, 90.0% for AGIs over 100k)
Household received Food Stamps/SNAP in the past 12 months: 260 Household did not receive Food Stamps/SNAP in the past 12 months: 819
Women who had a birth in the past 12 months: 79 (0 now married, 72 unmarried) Women who did not have a birth in the past 12 months: 638 (204 now married, 431 unmarried)
Housing units in zip code 29448 with a mortgage: 299 (8 second mortgage, 2 both second mortgage and home equity loan) Houses without a mortgage: 1
Median monthly owner costs for units with a mortgage: $1,622 Median monthly owner costs for units without a mortgage: $472
Residents with income below the poverty level in 2022:
This zip code:
17.1%
Whole state:
14.0%
Residents with income below 50% of the poverty level in 2022:
This zip code:
3.7%
Whole state:
7.3%
Median number of rooms in houses and condos:
Here:
6.1
State:
6.4
Median number of rooms in apartments:
Here:
5.1
State:
4.5
Notable locations in this zip code not listed on our city pages
Notable locations in zip code 29448: Harleyville Town Hall (A), Indian Field Volunteer Fire Department Number 1 (B), Harleyville Rural Hannah - Salem - Friendfield Fire District Station 4 Number 1 (C), South Carolina Transport Police District 6 Office (D), Harleyville Police Department (E). Display/hide their locations on the map
Churches in zip code 29448 include: Mount Zion Church (A), Bethlehem Church (B), Saint James Church (C), First Baptist Church of Harleyville (D), Saint Daniels Church (E). Display/hide their locations on the map
In group quarters: 3 (-1 institutionalized population)
Size of family households: 375 2-persons, 152 3-persons, 112 4-persons, 40 5-persons, 49 7-or-more-persons
Size of nonfamily households: 297 1-person, 50 2-persons
254 married couples with children.
198 single-parent households (29 men, 169 women).
94.0% of residents of 29448 zip code speak English at home.
5.0% of residents speak Spanish at home (100% very well).
0.5% of residents speak Asian or Pacific Island language at home (62% very well, 38% not at all).
Foreign born population: 21 (0.8%) (60.8% of them are naturalized citizens)
This zip code:
0.8%
Whole state:
5.2%
62%Barbados
20%English
15%Irish
7%German
5%American
3%Scottish
1%Italian
0%French
Year of entry for the foreign-born population
02010 or later
92000 to 2009
01990 to 1999
11Before 1990
Facilities with environmental interests located in this zip code:
CAROLINA COMPOSITES LLC (139 PIONEER GYM ROAD in HARLEYVILLE, SC)
AIR MAJOR (AIRS/AFS) - ICIS-04-2006-1753, ENFORCEMENT/COMPLIANCE ACTIVITY CRITERIA AND HAZARDOUS AIR POLLUTANT INVENTORY (Inventory of air pollution sources) STATE MASTER (South Carolina database) - AIR PROGRAM, AIR MAJOR, TRI REPORTER (Tracking of toxic chemicals releasing facilities) Business SIC classification: BOAT BUILDING AND REPAIRING; MANUFACTURING INDUSTRIES Business NAICS classification: BOAT BUILDING. Alternative names: CAROLINA COMPOSITES:HARLEYVILLE
DELCON (SC) INCORPORATED (HIGHWAY 453 NORTH in HARLEYVILLE, SC)
(Resource Conservation and Recovery Act (tracking hazardous waste)) STATE MASTER (South Carolina database) - HAZARDOUS WASTE PROGRAM Organizations: OPERNAME (CONTACT/OPERATOR)
, OWNERNAME (CONTACT/OWNER)
Alternative names: DELCON (SC) INC DEACTIVATED
CSX TRANSPORTATION (SC HWY 453 500 WATER ST in HARLEYVILLE, SC)
(Resource Conservation and Recovery Act (tracking hazardous waste)) STATE MASTER (South Carolina database) - HAZARDOUS WASTE PROGRAM
E&C WILLIAMS (BOWMAN ROAD in HARLEYVILLE, SC)
AIR MINOR (AIRS/AFS) STATE MASTER (South Carolina database) - AIR PROGRAM Business SIC classification: MINERALS AND EARTHS, GROUND OR OTHERWISE TREATED Organizations: REBER LUTHER (CONTACT/ENGINEERING/CONSULTING FIRM)
FLEET WORLD INCORPORATED (9324 CHARLESTON HWY in HARLEYVILLE, SC)
Conditionally Exempt Small Quantity Generators, less than 100 kg/month of hazardous waste (Resource Conservation and Recovery Act (tracking hazardous waste)) - notification STATE MASTER (South Carolina database) - HAZARDOUS WASTE PROGRAM Organizations: VASS GARRIE L (CONTACT/OWNER)
DORCHESTER EXCAVATING (GIANT CEMENT in HARLEYVILLE, SC)
AIR MINOR (AIRS/AFS) Business SIC classification: CRUSHED AND BROKEN STONE; HIGHWAY AND STREET CONSTRUCTION, EXCEPT ELEVATED HIGHWAYS Alternative names: DORCHESTER DIRT PIT, DORCHESTER DIRT PIT CRUSHER
DRAPER CONST CO (RT 2, BOX 1184-C in MARION, SC)
AIR MINOR (AIRS/AFS) Business SIC classification: HEAVY CONSTRUCTION
Housing units lacking complete plumbing facilities: 0.9% Housing units lacking complete kitchen facilities: 0.8%
87.4%Electricity
9.1%Utility gas
3.5%Bottled, tank, or LP gas
Population in 1990: 3,289.
Place of birth for U.S.-born residents:
This state: 1,964
Northeast: 127
Midwest: 94
South: 241
West: 94
68% of the 29448 zip code residents lived in the same house 5 years ago. Out of people who lived in different houses, 63% lived in this county. Out of people who lived in different counties, 50% lived in South Carolina.
86% of the 29448 zip code residents lived in the same house 1 year ago. Out of people who lived in different houses, 9% moved from this county. Out of people who lived in different houses, 30% moved from different county within same state. Out of people who lived in different houses, 71% moved from different state. Out of people who lived in different houses, 0% moved from abroad.
Private vs. public school enrollment:
Students in private schools in grades 1 to 8 (elementary and middle school): 1
Here:
0.5%
South Carolina:
14.4%
Students in private schools in grades 9 to 12 (high school):
Here:
0.0%
South Carolina:
11.1%
Students in private undergraduate colleges: 4
Here:
9.8%
South Carolina:
21.9%
Occupation by median earnings in the past 12 months ($)
84,153Management occupations
81,738Installation, maintenance, and repair occupations
68,881Transportation occupations
65,212Building and grounds cleaning and maintenance occupations
60,926Production occupations
36,402Construction and extraction occupations
Top industries in this zip code by the number of employees in 2005:
Health Care and Social Assistance: Nursing Care Facilities (20-49 employees: 1 establishment)
Mining: Construction Sand and Gravel Mining (20-49: 1)
Wholesale Trade: Petroleum and Petroleum Products Merchant Wholesalers (except Bulk Stations and Terminals) (20-49: 1)
Construction: Commercial and Institutional Building Construction (10-19: 2, 1-4: 1)
Accommodation and Food Services: Full-Service Restaurants (10-19: 1)
People in group quarters in 2010:
6 people in group homes for juveniles (non-correctional)
Fatal accident statistics in 2013:
Fatal accident count: 2
Vehicles involved in fatal accidents: 3
Fatal accidents caused by drunken drivers: 0
Fatalities: 2
Persons involved in fatal accidents: 3
Pedestrians involved in fatal accidents: 1
Fatal accident statistics in 2012:
Fatal accident count: 2
Vehicles involved in fatal accidents: 2
Fatal accidents caused by drunken drivers: 0
Fatalities: 2
Persons involved in fatal accidents: 5
Pedestrians involved in fatal accidents: 0
Home Mortgage Disclosure Act Aggregated Statistics For Year 2009 (Based on 2 partial tracts)
A) FHA, FSA/RHS & VA Home Purchase Loans
B) Conventional Home Purchase Loans
C) Refinancings
D) Home Improvement Loans
F) Non-occupant Loans on < 5 Family Dwellings (A B C & D)
G) Loans On Manufactured Home Dwelling (A B C & D)
Number
Average Value
Number
Average Value
Number
Average Value
Number
Average Value
Number
Average Value
Number
Average Value
LOANS ORIGINATED
4
$110,322
17
$100,449
70
$115,545
12
$39,930
10
$98,016
24
$53,432
APPLICATIONS APPROVED, NOT ACCEPTED
1
$53,890
2
$51,700
4
$145,275
1
$56,800
0
$0
2
$40,050
APPLICATIONS DENIED
1
$211,180
12
$73,973
25
$131,571
2
$21,845
2
$60,440
14
$72,976
APPLICATIONS WITHDRAWN
1
$98,310
1
$65,540
11
$151,002
1
$171,130
1
$99,040
3
$58,983
FILES CLOSED FOR INCOMPLETENESS
0
$0
1
$23,300
6
$119,668
0
$0
0
$0
2
$89,570
Aggregated Statistics For Year 2008 (Based on 2 partial tracts)
A) FHA, FSA/RHS & VA Home Purchase Loans
B) Conventional Home Purchase Loans
C) Refinancings
D) Home Improvement Loans
F) Non-occupant Loans on < 5 Family Dwellings (A B C & D)
G) Loans On Manufactured Home Dwelling (A B C & D)
Number
Average Value
Number
Average Value
Number
Average Value
Number
Average Value
Number
Average Value
Number
Average Value
LOANS ORIGINATED
3
$84,470
18
$111,010
50
$133,872
19
$25,678
7
$184,130
25
$53,858
APPLICATIONS APPROVED, NOT ACCEPTED
0
$0
1
$182,050
5
$187,148
1
$26,940
1
$119,420
1
$69,910
APPLICATIONS DENIED
2
$187,875
15
$72,043
35
$123,087
11
$77,719
4
$68,450
26
$64,278
APPLICATIONS WITHDRAWN
0
$0
1
$24,760
18
$153,246
1
$2,180
1
$101,950
2
$87,385
FILES CLOSED FOR INCOMPLETENESS
0
$0
0
$0
6
$193,702
0
$0
0
$0
0
$0
Aggregated Statistics For Year 2007 (Based on 2 partial tracts)
A) FHA, FSA/RHS & VA Home Purchase Loans
B) Conventional Home Purchase Loans
C) Refinancings
D) Home Improvement Loans
F) Non-occupant Loans on < 5 Family Dwellings (A B C & D)
G) Loans On Manufactured Home Dwelling (A B C & D)
Number
Average Value
Number
Average Value
Number
Average Value
Number
Average Value
Number
Average Value
Number
Average Value
LOANS ORIGINATED
4
$130,165
33
$127,832
67
$115,512
23
$35,713
10
$80,539
28
$47,307
APPLICATIONS APPROVED, NOT ACCEPTED
1
$101,950
7
$112,559
13
$107,102
1
$33,500
4
$85,382
9
$89,569
APPLICATIONS DENIED
1
$102,680
15
$77,092
64
$120,824
19
$66,151
4
$94,485
31
$63,823
APPLICATIONS WITHDRAWN
1
$97,580
1
$48,790
24
$144,730
3
$81,800
0
$0
3
$83,013
FILES CLOSED FOR INCOMPLETENESS
1
$42,960
4
$75,368
5
$189,186
0
$0
0
$0
0
$0
Aggregated Statistics For Year 2006 (Based on 2 partial tracts)
A) FHA, FSA/RHS & VA Home Purchase Loans
B) Conventional Home Purchase Loans
C) Refinancings
D) Home Improvement Loans
F) Non-occupant Loans on < 5 Family Dwellings (A B C & D)
G) Loans On Manufactured Home Dwelling (A B C & D)
Number
Average Value
Number
Average Value
Number
Average Value
Number
Average Value
Number
Average Value
Number
Average Value
LOANS ORIGINATED
2
$66,265
44
$110,173
52
$96,234
18
$33,781
14
$74,329
39
$57,509
APPLICATIONS APPROVED, NOT ACCEPTED
0
$0
11
$59,050
12
$107,349
3
$23,303
2
$128,165
11
$51,106
APPLICATIONS DENIED
2
$83,745
37
$68,608
31
$107,821
10
$43,474
3
$102,190
34
$51,531
APPLICATIONS WITHDRAWN
0
$0
4
$174,040
15
$88,549
4
$60,805
0
$0
7
$59,920
FILES CLOSED FOR INCOMPLETENESS
0
$0
1
$116,510
9
$94,100
0
$0
0
$0
2
$104,135
Aggregated Statistics For Year 2005 (Based on 2 partial tracts)
A) FHA, FSA/RHS & VA Home Purchase Loans
B) Conventional Home Purchase Loans
C) Refinancings
D) Home Improvement Loans
F) Non-occupant Loans on < 5 Family Dwellings (A B C & D)
G) Loans On Manufactured Home Dwelling (A B C & D)
Number
Average Value
Number
Average Value
Number
Average Value
Number
Average Value
Number
Average Value
Number
Average Value
LOANS ORIGINATED
5
$153,068
40
$83,142
47
$93,349
19
$25,219
8
$58,074
36
$49,801
APPLICATIONS APPROVED, NOT ACCEPTED
0
$0
13
$71,419
7
$98,307
3
$24,517
0
$0
9
$60,846
APPLICATIONS DENIED
4
$119,242
31
$65,162
53
$100,038
15
$51,217
3
$53,400
44
$53,109
APPLICATIONS WITHDRAWN
1
$66,990
9
$75,976
23
$100,872
6
$78,403
2
$88,110
10
$89,350
FILES CLOSED FOR INCOMPLETENESS
0
$0
2
$100,490
7
$141,271
1
$58,260
0
$0
1
$46,600
Aggregated Statistics For Year 2004 (Based on 2 partial tracts)
A) FHA, FSA/RHS & VA Home Purchase Loans
B) Conventional Home Purchase Loans
C) Refinancings
D) Home Improvement Loans
F) Non-occupant Loans on < 5 Family Dwellings (A B C & D)
G) Loans On Manufactured Home Dwelling (A B C & D)
Number
Average Value
Number
Average Value
Number
Average Value
Number
Average Value
Number
Average Value
Number
Average Value
LOANS ORIGINATED
4
$108,138
44
$69,626
71
$90,933
12
$22,028
12
$49,639
37
$47,471
APPLICATIONS APPROVED, NOT ACCEPTED
0
$0
12
$53,826
9
$118,130
3
$15,777
0
$0
12
$45,755
APPLICATIONS DENIED
1
$31,310
39
$52,393
53
$86,738
13
$16,805
2
$22,575
42
$57,129
APPLICATIONS WITHDRAWN
0
$0
3
$73,547
25
$111,939
3
$45,390
0
$0
4
$74,278
FILES CLOSED FOR INCOMPLETENESS
0
$0
0
$0
7
$109,959
0
$0
0
$0
0
$0
Aggregated Statistics For Year 2003 (Based on 2 partial tracts)
A) FHA, FSA/RHS & VA Home Purchase Loans
B) Conventional Home Purchase Loans
C) Refinancings
D) Home Improvement Loans
F) Non-occupant Loans on < 5 Family Dwellings (A B C & D)
Number
Average Value
Number
Average Value
Number
Average Value
Number
Average Value
Number
Average Value
LOANS ORIGINATED
2
$110,685
32
$56,731
111
$91,878
15
$11,651
6
$43,328
APPLICATIONS APPROVED, NOT ACCEPTED
1
$28,400
4
$50,065
19
$79,719
3
$40,780
1
$56,800
APPLICATIONS DENIED
3
$62,627
39
$52,654
74
$76,304
13
$6,330
3
$44,907
APPLICATIONS WITHDRAWN
1
$34,230
6
$69,058
20
$87,129
1
$18,200
1
$36,410
FILES CLOSED FOR INCOMPLETENESS
0
$0
0
$0
5
$129,474
0
$0
0
$0
Aggregated Statistics For Year 2002 (Based on 2 partial tracts)
A) FHA, FSA/RHS & VA Home Purchase Loans
B) Conventional Home Purchase Loans
C) Refinancings
D) Home Improvement Loans
F) Non-occupant Loans on < 5 Family Dwellings (A B C & D)
Number
Average Value
Number
Average Value
Number
Average Value
Number
Average Value
Number
Average Value
LOANS ORIGINATED
1
$43,690
37
$75,339
79
$82,259
18
$18,246
7
$39,531
APPLICATIONS APPROVED, NOT ACCEPTED
0
$0
15
$47,139
15
$76,704
0
$0
0
$0
APPLICATIONS DENIED
1
$66,270
32
$68,087
66
$66,972
9
$16,101
3
$68,207
APPLICATIONS WITHDRAWN
1
$74,280
4
$82,650
29
$72,192
0
$0
1
$26,220
FILES CLOSED FOR INCOMPLETENESS
0
$0
3
$85,927
4
$73,548
0
$0
0
$0
Aggregated Statistics For Year 2001 (Based on 2 partial tracts)
A) FHA, FSA/RHS & VA Home Purchase Loans
B) Conventional Home Purchase Loans
C) Refinancings
D) Home Improvement Loans
F) Non-occupant Loans on < 5 Family Dwellings (A B C & D)
Number
Average Value
Number
Average Value
Number
Average Value
Number
Average Value
Number
Average Value
LOANS ORIGINATED
4
$89,932
54
$50,731
60
$82,991
14
$11,287
8
$38,595
APPLICATIONS APPROVED, NOT ACCEPTED
0
$0
17
$41,508
10
$78,573
1
$2,180
1
$32,040
APPLICATIONS DENIED
1
$90,300
49
$52,475
58
$62,387
12
$21,785
1
$34,230
APPLICATIONS WITHDRAWN
0
$0
8
$73,366
22
$64,644
1
$12,380
0
$0
FILES CLOSED FOR INCOMPLETENESS
0
$0
1
$72,090
7
$61,897
0
$0
1
$34,950
Aggregated Statistics For Year 2000 (Based on 2 partial tracts)
A) FHA, FSA/RHS & VA Home Purchase Loans
B) Conventional Home Purchase Loans
C) Refinancings
D) Home Improvement Loans
F) Non-occupant Loans on < 5 Family Dwellings (A B C & D)
Number
Average Value
Number
Average Value
Number
Average Value
Number
Average Value
Number
Average Value
LOANS ORIGINATED
4
$75,188
39
$46,325
41
$62,004
14
$10,559
4
$40,050
APPLICATIONS APPROVED, NOT ACCEPTED
3
$31,557
18
$51,621
15
$44,760
3
$15,777
1
$18,200
APPLICATIONS DENIED
4
$45,512
97
$41,200
74
$50,039
7
$25,174
8
$41,599
APPLICATIONS WITHDRAWN
1
$23,300
7
$39,010
25
$64,839
1
$16,750
1
$71,360
FILES CLOSED FOR INCOMPLETENESS
0
$0
0
$0
4
$52,795
0
$0
0
$0
Aggregated Statistics For Year 1999 (Based on 1 full and 1 partial tracts)
A) FHA, FSA/RHS & VA Home Purchase Loans
B) Conventional Home Purchase Loans
C) Refinancings
D) Home Improvement Loans
F) Non-occupant Loans on < 5 Family Dwellings (A B C & D)
Detailed PMIC statistics for the following Tracts:0103.00
2002 - 2018 National Fire Incident Reporting System (NFIRS) incidents
According to the data from the years 2002 - 2018 the average number of fire incidents per year is 36. The highest number of reported fires - 95 took place in 2010, and the least - 16 in 2017. The data has a rising trend.
When looking into fire subcategories, the most reports belonged to: Outside Fires (41.4%), and Structure Fires (27.4%).
Fire incident types reported to NFIRS in Zip Code 29448

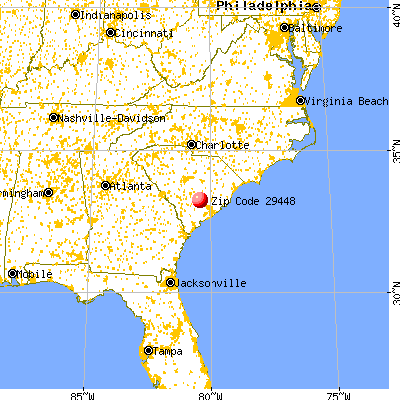


 Nearest zip codes: 29059, 29437, 29477, 29163, 29048, 29018.


 According to the data from the years 2002 - 2018 the average number of fire incidents per year is 36. The highest number of reported fires - 95 took place in 2010, and the least - 16 in 2017. The data has a rising trend.
 When looking into fire subcategories, the most reports belonged to: Outside Fires (41.4%), and Structure Fires (27.4%).