Estimated zip code population in 2022: 4,497 Zip code population in 2010: 4,205 Zip code population in 2000: 4,601
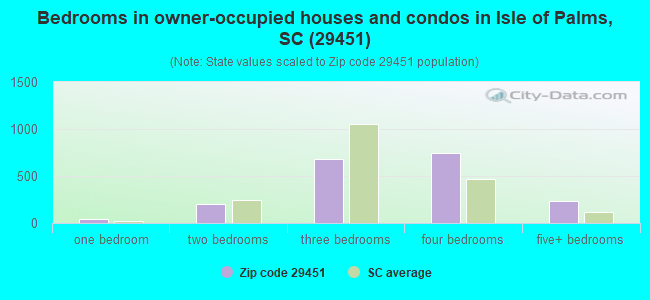
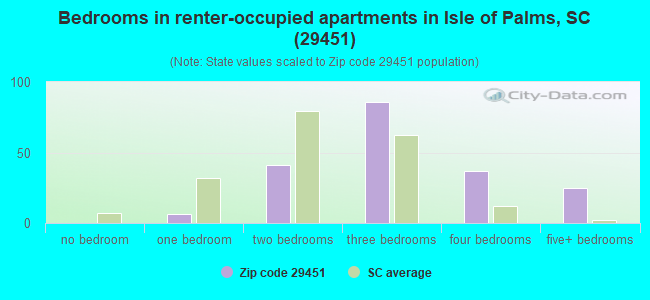
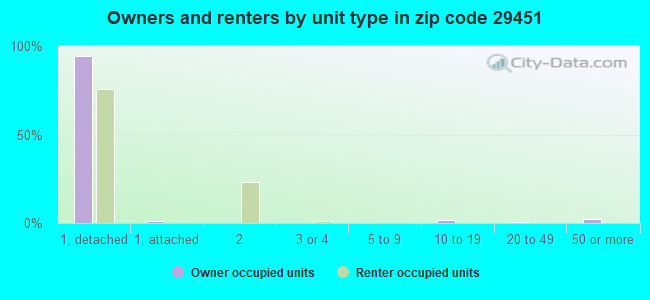
Houses and condos: 4,629 Renter-occupied apartments: 197
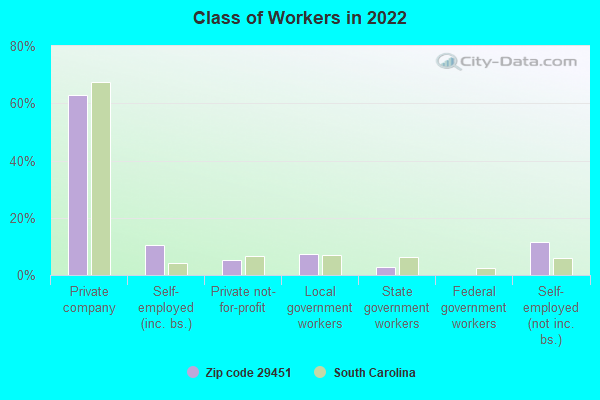
% of renters here:
9%
State:
28%
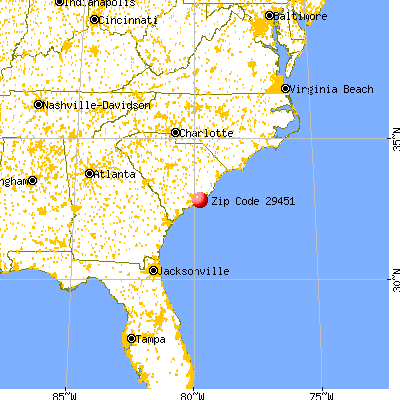
March 2022 cost of living index in zip code 29451: 102.7 (near average, U.S. average is 100)
Land area: 10.0 sq. mi. Water area: 6.5 sq. mi.
Population density: 449 people per square mile
(low).
OSM Map
General Map
Google Map
MSN Map
OSM Map
General Map
Google Map
MSN Map
OSM Map
General Map
Google Map
MSN Map
OSM Map
General Map
Google Map
MSN Map
Please wait while loading the map...
Real estate property taxes paid for housing units in 2022:
This zip code:
0.3% ($3,657)
South Carolina:
0.5% ($1,185)
Median real estate property taxes paid for housing units with mortgages in 2022: $3,205 (0.3%) Median real estate property taxes paid for housing units with no mortgage in 2022: $4,537 (0.3%)
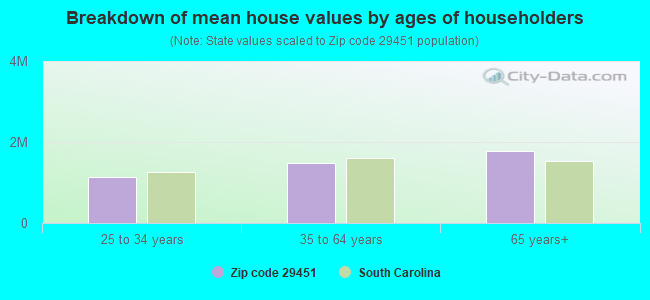
Estimated median house/condo value in 2022: $1,264,050
29451:
$1,264,050
South Carolina:
$254,600
According to our research of South Carolina and other state lists, there was 1 registered sex offender living in 29451 zip code as of May 28, 2024. The ratio of all residents to sex offenders in zip code 29451 is 4,435 to 1. The ratio of registered sex offenders to all residents in this zip code is much lower than the state average.
Median resident age:
This zip code:
52.5 years
South Carolina median age:
40.5 years
Average household size:
This zip code:
2.2 people
South Carolina:
2.4 people
Averages for the 2020 tax year for zip code 29451, filed in 2021:
Average Adjusted Gross Income (AGI) in 2020: $264,003 (Individual Income Tax Returns)
Here:
$264,003
State:
$65,754
Salary/wage: $165,913 (reported on 65.3% of returns)
Here:
$165,913
State:
$52,566
(% of AGI for various income ranges: 1165.4% for AGIs below $25k, 3784.3% for AGIs $25k-50k, 6468.0% for AGIs $50k-75k, 6757.5% for AGIs $75k-100k, 15027.2% for AGIs $100k-200k, 141049.3% for AGIs over 200k)
Taxable interest for individuals: $6,186 (reported on 59.8% of returns)
This zip code:
$6,186
South Carolina:
$1,749
(% of AGI for various income ranges: 35.4% for AGIs below $25k, 140.7% for AGIs $25k-50k, 271.0% for AGIs $50k-75k, 281.2% for AGIs $75k-100k, 721.1% for AGIs $100k-200k, 4508.7% for AGIs over 200k)
Ordinary dividends: $26,722 (reported on 58.6% of returns)
Here:
$26,722
State:
$8,783
(% of AGI for various income ranges: 198.8% for AGIs below $25k, 512.9% for AGIs $25k-50k, 1025.0% for AGIs $50k-75k, 1161.2% for AGIs $75k-100k, 3281.7% for AGIs $100k-200k, 18876.7% for AGIs over 200k)
Net capital gain/loss in AGI: +$103,779 (reported on 56.9% of returns)
Here:
+$103,779
State:
+$24,194
(% of AGI for various income ranges: 92.7% for AGIs below $25k, 467.9% for AGIs $25k-50k, 598.0% for AGIs $50k-75k, 1530.0% for AGIs $75k-100k, 3150.0% for AGIs $100k-200k, 88501.3% for AGIs over 200k)
Profit/loss from business: +$35,972 (reported on 25.1% of returns)
Here:
+$35,972
State:
+$11,253
(% of AGI for various income ranges: 267.3% for AGIs below $25k, 425.0% for AGIs $25k-50k, 623.0% for AGIs $50k-75k, 1146.2% for AGIs $75k-100k, 2574.4% for AGIs $100k-200k, 9412.7% for AGIs over 200k)
Taxable individual retirement arrangement distribution: $49,775 (reported on 18.4% of returns)
29451:
$49,775
South Carolina:
$21,604
(% of AGI for various income ranges: 111.9% for AGIs below $25k, 433.6% for AGIs $25k-50k, 647.0% for AGIs $50k-75k, 1217.5% for AGIs $75k-100k, 3200.6% for AGIs $100k-200k, 9080.7% for AGIs over 200k)
Self-employed (Keogh) retirement plans: $37,462 (reported on 3.3% of returns)
29451:
$37,462
South Carolina:
$25,038
(% of AGI for various income ranges: 482.0% for AGIs $50k-75k, 1676.7% for AGIs over 200k)
Total itemized deductions: $51,806 (reported on 33.5% of returns)
Here:
$51,806
State:
$35,199
(% of AGI for various income ranges: 1278.6% for AGIs $25k-50k, 1249.0% for AGIs $50k-75k, 1508.8% for AGIs $75k-100k, 4039.4% for AGIs $100k-200k, 19952.0% for AGIs over 200k)
Charity contributions: $22,324 (reported on 29.3% of returns)
Here:
$22,324
State:
$14,319
(% of AGI for various income ranges: 80.0% for AGIs $25k-50k, 190.0% for AGIs $50k-75k, 191.2% for AGIs $75k-100k, 706.7% for AGIs $100k-200k, 9266.7% for AGIs over 200k)
Taxes paid: $9,039 (reported on 33.5% of returns)
29451:
$9,039
State:
$7,486
(% of AGI for various income ranges: 26.9% for AGIs below $25k, 121.4% for AGIs $25k-50k, 222.0% for AGIs $50k-75k, 276.2% for AGIs $75k-100k, 999.4% for AGIs $100k-200k, 3166.0% for AGIs over 200k)
Earned income credit: $1,340 (reported on 4.2% of returns)
Here:
$1,340
State:
$2,397
(% of AGI for various income ranges: 51.5% for AGIs below $25k)
Percentage of individuals using paid preparers for their 2020 taxes: 91.6%
Here:
92%
State:
93%
(% for various income ranges: 89.8% for AGIs below $25k, 88.5% for AGIs $25k-50k, 90.9% for AGIs $50k-75k, 88.2% for AGIs $75k-100k, 90.0% for AGIs $100k-200k, 96.0% for AGIs over 200k)
Averages for the 2012 tax year for zip code 29451, filed in 2013:
Average Adjusted Gross Income (AGI) in 2012: $155,550 (Individual Income Tax Returns)
Here:
$155,550
State:
$51,133
Salary/wage: $93,454 (reported on 70.1% of returns)
Here:
$93,454
State:
$42,173
(% of AGI for various income ranges: 72.3% for AGIs below $25k, 60.0% for AGIs $25k-50k, 47.9% for AGIs $50k-75k, 43.6% for AGIs $75k-100k, 51.7% for AGIs $100k-200k, 37.2% for AGIs over 200k)
Taxable interest for individuals: $4,534 (reported on 55.2% of returns)
This zip code:
$4,534
South Carolina:
$1,468
(% of AGI for various income ranges: 2.7% for AGIs below $25k, 2.6% for AGIs $25k-50k, 2.1% for AGIs $50k-75k, 1.8% for AGIs $75k-100k, 1.5% for AGIs $100k-200k, 1.5% for AGIs over 200k)
Ordinary dividends: $14,834 (reported on 48.9% of returns)
Here:
$14,834
State:
$6,511
(% of AGI for various income ranges: 7.4% for AGIs below $25k, 4.5% for AGIs $25k-50k, 6.1% for AGIs $50k-75k, 5.1% for AGIs $75k-100k, 4.9% for AGIs $100k-200k, 4.4% for AGIs over 200k)
Net capital gain/loss in AGI: +$29,806 (reported on 44.8% of returns)
Here:
+$29,806
State:
+$13,061
(% of AGI for various income ranges: 1.8% for AGIs $25k-50k, 2.0% for AGIs $50k-75k, 2.6% for AGIs $75k-100k, 3.9% for AGIs $100k-200k, 11.4% for AGIs over 200k)
Profit/loss from business: +$21,962 (reported on 24.0% of returns)
Here:
+$21,962
State:
+$10,167
(% of AGI for various income ranges: 9.1% for AGIs below $25k, 9.2% for AGIs $25k-50k, 7.7% for AGIs $50k-75k, 7.0% for AGIs $75k-100k, 3.3% for AGIs $100k-200k, 2.4% for AGIs over 200k)
Taxable individual retirement arrangement distribution: $38,608 (reported on 22.2% of returns)
29451:
$38,608
South Carolina:
$17,019
(% of AGI for various income ranges: 4.2% for AGIs below $25k, 6.3% for AGIs $25k-50k, 7.5% for AGIs $50k-75k, 11.8% for AGIs $75k-100k, 9.3% for AGIs $100k-200k, 3.8% for AGIs over 200k)
Self-employment retirement plans: $21,900 (reported on 3.2% of returns)
29451:
$21,900
South Carolina:
$21,023
Total itemized deductions: $43,462 (17% of AGI, reported on 55.7% of returns)
Here:
$43,462
State:
$22,890
Here:
17.2% of AGI
State:
21.4% of AGI
(% of AGI for various income ranges: 32.5% for AGIs below $25k, 20.1% for AGIs $25k-50k, 21.9% for AGIs $50k-75k, 20.4% for AGIs $75k-100k, 20.9% for AGIs $100k-200k, 12.5% for AGIs over 200k)
Charity contributions: $6,711 (reported on 50.2% of returns)
Here:
$6,711
State:
$5,169
(% of AGI for various income ranges: 2.6% for AGIs below $25k, 2.3% for AGIs $25k-50k, 2.2% for AGIs $50k-75k, 2.2% for AGIs $75k-100k, 2.8% for AGIs $100k-200k, 2.0% for AGIs over 200k)
Taxes paid: $17,891 (reported on 55.7% of returns)
29451:
$17,891
State:
$7,644
(% of AGI for various income ranges: 5.2% for AGIs below $25k, 4.0% for AGIs $25k-50k, 5.7% for AGIs $50k-75k, 5.0% for AGIs $75k-100k, 7.5% for AGIs $100k-200k, 6.4% for AGIs over 200k)
Earned income credit: $1,318 (reported on 5.0% of returns)
Here:
$1,318
State:
$2,418
(% of AGI for various income ranges: 1.7% for AGIs below $25k, 0.3% for AGIs $25k-50k)
Percentage of individuals using paid preparers for their 2012 taxes: 63.8%
Here:
64%
State:
57%
(% for various income ranges: 52.5% for AGIs below $25k, 54.5% for AGIs $25k-50k, 57.7% for AGIs $50k-75k, 66.7% for AGIs $75k-100k, 71.1% for AGIs $100k-200k, 85.7% for AGIs over 200k)
Averages for the 2004 tax year for zip code 29451, filed in 2005:
Average Adjusted Gross Income (AGI) in 2004: $112,543 (Individual Income Tax Returns)
Here:
$112,543
State:
$41,965
Salary/wage: $75,810 (reported on 71.7% of returns)
Here:
$75,810
State:
$35,695
(% of AGI for various income ranges: 67.7% for AGIs $10k-25k, 60.5% for AGIs $25k-50k, 54.1% for AGIs $50k-75k, 56.1% for AGIs $75k-100k, 44.4% for AGIs over 100k)
Taxable interest for individuals: $4,487 (reported on 64.5% of returns)
This zip code:
$4,487
South Carolina:
$1,623
(% of AGI for various income ranges: 4.0% for AGIs $10k-25k, 2.8% for AGIs $25k-50k, 3.8% for AGIs $50k-75k, 2.9% for AGIs $75k-100k, 2.3% for AGIs over 100k)
Taxable dividends: $9,443 (reported on 52.8% of returns)
Here:
$9,443
State:
$3,999
(% of AGI for various income ranges: 5.5% for AGIs $10k-25k, 5.2% for AGIs $25k-50k, 3.8% for AGIs $50k-75k, 4.2% for AGIs $75k-100k, 4.1% for AGIs over 100k)
Net capital gain/loss: +$41,531 (reported on 47.0% of returns)
Here:
+$41,531
State:
+$13,100
(% of AGI for various income ranges: 2.8% for AGIs $10k-25k, 2.2% for AGIs $25k-50k, 2.9% for AGIs $50k-75k, 6.2% for AGIs $75k-100k, 20.8% for AGIs over 100k)
Profit/loss from business: +$24,772 (reported on 22.4% of returns)
Here:
+$24,772
State:
+$9,144
(% of AGI for various income ranges: 8.9% for AGIs $10k-25k, 9.0% for AGIs $25k-50k, 5.7% for AGIs $50k-75k, 6.1% for AGIs $75k-100k, 4.6% for AGIs over 100k)
IRA payment deduction: $4,082 (reported on 4.3% of returns)
29451:
$4,082
South Carolina:
$2,972
(% of AGI for various income ranges: 0.6% for AGIs $10k-25k, 0.7% for AGIs $25k-50k, 0.3% for AGIs $75k-100k, 0.1% for AGIs over 100k)
Self-employed pension: $20,768 (reported on 3.6% of returns)
Here:
$20,768
South Carolina:
$15,117
Total itemized deductions: $36,636 (20% of AGI, reported on 55.1% of returns)
Here:
$36,636
State:
$19,039
Here:
19.7% of AGI
State:
22.8% of AGI
(% of AGI for various income ranges: 26.0% for AGIs $10k-25k, 23.4% for AGIs $25k-50k, 24.7% for AGIs $50k-75k, 25.4% for AGIs $75k-100k, 15.7% for AGIs over 100k)
Charity contributions deductions: $7,183 (4% of AGI, reported on 51.0% of returns)
Here:
$7,183
State:
$4,305
Here:
3.7% of AGI
State:
5.0% of AGI
(% of AGI for various income ranges: 2.2% for AGIs $10k-25k, 2.8% for AGIs $25k-50k, 2.9% for AGIs $50k-75k, 3.2% for AGIs $75k-100k, 3.3% for AGIs over 100k)
Total tax: $24,501 (reported on 83.0% of returns)
29451:
$24,501
State:
$6,497
(% of AGI for various income ranges: 5.6% for AGIs $10k-25k, 8.4% for AGIs $25k-50k, 9.1% for AGIs $50k-75k, 9.9% for AGIs $75k-100k, 20.4% for AGIs over 100k)
Earned income credit: $1,000 (reported on 3.8% of returns)
Here:
$1,000
State:
$1,882
Percentage of individuals using paid preparers for their 2004 taxes: 64.1%
Here:
64%
State:
66%
(% for various income ranges: 54.8% for AGIs below $10k, 52.3% for AGIs $10k-25k, 66.4% for AGIs $25k-50k, 62.5% for AGIs $50k-75k, 61.2% for AGIs $75k-100k, 77.2% for AGIs over 100k)
Household received Food Stamps/SNAP in the past 12 months: 0 Household did not receive Food Stamps/SNAP in the past 12 months: 2,065
Women who had a birth in the past 12 months: 100 (87 now married, 17 unmarried) Women who did not have a birth in the past 12 months: 612 (442 now married, 176 unmarried)
Housing units in zip code 29451 with a mortgage: 1,188 (198 second mortgage, 194 both second mortgage and home equity loan) Houses without a mortgage: 36
Median monthly owner costs for units with a mortgage: $3,252 Median monthly owner costs for units without a mortgage: $1,170
Residents with income below the poverty level in 2022:
This zip code:
2.1%
Whole state:
14.0%
Residents with income below 50% of the poverty level in 2022:
This zip code:
0.3%
Whole state:
7.3%
Median number of rooms in houses and condos:
Here:
7.2
State:
6.4
Median number of rooms in apartments:
Here:
6.0
State:
4.5
Notable locations in this zip code not listed on our city pages
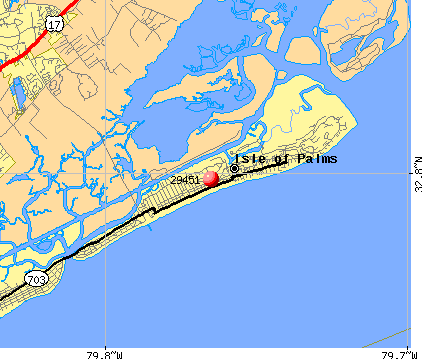
Notable locations in zip code 29451: Isle of Palms Marina (A), Island Palm Marina (B), Citadel Beach Club (C), Isle of Palms Fire Department Station 3 (D), Dewees Island Fire Department (E), Isle of Palms Fire Department Station 2 (F), Isle of Palms Fire Department Station 1 (G), Isle of Palms Police Department (H), Isle of Palms City Hall (I). Display/hide their locations on the map
Creeks: Watermelon Creek (A), Old House Creek (B), Morgan Creek (C), Long Creek (D), Horsebend Creek (E), Dewees Creek (F), Cedar Creek (G). Display/hide their locations on the map
Size of family households: 896 2-persons, 269 3-persons, 163 4-persons, 133 5-persons
Size of nonfamily households: 583 1-person, 21 2-persons, 10 3-persons
727 married couples with children.
16 single-parent households (16 men).
91.9% of residents of 29451 zip code speak English at home.
1.4% of residents speak Spanish at home (81% very well, 19% well).
4.5% of residents speak other Indo-European language at home (100% very well).
2.9% of residents speak Asian or Pacific Island language at home (100% very well).
0.3% of residents speak other language at home (100% very well).
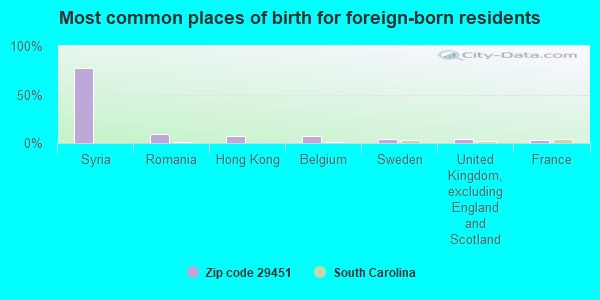
Foreign born population: 317 (7.1%) (88.4% of them are naturalized citizens)
This zip code:
7.1%
Whole state:
5.2%
78%Syria
9%Romania
7%Hong Kong
7%Belgium
4%Sweden
4%United Kingdom, excluding England and Scotland
3%France
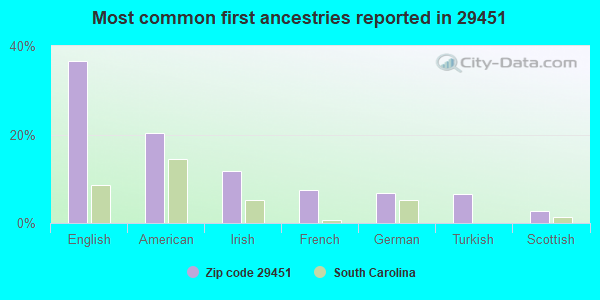
37%English
20%American
12%Irish
7%French
7%German
7%Turkish
3%Scottish
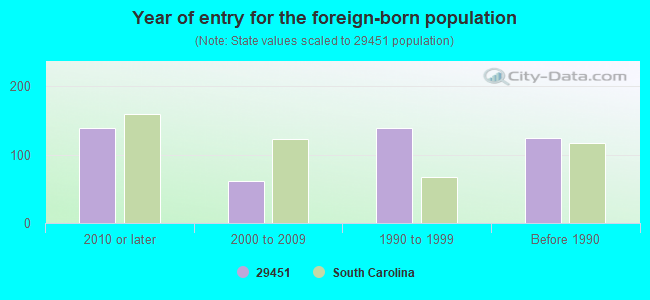
Year of entry for the foreign-born population
1392010 or later
622000 to 2009
1391990 to 1999
125Before 1990
Facilities with environmental interests located in this zip code:
DEWEES ISLAND, TOWN OF WTP (273 OLD HOUSE LANE in DEWEES ISLAND, SC)
National Pollutant Discharge Elimination System NON-MAJOR (Tracking pollutant discharge elimination systems) - permit STATE MASTER (South Carolina database) - National Pollutant Discharge Elimination System Permit STATE MASTER (South Carolina database) - LABORATORY CERTIFICATION Business SIC classification: WATER SUPPLY Organizations: DEWEES ISLAND, TOWN OF WTP (CONTACT/OWNER)
Alternative names: DEWEES ISLAND WATER LAB
CAROLINA MARINE SERVICE (80 41ST AVE in ISLE OF PALMS, SC)
Conditionally Exempt Small Quantity Generators, less than 100 kg/month of hazardous waste (Resource Conservation and Recovery Act (tracking hazardous waste)) - notification STATE MASTER (South Carolina database) - HAZARDOUS WASTE PROGRAM STATE MASTER (South Carolina database) - 401 CERTIFICATION Organizations: OPERNAME (CONTACT/OPERATOR)
, KENNETH M OWENS (CONTACT/OWNER)
BOB FLETCHER PAINTING (35 22ND AVE in ISLE OF PALMS, SC)
Conditionally Exempt Small Quantity Generators, less than 100 kg/month of hazardous waste (Resource Conservation and Recovery Act (tracking hazardous waste)) - notification STATE MASTER (South Carolina database) - HAZARDOUS WASTE PROGRAM Organizations: ROBERT FLETCHER (CONTACT/OWNER)
Housing units lacking complete plumbing facilities: 0.1% Housing units lacking complete kitchen facilities: 0.5%
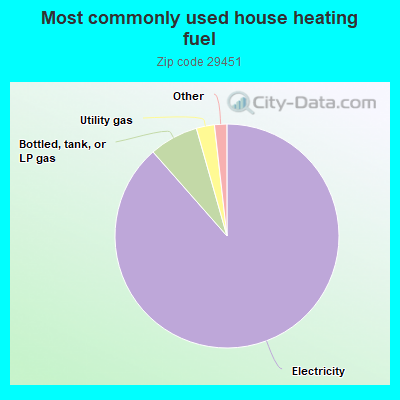
88.7%Electricity
7.1%Bottled, tank, or LP gas
2.6%Utility gas
0.9%Solar energy
0.8%No fuel used
Population in 1990: 3,680. Population change in the 1990s: +921 (+25.0%).
Place of birth for U.S.-born residents:
This state: 1,408
Northeast: 683
Midwest: 658
South: 1,188
West: 130
52% of the 29451 zip code residents lived in the same house 5 years ago. Out of people who lived in different houses, 39% lived in this county. Out of people who lived in different counties, 50% lived in South Carolina.
88% of the 29451 zip code residents lived in the same house 1 year ago. Out of people who lived in different houses, 39% moved from this county. Out of people who lived in different houses, 7% moved from different county within same state. Out of people who lived in different houses, 56% moved from different state.
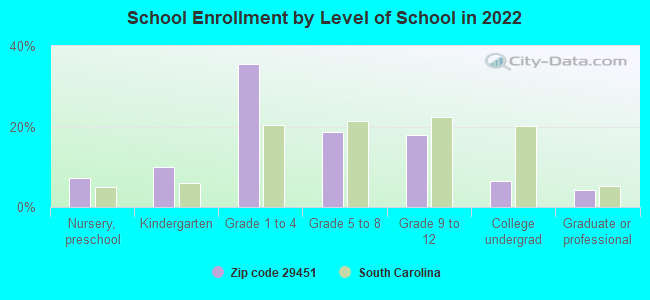
Private vs. public school enrollment:
Students in private schools in grades 1 to 8 (elementary and middle school): 64
Here:
17.6%
South Carolina:
14.4%
Students in private schools in grades 9 to 12 (high school): 11
Here:
10.1%
South Carolina:
11.1%
Students in private undergraduate colleges: 26
Here:
58.3%
South Carolina:
21.9%
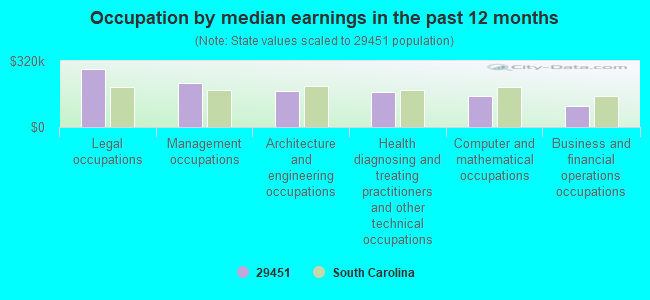
Occupation by median earnings in the past 12 months ($)
282,444Legal occupations
213,667Management occupations
176,176Architecture and engineering occupations
170,091Health diagnosing and treating practitioners and other technical occupations
148,129Computer and mathematical occupations
103,685Business and financial operations occupations
Companies with federal contracts located in this zip code:
CAROL VARADI AND ASSOCIATES IN (3 LIVE OAK DRIVE in ISLE OF PALMS, SC; small business) : $124,487 in 3 contractsfrom 2000 to 2003
$125,000 with Department of Defense for Education Services. Signed on 2000-12-01. Completion date: 2001-09-30.
$30,000, same as above.Signed on 2001-01-11. Completion date: 2001-09-30.
-$30,513, same as above.Signed on 2003-03-03. Completion date: 2002-09-09.
BEARD CONSULTING (7 BAY COURT in ISLE OF PALMS, SC; small business) : $61,680 in 4 contractsfrom 2003 to 2005
$35,000 with Army for Educational Services. Taking place in VA. Signed on 2003-12-11. Completion date: 2004-09-10.
$18,680, same as above.Signed on 2004-03-22. Completion date: 2004-09-10.
$8,000 with Army for Education Services. Taking place in VA. Signed on 2005-02-14. Completion date: 2005-09-30.
$0 with Army for Educational Services. Taking place in VA. Signed on 2003-12-11. Completion date: 2004-09-10.
Top industries in this zip code by the number of employees in 2005:
Other Services (except Public Administration): Other Similar Organizations (except Business, Professional, Labor, and Political Organizations) (20-49: 1, 5-9: 2, 1-4: 3)
Construction: New Single-Family Housing Construction (except Operative Builders) (5-9: 2, 1-4: 11)
Administrative and Support and Waste Management and Remediation Services: Landscaping Services (20-49: 1, 1-4: 1)
Arts, Entertainment, and Recreation: Other Gambling Industries (20-49: 1)
Other Services (except Public Administration): Drycleaning and Laundry Services (except Coin-Operated) (20-49: 1)
Fatal accident statistics in 2010:
Fatal accident count: 1
Vehicles involved in fatal accidents: 1
Fatal accidents caused by drunken drivers: 0
Fatalities: 1
Persons involved in fatal accidents: 2
Pedestrians involved in fatal accidents: 0
Home Mortgage Disclosure Act Aggregated Statistics For Year 2009 (Based on 18 partial tracts)
A) FHA, FSA/RHS & VA Home Purchase Loans
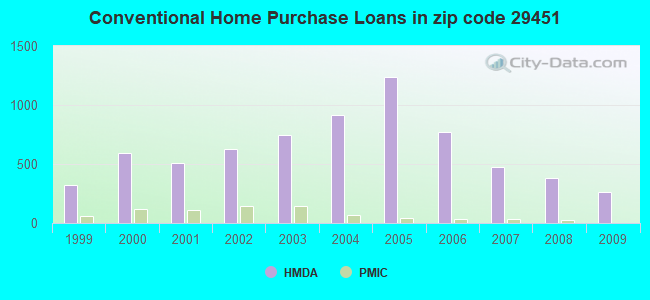
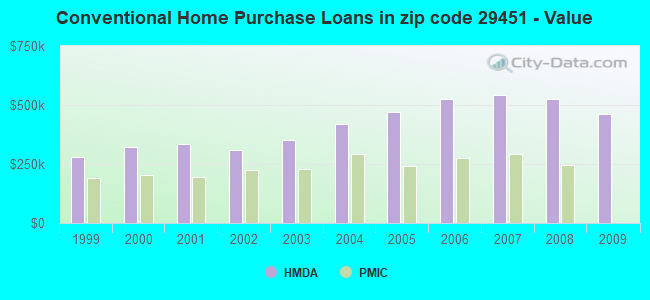
B) Conventional Home Purchase Loans
C) Refinancings
D) Home Improvement Loans
F) Non-occupant Loans on < 5 Family Dwellings (A B C & D)
G) Loans On Manufactured Home Dwelling (A B C & D)
Number
Average Value
Number
Average Value
Number
Average Value
Number
Average Value
Number
Average Value
Number
Average Value
LOANS ORIGINATED
34
$259,751
265
$463,807
890
$367,190
10
$172,098
434
$483,876
2
$65,890
APPLICATIONS APPROVED, NOT ACCEPTED
1
$291,830
16
$428,176
39
$284,885
0
$0
21
$441,658
1
$84,420
APPLICATIONS DENIED
9
$251,036
41
$496,590
265
$516,582
5
$142,570
126
$642,577
2
$77,280
APPLICATIONS WITHDRAWN
4
$256,308
47
$444,570
202
$384,573
1
$188,750
90
$396,507
0
$0
FILES CLOSED FOR INCOMPLETENESS
1
$208,930
10
$874,097
36
$380,426
2
$103,800
14
$663,689
0
$0
Aggregated Statistics For Year 2008 (Based on 18 partial tracts)
A) FHA, FSA/RHS & VA Home Purchase Loans
B) Conventional Home Purchase Loans
C) Refinancings
D) Home Improvement Loans
F) Non-occupant Loans on < 5 Family Dwellings (A B C & D)
G) Loans On Manufactured Home Dwelling (A B C & D)
Number
Average Value
Number
Average Value
Number
Average Value
Number
Average Value
Number
Average Value
Number
Average Value
LOANS ORIGINATED
21
$241,633
383
$524,661
461
$458,578
33
$324,994
421
$599,257
1
$71,290
APPLICATIONS APPROVED, NOT ACCEPTED
1
$234,450
38
$529,159
53
$348,055
4
$83,862
31
$409,584
0
$0
APPLICATIONS DENIED
2
$210,380
101
$576,121
151
$518,221
15
$205,267
92
$622,620
4
$57,995
APPLICATIONS WITHDRAWN
2
$171,840
67
$632,655
104
$493,956
3
$292,960
80
$617,361
0
$0
FILES CLOSED FOR INCOMPLETENESS
0
$0
9
$598,557
30
$498,484
0
$0
12
$791,387
0
$0
Aggregated Statistics For Year 2007 (Based on 18 partial tracts)
A) FHA, FSA/RHS & VA Home Purchase Loans
B) Conventional Home Purchase Loans
C) Refinancings
D) Home Improvement Loans
E) Loans on Dwellings For 5+ Families
F) Non-occupant Loans on < 5 Family Dwellings (A B C & D)
G) Loans On Manufactured Home Dwelling (A B C & D)
Number
Average Value
Number
Average Value
Number
Average Value
Number
Average Value
Number
Average Value
Number
Average Value
Number
Average Value
LOANS ORIGINATED
1
$233,700
472
$544,157
563
$613,151
38
$513,746
2
$1,786,820
445
$743,325
3
$62,017
APPLICATIONS APPROVED, NOT ACCEPTED
0
$0
31
$428,207
94
$492,054
3
$253,307
0
$0
40
$560,001
2
$54,030
APPLICATIONS DENIED
1
$208,160
74
$562,283
208
$660,820
24
$382,919
0
$0
94
$865,735
3
$97,607
APPLICATIONS WITHDRAWN
0
$0
42
$496,500
128
$659,296
11
$228,665
0
$0
47
$756,484
0
$0
FILES CLOSED FOR INCOMPLETENESS
0
$0
10
$685,360
54
$590,047
4
$165,092
0
$0
15
$896,123
0
$0
Aggregated Statistics For Year 2006 (Based on 18 partial tracts)
A) FHA, FSA/RHS & VA Home Purchase Loans
B) Conventional Home Purchase Loans
C) Refinancings
D) Home Improvement Loans
F) Non-occupant Loans on < 5 Family Dwellings (A B C & D)
G) Loans On Manufactured Home Dwelling (A B C & D)
Number
Average Value
Number
Average Value
Number
Average Value
Number
Average Value
Number
Average Value
Number
Average Value
LOANS ORIGINATED
2
$251,825
768
$525,904
672
$608,125
45
$208,556
622
$703,173
6
$584,463
APPLICATIONS APPROVED, NOT ACCEPTED
0
$0
63
$469,465
46
$383,583
10
$325,729
48
$575,287
4
$65,265
APPLICATIONS DENIED
1
$72,150
124
$564,020
209
$623,984
18
$127,697
106
$736,539
7
$65,943
APPLICATIONS WITHDRAWN
0
$0
81
$575,387
158
$607,560
5
$127,220
87
$848,057
0
$0
FILES CLOSED FOR INCOMPLETENESS
0
$0
11
$439,675
24
$402,063
1
$58,560
12
$435,799
0
$0
Aggregated Statistics For Year 2005 (Based on 18 partial tracts)
A) FHA, FSA/RHS & VA Home Purchase Loans
B) Conventional Home Purchase Loans
C) Refinancings
D) Home Improvement Loans
E) Loans on Dwellings For 5+ Families
F) Non-occupant Loans on < 5 Family Dwellings (A B C & D)
G) Loans On Manufactured Home Dwelling (A B C & D)
Number
Average Value
Number
Average Value
Number
Average Value
Number
Average Value
Number
Average Value
Number
Average Value
Number
Average Value
LOANS ORIGINATED
3
$191,030
1,241
$469,953
733
$472,650
40
$274,877
2
$520,425
963
$542,492
2
$68,235
APPLICATIONS APPROVED, NOT ACCEPTED
0
$0
101
$492,009
61
$346,189
6
$289,820
0
$0
65
$510,359
4
$54,145
APPLICATIONS DENIED
1
$27,180
209
$606,928
155
$494,771
14
$97,439
0
$0
118
$696,115
8
$64,601
APPLICATIONS WITHDRAWN
1
$109,750
116
$382,977
121
$378,437
11
$164,948
0
$0
85
$452,758
1
$47,440
FILES CLOSED FOR INCOMPLETENESS
0
$0
19
$366,658
51
$368,716
3
$52,967
0
$0
18
$474,085
1
$99,000
Aggregated Statistics For Year 2004 (Based on 18 partial tracts)
A) FHA, FSA/RHS & VA Home Purchase Loans
B) Conventional Home Purchase Loans
C) Refinancings
D) Home Improvement Loans
E) Loans on Dwellings For 5+ Families
F) Non-occupant Loans on < 5 Family Dwellings (A B C & D)
G) Loans On Manufactured Home Dwelling (A B C & D)
Number
Average Value
Number
Average Value
Number
Average Value
Number
Average Value
Number
Average Value
Number
Average Value
Number
Average Value
LOANS ORIGINATED
2
$176,450
913
$421,131
713
$344,206
38
$297,916
2
$899,395
705
$454,844
3
$60,790
APPLICATIONS APPROVED, NOT ACCEPTED
0
$0
66
$504,207
93
$420,852
2
$84,985
0
$0
49
$620,508
4
$70,102
APPLICATIONS DENIED
0
$0
113
$451,844
172
$386,636
15
$94,644
0
$0
78
$527,301
13
$68,371
APPLICATIONS WITHDRAWN
0
$0
69
$438,598
133
$325,946
3
$54,217
0
$0
43
$563,802
2
$280,830
FILES CLOSED FOR INCOMPLETENESS
0
$0
24
$369,924
51
$395,823
3
$31,623
0
$0
10
$815,759
1
$42,080
Aggregated Statistics For Year 2003 (Based on 18 partial tracts)
A) FHA, FSA/RHS & VA Home Purchase Loans
B) Conventional Home Purchase Loans
C) Refinancings
D) Home Improvement Loans
E) Loans on Dwellings For 5+ Families
F) Non-occupant Loans on < 5 Family Dwellings (A B C & D)
Number
Average Value
Number
Average Value
Number
Average Value
Number
Average Value
Number
Average Value
Number
Average Value
LOANS ORIGINATED
9
$186,936
742
$353,041
1,843
$280,188
17
$267,688
2
$1,004,085
987
$354,511
APPLICATIONS APPROVED, NOT ACCEPTED
0
$0
33
$282,334
141
$282,457
6
$286,210
0
$0
27
$378,723
APPLICATIONS DENIED
0
$0
68
$407,320
217
$294,884
11
$125,443
0
$0
57
$499,359
APPLICATIONS WITHDRAWN
1
$163,450
84
$356,142
165
$277,890
1
$56,280
0
$0
71
$381,797
FILES CLOSED FOR INCOMPLETENESS
0
$0
13
$377,453
38
$304,418
0
$0
0
$0
14
$354,169
Aggregated Statistics For Year 2002 (Based on 18 partial tracts)
A) FHA, FSA/RHS & VA Home Purchase Loans
B) Conventional Home Purchase Loans
C) Refinancings
D) Home Improvement Loans
F) Non-occupant Loans on < 5 Family Dwellings (A B C & D)
Number
Average Value
Number
Average Value
Number
Average Value
Number
Average Value
Number
Average Value
LOANS ORIGINATED
12
$175,915
629
$308,154
1,550
$307,116
17
$50,257
803
$359,236
APPLICATIONS APPROVED, NOT ACCEPTED
0
$0
46
$439,154
123
$337,114
4
$39,695
60
$503,007
APPLICATIONS DENIED
0
$0
42
$219,775
172
$313,814
13
$58,199
54
$463,888
APPLICATIONS WITHDRAWN
2
$121,350
49
$272,662
158
$347,108
0
$0
50
$442,917
FILES CLOSED FOR INCOMPLETENESS
0
$0
10
$347,088
46
$366,207
0
$0
20
$550,508
Aggregated Statistics For Year 2001 (Based on 18 partial tracts)
A) FHA, FSA/RHS & VA Home Purchase Loans
B) Conventional Home Purchase Loans
C) Refinancings
D) Home Improvement Loans
F) Non-occupant Loans on < 5 Family Dwellings (A B C & D)
Number
Average Value
Number
Average Value
Number
Average Value
Number
Average Value
Number
Average Value
LOANS ORIGINATED
13
$159,569
510
$332,808
1,129
$328,058
29
$33,319
586
$404,847
APPLICATIONS APPROVED, NOT ACCEPTED
1
$106,290
24
$305,224
76
$324,787
9
$49,029
28
$408,297
APPLICATIONS DENIED
1
$127,300
31
$184,929
125
$229,696
12
$18,078
28
$335,341
APPLICATIONS WITHDRAWN
2
$184,170
50
$405,357
131
$257,894
4
$70,672
53
$325,720
FILES CLOSED FOR INCOMPLETENESS
0
$0
7
$466,434
19
$287,466
2
$35,510
8
$440,164
Aggregated Statistics For Year 2000 (Based on 18 partial tracts)
A) FHA, FSA/RHS & VA Home Purchase Loans
B) Conventional Home Purchase Loans
C) Refinancings
D) Home Improvement Loans
E) Loans on Dwellings For 5+ Families
F) Non-occupant Loans on < 5 Family Dwellings (A B C & D)
Number
Average Value
Number
Average Value
Number
Average Value
Number
Average Value
Number
Average Value
Number
Average Value
LOANS ORIGINATED
9
$147,063
594
$323,747
272
$304,326
34
$57,798
2
$363,430
375
$391,025
APPLICATIONS APPROVED, NOT ACCEPTED
3
$54,940
46
$309,435
34
$220,285
9
$32,182
0
$0
27
$442,070
APPLICATIONS DENIED
3
$54,403
65
$223,458
89
$228,115
12
$85,581
0
$0
26
$255,346
APPLICATIONS WITHDRAWN
4
$126,048
61
$374,540
49
$201,714
3
$81,160
0
$0
34
$469,943
FILES CLOSED FOR INCOMPLETENESS
0
$0
12
$609,306
14
$253,609
4
$88,720
0
$0
8
$547,239
Aggregated Statistics For Year 1999 (Based on 9 partial tracts)
A) FHA, FSA/RHS & VA Home Purchase Loans
B) Conventional Home Purchase Loans
C) Refinancings
D) Home Improvement Loans
F) Non-occupant Loans on < 5 Family Dwellings (A B C & D)
2002 - 2018 National Fire Incident Reporting System (NFIRS) incidents
Based on the data from the years 2002 - 2018 the average number of fires per year is 17. The highest number of reported fire incidents - 35 took place in 2004, and the least - 1 in 2013. The data has an increasing trend.
When looking into fire subcategories, the most reports belonged to: Structure Fires (41.4%), and Outside Fires (41.4%).
Fire incident types reported to NFIRS in Zip Code 29451


 Nearest zip codes: 29466, 29464, 29482, 29492, 29429, 29401.


 Based on the data from the years 2002 - 2018 the average number of fires per year is 17. The highest number of reported fire incidents - 35 took place in 2004, and the least - 1 in 2013. The data has an increasing trend.
 When looking into fire subcategories, the most reports belonged to: Structure Fires (41.4%), and Outside Fires (41.4%).