Estimated zip code population in 2022: 4,650 Zip code population in 2010: 2,737 Zip code population in 2000: 2,739
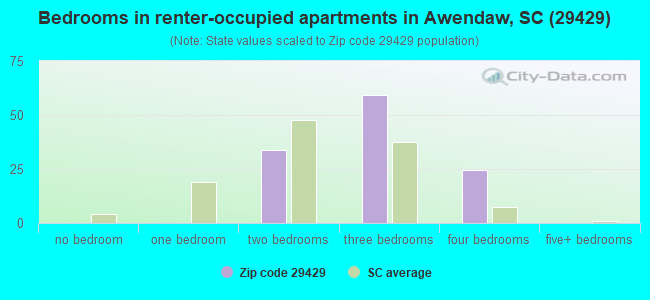
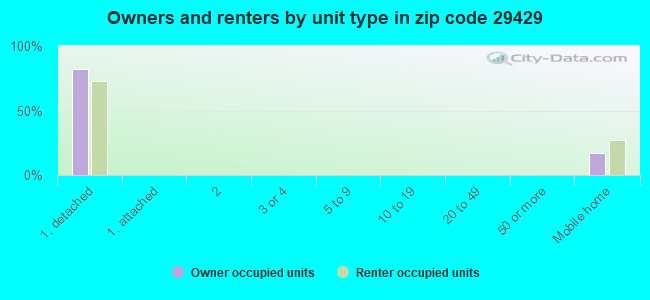
Houses and condos: 1,893 Renter-occupied apartments: 118
% of renters here:
6%
State:
28%
March 2022 cost of living index in zip code 29429: 89.5 (less than average, U.S. average is 100)
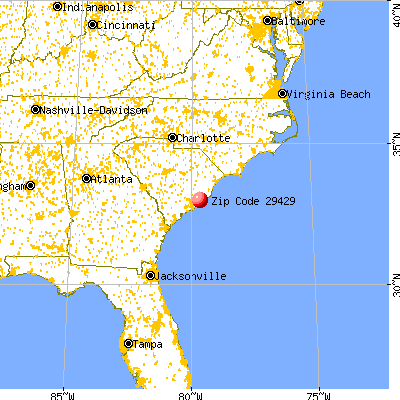
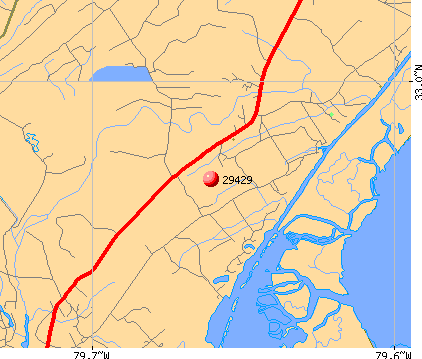
Land area: 108.9 sq. mi. Water area: 23.0 sq. mi.
Population density: 43 people per square mile
(very low).
OSM Map
General Map
Google Map
MSN Map
OSM Map
General Map
Google Map
MSN Map
OSM Map
General Map
Google Map
MSN Map
OSM Map
General Map
Google Map
MSN Map
Please wait while loading the map...
Real estate property taxes paid for housing units in 2022:
This zip code:
0.3% ($1,574)
South Carolina:
0.5% ($1,185)
Median real estate property taxes paid for housing units with mortgages in 2022: $1,949 (0.4%) Median real estate property taxes paid for housing units with no mortgage in 2022: $1,411 (0.3%)
Business Search- 14 Million verified businesses
Males: 2,216
(47.7%)
Females: 2,433
(52.3%)
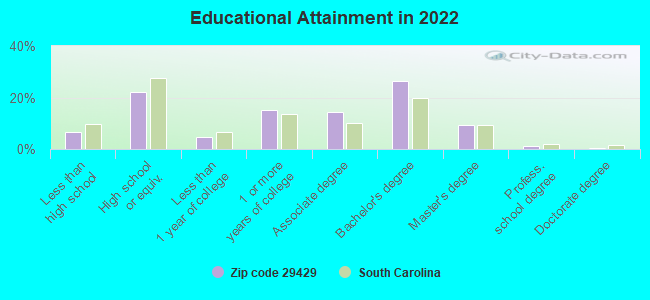
For population 25 years and over in 29429:
High school or higher: 94.1%
Bachelor's degree or higher: 37.4%
Graduate or professional degree: 10.8%
Unemployed: 5.0%
Mean travel time to work (commute): 27.9 minutes
For population 15 years and over in 29429:
Never married: 23.7%
Now married: 60.7%
Separated: 0.5%
Widowed: 6.4%
Divorced: 8.8%
Zip code 29429 compared to state average:
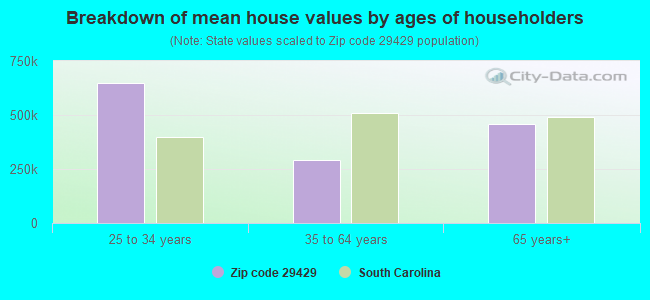
Median house value above state average.
Median age significantly above state average.
Foreign-born population percentage significantly below state average.
Renting percentage significantly below state average.
Length of stay since moving in above state average.
Estimated median house/condo value in 2022: $498,366
29429:
$498,366
South Carolina:
$254,600
Median resident age:
This zip code:
51.2 years
South Carolina median age:
40.5 years
Average household size:
This zip code:
2.5 people
South Carolina:
2.4 people
Averages for the 2020 tax year for zip code 29429, filed in 2021:
Average Adjusted Gross Income (AGI) in 2020: $99,400 (Individual Income Tax Returns)
Here:
$99,400
State:
$65,754
Salary/wage: $71,787 (reported on 78.7% of returns)
Here:
$71,787
State:
$52,566
(% of AGI for various income ranges: 1261.4% for AGIs below $25k, 3435.8% for AGIs $25k-50k, 6646.3% for AGIs $50k-75k, 9883.6% for AGIs $75k-100k, 18895.5% for AGIs $100k-200k, 77776.7% for AGIs over 200k)
Taxable interest for individuals: $1,728 (reported on 29.6% of returns)
This zip code:
$1,728
South Carolina:
$1,749
(% of AGI for various income ranges: 9.8% for AGIs below $25k, 17.7% for AGIs $25k-50k, 58.1% for AGIs $50k-75k, 50.9% for AGIs $75k-100k, 217.5% for AGIs $100k-200k, 708.3% for AGIs over 200k)
Ordinary dividends: $7,573 (reported on 24.1% of returns)
Here:
$7,573
State:
$8,783
(% of AGI for various income ranges: 33.5% for AGIs below $25k, 52.3% for AGIs $25k-50k, 137.5% for AGIs $50k-75k, 266.4% for AGIs $75k-100k, 524.5% for AGIs $100k-200k, 3450.0% for AGIs over 200k)
Net capital gain/loss in AGI: +$38,365 (reported on 23.6% of returns)
Here:
+$38,365
State:
+$24,194
(% of AGI for various income ranges: 9.3% for AGIs below $25k, 65.5% for AGIs $25k-50k, 195.6% for AGIs $50k-75k, 462.7% for AGIs $75k-100k, 678.5% for AGIs $100k-200k, 28573.3% for AGIs over 200k)
Profit/loss from business: +$25,730 (reported on 19.9% of returns)
Here:
+$25,730
State:
+$11,253
(% of AGI for various income ranges: 115.6% for AGIs below $25k, 250.3% for AGIs $25k-50k, 915.6% for AGIs $50k-75k, 414.5% for AGIs $75k-100k, 1126.5% for AGIs $100k-200k, 9361.7% for AGIs over 200k)
Taxable individual retirement arrangement distribution: $29,073 (reported on 10.2% of returns)
29429:
$29,073
South Carolina:
$21,604
(% of AGI for various income ranges: 39.1% for AGIs below $25k, 132.9% for AGIs $25k-50k, 355.0% for AGIs $50k-75k, 488.2% for AGIs $75k-100k, 1040.0% for AGIs $100k-200k, 4385.0% for AGIs over 200k)
Self-employed (Keogh) retirement plans: $25,233 (reported on 1.4% of returns)
29429:
$25,233
South Carolina:
$25,038
(% of AGI for various income ranges: 378.5% for AGIs $100k-200k)
Total itemized deductions: $36,964 (reported on 16.7% of returns)
Here:
$36,964
State:
$35,199
(% of AGI for various income ranges: 141.4% for AGIs below $25k, 569.4% for AGIs $50k-75k, 884.5% for AGIs $75k-100k, 1945.0% for AGIs $100k-200k, 11541.7% for AGIs over 200k)
Charity contributions: $13,310 (reported on 13.4% of returns)
Here:
$13,310
State:
$14,319
(% of AGI for various income ranges: 109.4% for AGIs $50k-75k, 134.5% for AGIs $75k-100k, 413.5% for AGIs $100k-200k, 4516.7% for AGIs over 200k)
Taxes paid: $8,246 (reported on 16.2% of returns)
29429:
$8,246
State:
$7,486
(% of AGI for various income ranges: 23.3% for AGIs below $25k, 137.5% for AGIs $50k-75k, 216.4% for AGIs $75k-100k, 531.0% for AGIs $100k-200k, 2110.0% for AGIs over 200k)
Earned income credit: $1,903 (reported on 13.9% of returns)
Here:
$1,903
State:
$2,397
(% of AGI for various income ranges: 83.7% for AGIs below $25k, 68.1% for AGIs $25k-50k)
Percentage of individuals using paid preparers for their 2020 taxes: 91.2%
Here:
91%
State:
93%
(% for various income ranges: 90.9% for AGIs below $25k, 88.4% for AGIs $25k-50k, 92.6% for AGIs $50k-75k, 89.5% for AGIs $75k-100k, 92.3% for AGIs $100k-200k, 95.5% for AGIs over 200k)
Averages for the 2012 tax year for zip code 29429, filed in 2013:
Average Adjusted Gross Income (AGI) in 2012: $63,255 (Individual Income Tax Returns)
Here:
$63,255
State:
$51,133
Salary/wage: $41,177 (reported on 82.2% of returns)
Here:
$41,177
State:
$42,173
(% of AGI for various income ranges: 76.6% for AGIs below $25k, 74.5% for AGIs $25k-50k, 73.0% for AGIs $50k-75k, 66.1% for AGIs $75k-100k, 66.4% for AGIs $100k-200k, 25.3% for AGIs over 200k)
Taxable interest for individuals: $2,121 (reported on 25.2% of returns)
This zip code:
$2,121
South Carolina:
$1,468
(% of AGI for various income ranges: 0.4% for AGIs below $25k, 0.4% for AGIs $25k-50k, 0.3% for AGIs $50k-75k, 1.3% for AGIs $75k-100k, 0.6% for AGIs $100k-200k, 1.3% for AGIs over 200k)
Ordinary dividends: $6,090 (reported on 15.6% of returns)
Here:
$6,090
State:
$6,511
(% of AGI for various income ranges: 0.6% for AGIs below $25k, 0.9% for AGIs $25k-50k, 0.6% for AGIs $50k-75k, 1.3% for AGIs $75k-100k, 1.5% for AGIs $100k-200k, 2.2% for AGIs over 200k)
Net capital gain/loss in AGI: +$60,606 (reported on 13.3% of returns)
Here:
+$60,606
State:
+$13,061
(% of AGI for various income ranges: 1.1% for AGIs $75k-100k, 1.1% for AGIs $100k-200k, 33.1% for AGIs over 200k)
Profit/loss from business: +$13,262 (reported on 17.8% of returns)
Here:
+$13,262
State:
+$10,167
(% of AGI for various income ranges: 8.1% for AGIs below $25k, 5.0% for AGIs $25k-50k, 1.5% for AGIs $50k-75k, 10.3% for AGIs $100k-200k)
Taxable individual retirement arrangement distribution: $13,446 (reported on 9.6% of returns)
29429:
$13,446
South Carolina:
$17,019
(% of AGI for various income ranges: 3.1% for AGIs below $25k, 1.5% for AGIs $25k-50k, 8.7% for AGIs $50k-75k, 3.7% for AGIs $100k-200k)
Total itemized deductions: $29,076 (20% of AGI, reported on 31.1% of returns)
Here:
$29,076
State:
$22,890
Here:
19.6% of AGI
State:
21.4% of AGI
(% of AGI for various income ranges: 8.4% for AGIs below $25k, 11.7% for AGIs $25k-50k, 17.7% for AGIs $50k-75k, 21.6% for AGIs $75k-100k, 21.1% for AGIs $100k-200k, 10.2% for AGIs over 200k)
Charity contributions: $4,818 (reported on 28.9% of returns)
Here:
$4,818
State:
$5,169
(% of AGI for various income ranges: 1.0% for AGIs below $25k, 1.9% for AGIs $25k-50k, 2.6% for AGIs $50k-75k, 3.4% for AGIs $75k-100k, 3.7% for AGIs $100k-200k, 1.3% for AGIs over 200k)
Taxes paid: $9,417 (reported on 31.1% of returns)
29429:
$9,417
State:
$7,644
(% of AGI for various income ranges: 1.6% for AGIs below $25k, 2.2% for AGIs $25k-50k, 4.5% for AGIs $50k-75k, 5.7% for AGIs $75k-100k, 7.7% for AGIs $100k-200k, 4.3% for AGIs over 200k)
Earned income credit: $2,241 (reported on 25.2% of returns)
Here:
$2,241
State:
$2,418
(% of AGI for various income ranges: 7.9% for AGIs below $25k, 1.3% for AGIs $25k-50k)
Percentage of individuals using paid preparers for their 2012 taxes: 63.7%
Here:
64%
State:
57%
(% for various income ranges: 59.0% for AGIs below $25k, 63.6% for AGIs $25k-50k, 61.5% for AGIs $50k-75k, 77.8% for AGIs $75k-100k, 71.4% for AGIs $100k-200k, 80.0% for AGIs over 200k)
Averages for the 2004 tax year for zip code 29429, filed in 2005:
Average Adjusted Gross Income (AGI) in 2004: $42,135 (Individual Income Tax Returns)
Here:
$42,135
State:
$41,965
Salary/wage: $34,339 (reported on 86.1% of returns)
Here:
$34,339
State:
$35,695
(% of AGI for various income ranges: 142.6% for AGIs below $10k, 82.4% for AGIs $10k-25k, 79.5% for AGIs $25k-50k, 75.7% for AGIs $50k-75k, 76.5% for AGIs $75k-100k, 55.9% for AGIs over 100k)
Taxable interest for individuals: $1,353 (reported on 31.3% of returns)
This zip code:
$1,353
South Carolina:
$1,623
(% of AGI for various income ranges: 5.1% for AGIs below $10k, 0.8% for AGIs $10k-25k, 0.7% for AGIs $25k-50k, 0.8% for AGIs $50k-75k, 0.3% for AGIs $75k-100k, 1.3% for AGIs over 100k)
Taxable dividends: $1,490 (reported on 16.5% of returns)
Here:
$1,490
State:
$3,999
(% of AGI for various income ranges: 1.6% for AGIs below $10k, 0.2% for AGIs $10k-25k, 0.4% for AGIs $25k-50k, 0.4% for AGIs $50k-75k, 0.5% for AGIs $75k-100k, 0.8% for AGIs over 100k)
Net capital gain/loss: +$11,179 (reported on 13.6% of returns)
Here:
+$11,179
State:
+$13,100
(% of AGI for various income ranges: -4.6% for AGIs below $10k, -0.1% for AGIs $10k-25k, -0.1% for AGIs $25k-50k, 1.0% for AGIs $50k-75k, 0.7% for AGIs $75k-100k, 8.4% for AGIs over 100k)
Profit/loss from business: +$15,822 (reported on 15.9% of returns)
Here:
+$15,822
State:
+$9,144
(% of AGI for various income ranges: 15.6% for AGIs below $10k, 4.4% for AGIs $10k-25k, 0.2% for AGIs $25k-50k, 5.2% for AGIs $50k-75k, 2.2% for AGIs $75k-100k, 9.8% for AGIs over 100k)
IRA payment deduction: $2,600 (reported on 1.6% of returns)
29429:
$2,600
South Carolina:
$2,972
Total itemized deductions: $22,740 (24% of AGI, reported on 30.8% of returns)
Here:
$22,740
State:
$19,039
Here:
24.3% of AGI
State:
22.8% of AGI
(% of AGI for various income ranges: 27.5% for AGIs below $10k, 7.3% for AGIs $10k-25k, 14.5% for AGIs $25k-50k, 20.4% for AGIs $50k-75k, 21.4% for AGIs $75k-100k, 16.9% for AGIs over 100k)
Charity contributions deductions: $4,302 (4% of AGI, reported on 28.1% of returns)
Here:
$4,302
State:
$4,305
Here:
4.4% of AGI
State:
5.0% of AGI
(% of AGI for various income ranges: 1.1% for AGIs $10k-25k, 2.6% for AGIs $25k-50k, 3.9% for AGIs $50k-75k, 3.0% for AGIs $75k-100k, 3.2% for AGIs over 100k)
Total tax: $7,332 (reported on 64.6% of returns)
29429:
$7,332
State:
$6,497
(% of AGI for various income ranges: 4.4% for AGIs below $10k, 3.1% for AGIs $10k-25k, 5.9% for AGIs $25k-50k, 8.7% for AGIs $50k-75k, 9.3% for AGIs $75k-100k, 17.6% for AGIs over 100k)
Earned income credit: $1,973 (reported on 26.5% of returns)
Here:
$1,973
State:
$1,882
Percentage of individuals using paid preparers for their 2004 taxes: 67.6%
Here:
68%
State:
66%
(% for various income ranges: 61.5% for AGIs below $10k, 69.1% for AGIs $10k-25k, 67.8% for AGIs $25k-50k, 71.0% for AGIs $50k-75k, 70.0% for AGIs $75k-100k, 73.6% for AGIs over 100k)
Household received Food Stamps/SNAP in the past 12 months: 46 Household did not receive Food Stamps/SNAP in the past 12 months: 1,777
Women who did not have a birth in the past 12 months: 1,053 (386 now married, 664 unmarried)
Housing units in zip code 29429 with a mortgage: 750 (135 second mortgage, 136 both second mortgage and home equity loan) Houses without a mortgage: 32
Median monthly owner costs for units with a mortgage: $2,208 Median monthly owner costs for units without a mortgage: $445
Residents with income below the poverty level in 2022:
This zip code:
6.3%
Whole state:
14.0%
Residents with income below 50% of the poverty level in 2022:
This zip code:
5.2%
Whole state:
7.3%
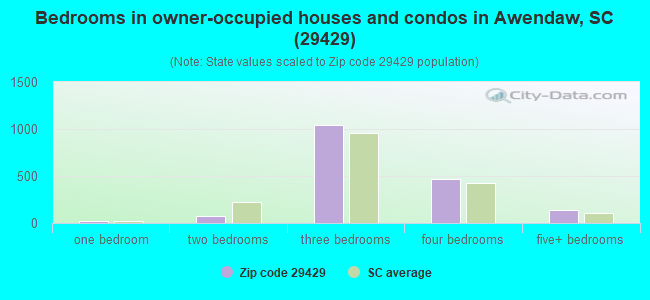
Median number of rooms in houses and condos:
Here:
6.8
State:
6.4
Median number of rooms in apartments:
Here:
5.1
State:
4.5
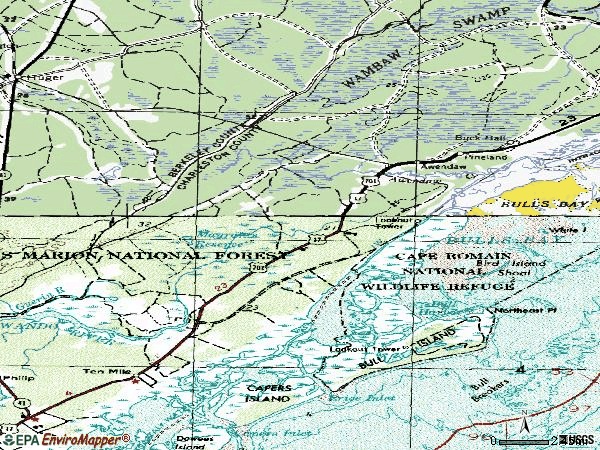
Notable locations in this zip code not listed on our city pages
Notable locations in zip code 29429: Sewee Camp (A), Twin Pond Rifle Range (B), Halfway Creek Trail Camp (C), Santo Sotille Ranch (D), Deer Creek Farm (E), Awendaw Sheriff's Department (F), Awendaw Fire District Station 1 (G), Awendaw Fire District Station 2 (H), Charleston County Sheriff's Office Substation (I). Display/hide their locations on the map
Churches in zip code 29429 include: Awendaw Church (A), Nebo Church (B), Ocean Grove Church (C), Sewee Church (D), Zion Church (E), Awendaw Church (F). Display/hide their locations on the map
Lakes, reservoirs, and swamps: Moccasin Pond (A), Fish Pond (B), Mayrants Reserve (C), Lower Summerhouse Pond (D), Upper Summerhouse Pond (E), Big Pond (F), Lake Awendaw (G), I'on Swamp (H). Display/hide their locations on the map
Streams, rivers, and creeks: Withey Wood Canal (A), Whiteside Creek (B), Venning Creek (C), Vanderhorst Creek (D), Toomer Creek (E), Summerhouse Creek (F), Steed Creek (G), Schooner Creek (H), Halfway Creek (I). Display/hide their locations on the map
In group quarters: 8 (-1 institutionalized population)
Size of family households: 811 2-persons, 400 3-persons, 137 4-persons, 69 5-persons, 30 6-persons, 12 7-or-more-persons
Size of nonfamily households: 327 1-person, 48 2-persons
501 married couples with children.
63 single-parent households (19 men, 44 women).
96.9% of residents of 29429 zip code speak English at home.
3.0% of residents speak Spanish at home (88% very well, 12% well).
0.2% of residents speak other Indo-European language at home (100% very well).
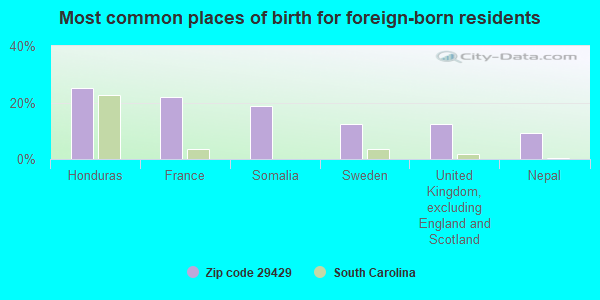
Foreign born population: 33 (0.7%) (62.9% of them are naturalized citizens)
This zip code:
0.7%
Whole state:
5.2%
25%Honduras
22%France
19%Somalia
12%Sweden
12%United Kingdom, excluding England and Scotland
9%Nepal
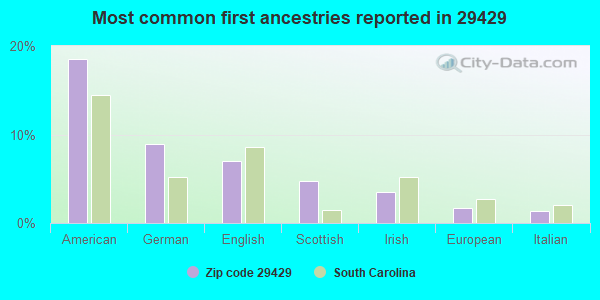
19%American
9%German
7%English
5%Scottish
3%Irish
2%European
1%Italian
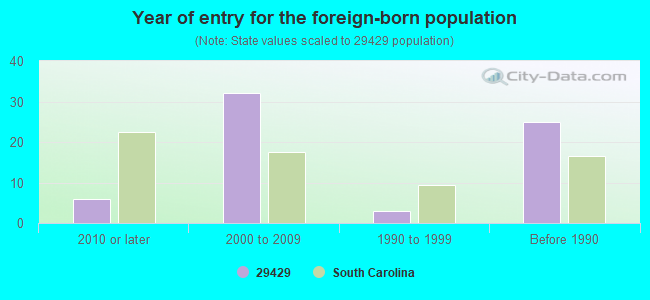
Year of entry for the foreign-born population
62010 or later
322000 to 2009
31990 to 1999
25Before 1990
Facilities with environmental interests located in this zip code:
CHARLESTON CPW/BEAN PIT (SEEWEE RD (S-584) in AWENDAW, SC)
National Pollutant Discharge Elimination System NON-MAJOR (Tracking pollutant discharge elimination systems) - permit Business SIC classification: CONSTRUCTION SAND AND GRAVEL
Housing units lacking complete plumbing facilities: 1.7% Housing units lacking complete kitchen facilities: 1.0%
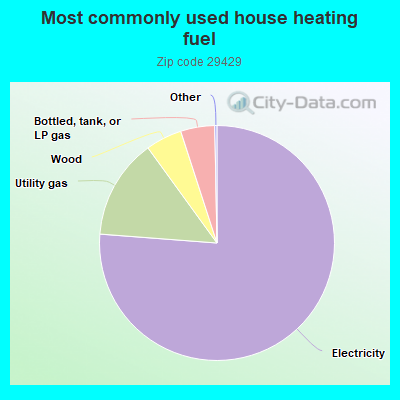
76.3%Electricity
13.8%Utility gas
5.0%Wood
4.7%Bottled, tank, or LP gas
Population in 1990: 1,831. Population change in the 1990s: +908 (+49.6%).
Place of birth for U.S.-born residents:
This state: 2,977
Northeast: 420
Midwest: 529
South: 524
West: 110
59% of the 29429 zip code residents lived in the same house 5 years ago. Out of people who lived in different houses, 77% lived in this county. Out of people who lived in different counties, 50% lived in South Carolina.
96% of the 29429 zip code residents lived in the same house 1 year ago. Out of people who lived in different houses, 62% moved from this county. Out of people who lived in different houses, 28% moved from different county within same state.
Private vs. public school enrollment:
Students in private schools in grades 1 to 8 (elementary and middle school): 85
Here:
25.2%
South Carolina:
14.4%
Students in private schools in grades 9 to 12 (high school): 23
Here:
10.7%
South Carolina:
11.1%
Students in private undergraduate colleges: 2
Here:
2.8%
South Carolina:
21.9%
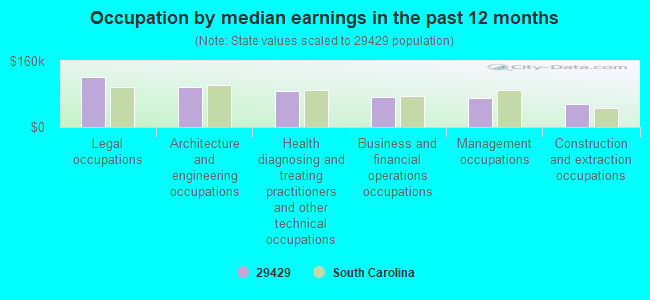
Occupation by median earnings in the past 12 months ($)
120,038Legal occupations
96,943Architecture and engineering occupations
86,743Health diagnosing and treating practitioners and other technical occupations
72,770Business and financial operations occupations
69,529Management occupations
56,627Construction and extraction occupations
Companies with federal contracts located in this zip code:
OLDSIDE CONSTRUCTION (7380 AWENDAW LANDING ROAD in AWENDAW, SC; small business) : $48,558 in 2 contractsin 2003
$24,475 with Navy for Maintenance, Repair or Alteration of Real Property -- Miscellaneous Buildings. Signed on 2003-07-22. Completion date: 2003-09-20.
$24,083, same as above.Signed on 2003-09-29. Completion date: 2004-02-20.
Top industries in this zip code by the number of employees in 2005:
Arts, Entertainment, and Recreation: Golf Courses and Country Clubs (50-99 employees: 1 establishment)
Health Care and Social Assistance: Other Residential Care Facilities (20-49: 1, 10-19: 1)
Construction: Painting and Wall Covering Contractors (10-19: 1, 1-4: 2)
Professional, Scientific, and Technical Services: Landscape Architectural Services (10-19: 1)
Accommodation and Food Services: Snack and Nonalcoholic Beverage Bars (10-19: 1)
Construction: Land Subdivision (10-19: 1)
Construction: New Single-Family Housing Construction (except Operative Builders) (5-9: 1, 1-4: 4)
Utilities: Electric Power Distribution (10-19: 1)
Accommodation and Food Services: Full-Service Restaurants (10-19: 1)
People in group quarters in 2010:
19 people in residential treatment centers for juveniles (non-correctional)
People in group quarters in 2000:
6 people in homes for the mentally ill
Fatal accident statistics in 2014:
Fatal accident count: 3
Vehicles involved in fatal accidents: 4
Fatal accidents caused by drunken drivers: 1
Fatalities: 3
Persons involved in fatal accidents: 4
Pedestrians involved in fatal accidents: 0
Fatal accident statistics in 2012:
Fatal accident count: 3
Vehicles involved in fatal accidents: 3
Fatal accidents caused by drunken drivers: 1
Fatalities: 3
Persons involved in fatal accidents: 8
Pedestrians involved in fatal accidents: 1
Home Mortgage Disclosure Act Aggregated Statistics For Year 2009 (Based on 38 partial tracts)
A) FHA, FSA/RHS & VA Home Purchase Loans
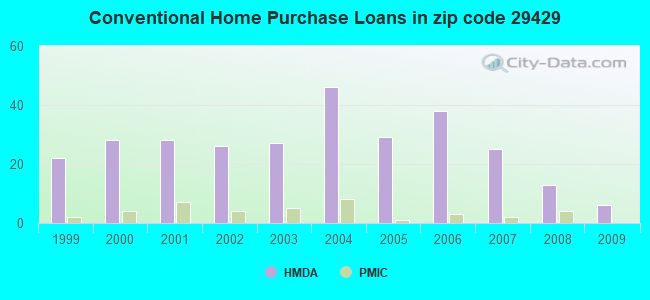
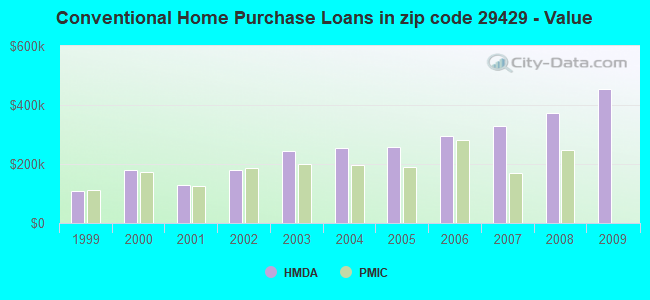
B) Conventional Home Purchase Loans
C) Refinancings
D) Home Improvement Loans
F) Non-occupant Loans on < 5 Family Dwellings (A B C & D)
G) Loans On Manufactured Home Dwelling (A B C & D)
Number
Average Value
Number
Average Value
Number
Average Value
Number
Average Value
Number
Average Value
Number
Average Value
LOANS ORIGINATED
3
$218,987
6
$454,232
56
$265,278
3
$80,727
11
$357,101
1
$133,030
APPLICATIONS APPROVED, NOT ACCEPTED
0
$0
1
$186,240
8
$191,528
0
$0
1
$113,250
0
$0
APPLICATIONS DENIED
0
$0
5
$315,312
38
$232,020
1
$93,460
4
$396,528
4
$119,725
APPLICATIONS WITHDRAWN
1
$83,910
1
$144,630
25
$218,959
0
$0
1
$183,510
8
$119,726
FILES CLOSED FOR INCOMPLETENESS
0
$0
1
$733,360
5
$251,868
0
$0
0
$0
1
$85,960
Aggregated Statistics For Year 2008 (Based on 38 partial tracts)
A) FHA, FSA/RHS & VA Home Purchase Loans
B) Conventional Home Purchase Loans
C) Refinancings
D) Home Improvement Loans
F) Non-occupant Loans on < 5 Family Dwellings (A B C & D)
G) Loans On Manufactured Home Dwelling (A B C & D)
Number
Average Value
Number
Average Value
Number
Average Value
Number
Average Value
Number
Average Value
Number
Average Value
LOANS ORIGINATED
1
$78,450
13
$374,318
53
$307,273
10
$139,032
11
$453,663
4
$123,478
APPLICATIONS APPROVED, NOT ACCEPTED
0
$0
2
$663,440
6
$182,488
1
$34,110
2
$154,860
1
$211,480
APPLICATIONS DENIED
3
$151,903
7
$86,151
34
$219,869
7
$101,259
8
$241,158
6
$65,263
APPLICATIONS WITHDRAWN
1
$109,830
5
$170,004
13
$314,285
0
$0
5
$330,730
2
$100,625
FILES CLOSED FOR INCOMPLETENESS
0
$0
2
$398,405
5
$224,990
0
$0
1
$263,330
2
$140,535
Aggregated Statistics For Year 2007 (Based on 38 partial tracts)
A) FHA, FSA/RHS & VA Home Purchase Loans
B) Conventional Home Purchase Loans
C) Refinancings
D) Home Improvement Loans
E) Loans on Dwellings For 5+ Families
F) Non-occupant Loans on < 5 Family Dwellings (A B C & D)
G) Loans On Manufactured Home Dwelling (A B C & D)
Number
Average Value
Number
Average Value
Number
Average Value
Number
Average Value
Number
Average Value
Number
Average Value
Number
Average Value
LOANS ORIGINATED
0
$0
25
$329,339
52
$292,297
8
$168,759
0
$0
14
$367,414
5
$53,348
APPLICATIONS APPROVED, NOT ACCEPTED
0
$0
4
$220,350
14
$164,556
1
$55,260
0
$0
1
$215,580
3
$85,730
APPLICATIONS DENIED
1
$264,690
5
$291,162
57
$421,635
14
$82,449
0
$0
8
$1,120,001
7
$65,296
APPLICATIONS WITHDRAWN
0
$0
8
$274,330
25
$434,534
3
$119,157
1
$3,069,900
3
$1,316,647
1
$78,450
FILES CLOSED FOR INCOMPLETENESS
0
$0
1
$172,600
5
$274,380
0
$0
0
$0
1
$102,330
0
$0
Aggregated Statistics For Year 2006 (Based on 38 partial tracts)
A) FHA, FSA/RHS & VA Home Purchase Loans
B) Conventional Home Purchase Loans
C) Refinancings
D) Home Improvement Loans
F) Non-occupant Loans on < 5 Family Dwellings (A B C & D)
G) Loans On Manufactured Home Dwelling (A B C & D)
Number
Average Value
Number
Average Value
Number
Average Value
Number
Average Value
Number
Average Value
Number
Average Value
LOANS ORIGINATED
1
$88,000
38
$295,052
68
$248,130
8
$139,084
15
$372,936
5
$79,544
APPLICATIONS APPROVED, NOT ACCEPTED
0
$0
12
$288,343
12
$127,060
1
$111,200
1
$1,951,090
8
$60,119
APPLICATIONS DENIED
1
$57,300
28
$110,346
54
$169,741
10
$40,659
5
$207,252
20
$70,914
APPLICATIONS WITHDRAWN
1
$96,190
8
$196,985
19
$151,233
1
$98,240
3
$119,387
3
$114,153
FILES CLOSED FOR INCOMPLETENESS
0
$0
1
$136,440
8
$137,805
0
$0
1
$50,480
1
$128,250
Aggregated Statistics For Year 2005 (Based on 38 partial tracts)
A) FHA, FSA/RHS & VA Home Purchase Loans
B) Conventional Home Purchase Loans
C) Refinancings
D) Home Improvement Loans
F) Non-occupant Loans on < 5 Family Dwellings (A B C & D)
G) Loans On Manufactured Home Dwelling (A B C & D)
Number
Average Value
Number
Average Value
Number
Average Value
Number
Average Value
Number
Average Value
Number
Average Value
LOANS ORIGINATED
0
$0
29
$256,601
66
$195,502
9
$68,751
13
$165,722
5
$119,658
APPLICATIONS APPROVED, NOT ACCEPTED
1
$55,260
12
$105,513
14
$178,054
0
$0
2
$142,920
12
$63,899
APPLICATIONS DENIED
0
$0
27
$92,527
44
$181,124
10
$65,491
3
$120,067
24
$75,781
APPLICATIONS WITHDRAWN
0
$0
12
$223,762
28
$203,929
2
$189,995
4
$207,218
5
$93,734
FILES CLOSED FOR INCOMPLETENESS
0
$0
1
$221,710
16
$179,674
0
$0
0
$0
1
$98,920
Aggregated Statistics For Year 2004 (Based on 38 partial tracts)
A) FHA, FSA/RHS & VA Home Purchase Loans
B) Conventional Home Purchase Loans
C) Refinancings
D) Home Improvement Loans
F) Non-occupant Loans on < 5 Family Dwellings (A B C & D)
G) Loans On Manufactured Home Dwelling (A B C & D)
Number
Average Value
Number
Average Value
Number
Average Value
Number
Average Value
Number
Average Value
Number
Average Value
LOANS ORIGINATED
0
$0
46
$255,588
51
$216,806
8
$34,451
19
$337,402
10
$63,104
APPLICATIONS APPROVED, NOT ACCEPTED
1
$24,560
12
$79,362
18
$155,997
0
$0
1
$53,890
12
$51,563
APPLICATIONS DENIED
1
$88,690
35
$95,937
46
$120,290
7
$51,263
3
$116,657
31
$53,938
APPLICATIONS WITHDRAWN
0
$0
3
$276,747
20
$118,737
1
$139,850
1
$445,480
0
$0
FILES CLOSED FOR INCOMPLETENESS
0
$0
2
$488,115
9
$125,070
1
$30,700
0
$0
1
$98,920
Aggregated Statistics For Year 2003 (Based on 38 partial tracts)
A) FHA, FSA/RHS & VA Home Purchase Loans
B) Conventional Home Purchase Loans
C) Refinancings
D) Home Improvement Loans
E) Loans on Dwellings For 5+ Families
F) Non-occupant Loans on < 5 Family Dwellings (A B C & D)
Number
Average Value
Number
Average Value
Number
Average Value
Number
Average Value
Number
Average Value
Number
Average Value
LOANS ORIGINATED
0
$0
27
$245,264
111
$182,848
1
$45,030
1
$168,500
14
$221,228
APPLICATIONS APPROVED, NOT ACCEPTED
1
$44,340
7
$138,291
24
$139,766
1
$46,390
0
$0
0
$0
APPLICATIONS DENIED
1
$67,540
19
$71,164
57
$128,972
5
$91,414
0
$0
3
$92,323
APPLICATIONS WITHDRAWN
0
$0
5
$279,430
22
$179,295
1
$68,220
0
$0
3
$156,907
FILES CLOSED FOR INCOMPLETENESS
1
$85,960
0
$0
4
$173,280
0
$0
0
$0
0
$0
Aggregated Statistics For Year 2002 (Based on 38 partial tracts)
A) FHA, FSA/RHS & VA Home Purchase Loans
B) Conventional Home Purchase Loans
C) Refinancings
D) Home Improvement Loans
F) Non-occupant Loans on < 5 Family Dwellings (A B C & D)
Number
Average Value
Number
Average Value
Number
Average Value
Number
Average Value
Number
Average Value
LOANS ORIGINATED
1
$85,960
26
$178,290
81
$185,988
3
$35,930
16
$170,379
APPLICATIONS APPROVED, NOT ACCEPTED
1
$44,340
10
$66,310
17
$111,078
1
$34,110
0
$0
APPLICATIONS DENIED
1
$44,340
23
$55,555
49
$139,141
8
$13,048
2
$114,270
APPLICATIONS WITHDRAWN
0
$0
5
$113,246
14
$104,815
1
$3,410
2
$104,035
FILES CLOSED FOR INCOMPLETENESS
0
$0
4
$211,652
7
$77,479
1
$10,230
1
$172,600
Aggregated Statistics For Year 2001 (Based on 38 partial tracts)
A) FHA, FSA/RHS & VA Home Purchase Loans
B) Conventional Home Purchase Loans
C) Refinancings
D) Home Improvement Loans
F) Non-occupant Loans on < 5 Family Dwellings (A B C & D)
Number
Average Value
Number
Average Value
Number
Average Value
Number
Average Value
Number
Average Value
LOANS ORIGINATED
3
$86,867
28
$127,596
70
$165,745
9
$26,909
10
$234,609
APPLICATIONS APPROVED, NOT ACCEPTED
1
$2,050
20
$47,652
11
$79,259
1
$88,000
2
$64,810
APPLICATIONS DENIED
0
$0
61
$43,884
55
$78,329
6
$11,370
4
$70,268
APPLICATIONS WITHDRAWN
0
$0
3
$48,437
18
$126,813
3
$64,580
1
$236,720
FILES CLOSED FOR INCOMPLETENESS
0
$0
2
$161,680
3
$67,993
0
$0
1
$32,060
Aggregated Statistics For Year 2000 (Based on 38 partial tracts)
A) FHA, FSA/RHS & VA Home Purchase Loans
B) Conventional Home Purchase Loans
C) Refinancings
D) Home Improvement Loans
F) Non-occupant Loans on < 5 Family Dwellings (A B C & D)
Number
Average Value
Number
Average Value
Number
Average Value
Number
Average Value
Number
Average Value
LOANS ORIGINATED
3
$45,933
28
$180,466
27
$86,791
5
$15,964
8
$210,118
APPLICATIONS APPROVED, NOT ACCEPTED
2
$38,205
15
$110,471
11
$105,865
1
$37,520
1
$15,690
APPLICATIONS DENIED
2
$56,965
59
$46,343
55
$60,939
10
$10,983
5
$45,980
APPLICATIONS WITHDRAWN
1
$42,300
2
$119,385
14
$85,226
2
$23,195
1
$6,820
FILES CLOSED FOR INCOMPLETENESS
0
$0
3
$411,820
5
$60,988
0
$0
1
$708,120
Aggregated Statistics For Year 1999 (Based on 19 partial tracts)
B) Conventional Home Purchase Loans
C) Refinancings
D) Home Improvement Loans
F) Non-occupant Loans on < 5 Family Dwellings (A B C & D)
Detailed PMIC statistics for the following Tracts:0050.00
2003 - 2018 National Fire Incident Reporting System (NFIRS) incidents
According to the data from the years 2003 - 2018 the average number of fires per year is 24. The highest number of fire incidents - 56 took place in 2004, and the least - 0 in 2005. The data has a growing trend.
When looking into fire subcategories, the most reports belonged to: Outside Fires (58.1%), and Structure Fires (21.1%).
Fire incident types reported to NFIRS in Zip Code 29429


 Nearest zip codes: 29450, 29466, 29451, 29458, 29434, 29453.


 According to the data from the years 2003 - 2018 the average number of fires per year is 24. The highest number of fire incidents - 56 took place in 2004, and the least - 0 in 2005. The data has a growing trend.
 When looking into fire subcategories, the most reports belonged to: Outside Fires (58.1%), and Structure Fires (21.1%).