Estimated zip code population in 2022: 6,316 Zip code population in 2010: 6,566 Zip code population in 2000: 7,382
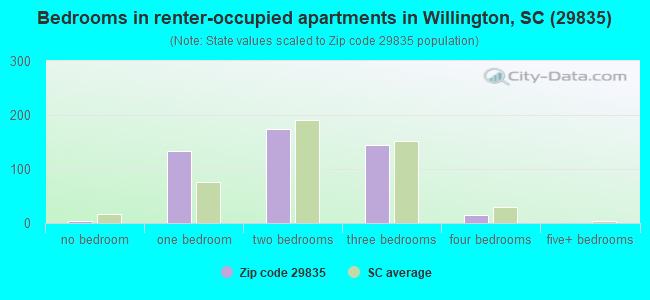
Houses and condos: 3,736 Renter-occupied apartments: 465
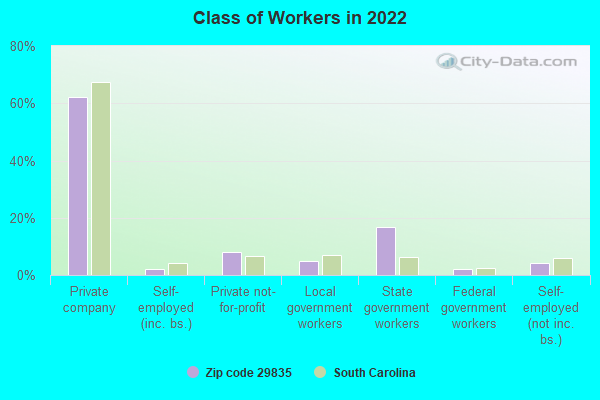
% of renters here:
16%
State:
28%
March 2022 cost of living index in zip code 29835: 79.9 (low, U.S. average is 100)
Land area: 183.1 sq. mi. Water area: 14.9 sq. mi.
Population density: 34 people per square mile
(very low).
OSM Map
General Map
Google Map
MSN Map
OSM Map
General Map
Google Map
MSN Map
OSM Map
General Map
Google Map
MSN Map
OSM Map
General Map
Google Map
MSN Map
Please wait while loading the map...
Real estate property taxes paid for housing units in 2022:
This zip code:
0.6% ($1,127)
South Carolina:
0.5% ($1,185)
Median real estate property taxes paid for housing units with mortgages in 2022: $1,252 (0.7%) Median real estate property taxes paid for housing units with no mortgage in 2022: $1,097 (0.6%)
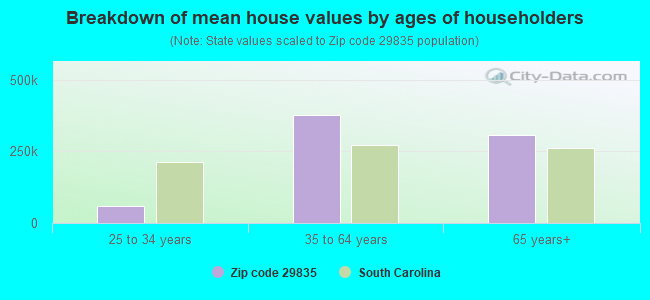
Estimated median house/condo value in 2022: $181,941
29835:
$181,941
South Carolina:
$254,600
According to our research of South Carolina and other state lists, there was 1 registered sex offender living in 29835 zip code as of May 28, 2024. The ratio of all residents to sex offenders in zip code 29835 is 6,619 to 1. The ratio of registered sex offenders to all residents in this zip code is much lower than the state average.
Median resident age:
This zip code:
62.7 years
South Carolina median age:
40.5 years
Average household size:
This zip code:
2.1 people
South Carolina:
2.4 people
Averages for the 2020 tax year for zip code 29835, filed in 2021:
Average Adjusted Gross Income (AGI) in 2020: $61,760 (Individual Income Tax Returns)
Here:
$61,760
State:
$65,754
Salary/wage: $41,072 (reported on 64.3% of returns)
Here:
$41,072
State:
$52,566
(% of AGI for various income ranges: 1183.2% for AGIs below $25k, 3250.7% for AGIs $25k-50k, 4632.1% for AGIs $50k-75k, 5031.2% for AGIs $75k-100k, 9086.8% for AGIs $100k-200k, 76910.0% for AGIs over 200k)
Taxable interest for individuals: $1,243 (reported on 36.1% of returns)
This zip code:
$1,243
South Carolina:
$1,749
(% of AGI for various income ranges: 16.0% for AGIs below $25k, 43.3% for AGIs $25k-50k, 72.5% for AGIs $50k-75k, 69.4% for AGIs $75k-100k, 220.0% for AGIs $100k-200k, 1170.0% for AGIs over 200k)
Ordinary dividends: $6,398 (reported on 26.6% of returns)
Here:
$6,398
State:
$8,783
(% of AGI for various income ranges: 30.5% for AGIs below $25k, 89.4% for AGIs $25k-50k, 255.0% for AGIs $50k-75k, 494.1% for AGIs $75k-100k, 720.4% for AGIs $100k-200k, 7365.0% for AGIs over 200k)
Net capital gain/loss in AGI: +$8,658 (reported on 24.8% of returns)
Here:
+$8,658
State:
+$24,194
(% of AGI for various income ranges: 9.5% for AGIs below $25k, 39.3% for AGIs $25k-50k, 131.7% for AGIs $50k-75k, 477.1% for AGIs $75k-100k, 940.4% for AGIs $100k-200k, 15395.0% for AGIs over 200k)
Profit/loss from business: +$5,232 (reported on 13.8% of returns)
Here:
+$5,232
State:
+$11,253
(% of AGI for various income ranges: 11.7% for AGIs below $25k, 15.9% for AGIs $25k-50k, 44.2% for AGIs $50k-75k, 80.0% for AGIs $75k-100k, 754.4% for AGIs $100k-200k)
Taxable individual retirement arrangement distribution: $25,258 (reported on 25.1% of returns)
29835:
$25,258
South Carolina:
$21,604
(% of AGI for various income ranges: 122.7% for AGIs below $25k, 324.3% for AGIs $25k-50k, 1148.3% for AGIs $50k-75k, 1612.4% for AGIs $75k-100k, 3930.4% for AGIs $100k-200k, 11060.0% for AGIs over 200k)
Total itemized deductions: $33,319 (reported on 6.6% of returns)
Here:
$33,319
State:
$35,199
(% of AGI for various income ranges: 184.8% for AGIs $25k-50k, 342.5% for AGIs $50k-75k, 525.3% for AGIs $75k-100k, 1092.0% for AGIs $100k-200k, 7770.0% for AGIs over 200k)
Charity contributions: $9,160 (reported on 6.3% of returns)
Here:
$9,160
State:
$14,319
(% of AGI for various income ranges: 32.2% for AGIs $25k-50k, 91.2% for AGIs $50k-75k, 48.8% for AGIs $75k-100k, 341.6% for AGIs $100k-200k, 2510.0% for AGIs over 200k)
Taxes paid: $6,767 (reported on 6.6% of returns)
29835:
$6,767
State:
$7,486
(% of AGI for various income ranges: 23.3% for AGIs $25k-50k, 53.8% for AGIs $50k-75k, 110.6% for AGIs $75k-100k, 276.0% for AGIs $100k-200k, 1440.0% for AGIs over 200k)
Earned income credit: $2,328 (reported on 17.9% of returns)
Here:
$2,328
State:
$2,397
(% of AGI for various income ranges: 121.6% for AGIs below $25k, 76.9% for AGIs $25k-50k)
Percentage of individuals using paid preparers for their 2020 taxes: 89.7%
Here:
90%
State:
93%
(% for various income ranges: 89.7% for AGIs below $25k, 88.6% for AGIs $25k-50k, 86.4% for AGIs $50k-75k, 90.0% for AGIs $75k-100k, 92.0% for AGIs $100k-200k, 100.0% for AGIs over 200k)
Averages for the 2012 tax year for zip code 29835, filed in 2013:
Average Adjusted Gross Income (AGI) in 2012: $45,784 (Individual Income Tax Returns)
Here:
$45,784
State:
$51,133
Salary/wage: $27,724 (reported on 69.8% of returns)
Here:
$27,724
State:
$42,173
(% of AGI for various income ranges: 69.6% for AGIs below $25k, 65.7% for AGIs $25k-50k, 41.3% for AGIs $50k-75k, 26.2% for AGIs $75k-100k, 36.1% for AGIs $100k-200k)
Taxable interest for individuals: $1,504 (reported on 35.9% of returns)
This zip code:
$1,504
South Carolina:
$1,468
(% of AGI for various income ranges: 0.9% for AGIs below $25k, 0.9% for AGIs $25k-50k, 0.9% for AGIs $50k-75k, 0.9% for AGIs $75k-100k, 1.6% for AGIs $100k-200k, 2.1% for AGIs over 200k)
Ordinary dividends: $5,657 (reported on 24.6% of returns)
Here:
$5,657
State:
$6,511
(% of AGI for various income ranges: 1.4% for AGIs below $25k, 1.7% for AGIs $25k-50k, 2.9% for AGIs $50k-75k, 3.5% for AGIs $75k-100k, 4.0% for AGIs $100k-200k, 5.1% for AGIs over 200k)
Net capital gain/loss in AGI: +$3,260 (reported on 20.6% of returns)
Here:
+$3,260
State:
+$13,061
(% of AGI for various income ranges: 1.5% for AGIs $75k-100k, 3.3% for AGIs $100k-200k, 7.3% for AGIs over 200k)
Profit/loss from business: +$5,039 (reported on 14.6% of returns)
Here:
+$5,039
State:
+$10,167
(% of AGI for various income ranges: 4.9% for AGIs below $25k, 0.9% for AGIs $50k-75k, 1.3% for AGIs $75k-100k, 2.8% for AGIs $100k-200k)
Taxable individual retirement arrangement distribution: $20,054 (reported on 24.2% of returns)
29835:
$20,054
South Carolina:
$17,019
(% of AGI for various income ranges: 5.0% for AGIs below $25k, 7.5% for AGIs $25k-50k, 10.3% for AGIs $50k-75k, 13.4% for AGIs $75k-100k, 17.2% for AGIs $100k-200k)
Total itemized deductions: $20,792 (26% of AGI, reported on 28.5% of returns)
Here:
$20,792
State:
$22,890
Here:
26.0% of AGI
State:
21.4% of AGI
(% of AGI for various income ranges: 9.2% for AGIs below $25k, 11.6% for AGIs $25k-50k, 13.7% for AGIs $50k-75k, 14.0% for AGIs $75k-100k, 13.7% for AGIs $100k-200k, 15.6% for AGIs over 200k)
Charity contributions: $4,404 (reported on 25.6% of returns)
Here:
$4,404
State:
$5,169
(% of AGI for various income ranges: 1.2% for AGIs below $25k, 1.7% for AGIs $25k-50k, 2.1% for AGIs $50k-75k, 3.1% for AGIs $75k-100k, 2.7% for AGIs $100k-200k, 5.0% for AGIs over 200k)
Taxes paid: $5,871 (reported on 28.5% of returns)
29835:
$5,871
State:
$7,644
(% of AGI for various income ranges: 1.6% for AGIs below $25k, 2.3% for AGIs $25k-50k, 3.1% for AGIs $50k-75k, 3.8% for AGIs $75k-100k, 4.9% for AGIs $100k-200k, 7.0% for AGIs over 200k)
Earned income credit: $2,470 (reported on 27.0% of returns)
Here:
$2,470
State:
$2,418
(% of AGI for various income ranges: 9.8% for AGIs below $25k, 1.3% for AGIs $25k-50k)
Percentage of individuals using paid preparers for their 2012 taxes: 60.9%
Here:
61%
State:
57%
(% for various income ranges: 61.9% for AGIs below $25k, 58.3% for AGIs $25k-50k, 61.1% for AGIs $50k-75k, 59.3% for AGIs $75k-100k, 64.0% for AGIs $100k-200k, 66.7% for AGIs over 200k)
Averages for the 2004 tax year for zip code 29835, filed in 2005:
Average Adjusted Gross Income (AGI) in 2004: $36,856 (Individual Income Tax Returns)
Here:
$36,856
State:
$41,965
Salary/wage: $25,986 (reported on 78.2% of returns)
Here:
$25,986
State:
$35,695
(% of AGI for various income ranges: 85.0% for AGIs below $10k, 78.2% for AGIs $10k-25k, 70.7% for AGIs $25k-50k, 44.6% for AGIs $50k-75k, 37.5% for AGIs $75k-100k, 40.4% for AGIs over 100k)
Taxable interest for individuals: $1,691 (reported on 37.9% of returns)
This zip code:
$1,691
South Carolina:
$1,623
(% of AGI for various income ranges: 4.2% for AGIs below $10k, 1.9% for AGIs $10k-25k, 1.1% for AGIs $25k-50k, 1.8% for AGIs $50k-75k, 1.5% for AGIs $75k-100k, 2.2% for AGIs over 100k)
Taxable dividends: $4,558 (reported on 22.9% of returns)
Here:
$4,558
State:
$3,999
(% of AGI for various income ranges: 3.6% for AGIs below $10k, 1.3% for AGIs $10k-25k, 1.5% for AGIs $25k-50k, 2.1% for AGIs $50k-75k, 1.9% for AGIs $75k-100k, 6.3% for AGIs over 100k)
Net capital gain/loss: +$4,951 (reported on 19.4% of returns)
Here:
+$4,951
State:
+$13,100
(% of AGI for various income ranges: -2.8% for AGIs below $10k, -0.2% for AGIs $10k-25k, -0.2% for AGIs $25k-50k, 1.0% for AGIs $50k-75k, 2.1% for AGIs $75k-100k, 9.2% for AGIs over 100k)
Profit/loss from business: +$2,512 (reported on 13.1% of returns)
Here:
+$2,512
State:
+$9,144
(% of AGI for various income ranges: 4.8% for AGIs below $10k, 1.9% for AGIs $10k-25k, 0.7% for AGIs $25k-50k, 0.0% for AGIs $50k-75k, 1.3% for AGIs $75k-100k, 0.6% for AGIs over 100k)
IRA payment deduction: $3,511 (reported on 1.6% of returns)
29835:
$3,511
South Carolina:
$2,972
Total itemized deductions: $18,006 (26% of AGI, reported on 29.8% of returns)
Here:
$18,006
State:
$19,039
Here:
26.0% of AGI
State:
22.8% of AGI
(% of AGI for various income ranges: 8.5% for AGIs below $10k, 10.1% for AGIs $10k-25k, 14.1% for AGIs $25k-50k, 17.4% for AGIs $50k-75k, 18.4% for AGIs $75k-100k, 14.1% for AGIs over 100k)
Charity contributions deductions: $3,704 (5% of AGI, reported on 28.5% of returns)
Here:
$3,704
State:
$4,305
Here:
5.3% of AGI
State:
5.0% of AGI
(% of AGI for various income ranges: 0.8% for AGIs below $10k, 1.2% for AGIs $10k-25k, 2.7% for AGIs $25k-50k, 3.9% for AGIs $50k-75k, 3.7% for AGIs $75k-100k, 3.0% for AGIs over 100k)
Total tax: $5,014 (reported on 65.3% of returns)
29835:
$5,014
State:
$6,497
(% of AGI for various income ranges: 2.7% for AGIs below $10k, 2.6% for AGIs $10k-25k, 5.1% for AGIs $25k-50k, 8.4% for AGIs $50k-75k, 10.7% for AGIs $75k-100k, 16.8% for AGIs over 100k)
Earned income credit: $1,888 (reported on 29.3% of returns)
Here:
$1,888
State:
$1,882
Percentage of individuals using paid preparers for their 2004 taxes: 71.4%
Here:
71%
State:
66%
(% for various income ranges: 69.7% for AGIs below $10k, 75.6% for AGIs $10k-25k, 70.3% for AGIs $25k-50k, 68.2% for AGIs $50k-75k, 65.3% for AGIs $75k-100k, 69.3% for AGIs over 100k)
Household received Food Stamps/SNAP in the past 12 months: 391 Household did not receive Food Stamps/SNAP in the past 12 months: 2,578
Women who had a birth in the past 12 months: 37 (0 now married, 33 unmarried) Women who did not have a birth in the past 12 months: 782 (227 now married, 551 unmarried)
Housing units in zip code 29835 with a mortgage: 1,045 (121 second mortgage, 117 both second mortgage and home equity loan) Houses without a mortgage: 46
Median monthly owner costs for units with a mortgage: $1,126 Median monthly owner costs for units without a mortgage: $465
Residents with income below the poverty level in 2022:
This zip code:
16.5%
Whole state:
14.0%
Residents with income below 50% of the poverty level in 2022:
This zip code:
7.5%
Whole state:
7.3%
Median number of rooms in houses and condos:
Here:
5.9
State:
6.4
Median number of rooms in apartments:
Here:
4.5
State:
4.5
Notable locations in this zip code not listed on our city pages
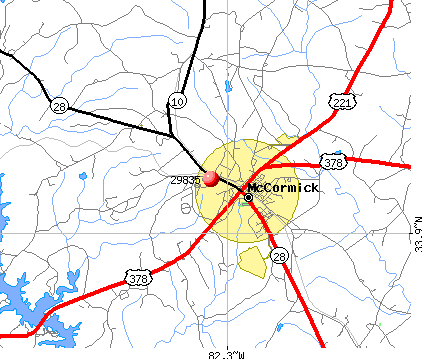
Notable locations in zip code 29835: McCormick County Fairground (A), Long Crane Creek Campground (B), Monroe Ridge Hunt Campground (C), Little River Quarry Boat Ramp (D), Long Cane Creek Boat Ramp (E), Hawe Creek Camping Area (F), Cyper Creek Picnic Grounds (G), Sandy Branch Volunteer Fire Department (H), Town of McCormick Volunteer Fire Department (I), Northside Fire Department Northside Substation (J), McCormick Correctional Institution (K), Limestone Community Center (L). Display/hide their locations on the map
Churches in zip code 29835 include: Mount Zion Church (A), Mount Vernon Church (B), Bordeaux Church (C), Buffalo Baptist Church (D), First Baptist Church (E), McKissick Memorial Chapel (F), New Bordeaux Church (G), Willington Presbyterian Church (H), Highway Holy Church (I). Display/hide their locations on the map
Cemeteries: De La Howe Tomb (1), Badwell Cemetery (2), Bethany Cemetery (3), Bordeaux Cemetery (4), Buffalo Cemetery (5), McCormick City Cemetery (6), Mount Vernon Cemetery (7). Display/hide their locations on the map
Streams, rivers, and creeks: Cuffytown Creek (A), Wilson Spring Creek (B), Wilson Branch (C), Wiley Branch (D), Patterson Creek (E), Vall Branch (F), Taylor Branch (G), Buffalo Creek (H), Clay Branch (I). Display/hide their locations on the map
Parks in zip code 29835 include: Hickory Knob State Park (1), Baker Creek State Park (2), Buffalo Creek Recreation Area (3), Chamberlain Ferry Picnic Area (4), Hickory Knob State Park (5), Leroys Ferry Recreation Area (6), Long Cane Creek Picnic Area (7). Display/hide their locations on the map
In group quarters: 110 (-1 institutionalized population)
Size of family households: 1,578 2-persons, 204 3-persons, 91 4-persons, 32 5-persons, 21 6-persons, 24 7-or-more-persons
Size of nonfamily households: 940 1-person, 114 2-persons
36 married couples with children.
324 single-parent households (22 men, 302 women).
100.2% of residents of 29835 zip code speak English at home.
0.3% of residents speak Spanish at home (90% very well, 10% well).
0.4% of residents speak other Indo-European language at home (100% very well).
0.1% of residents speak other language at home (100% very well).
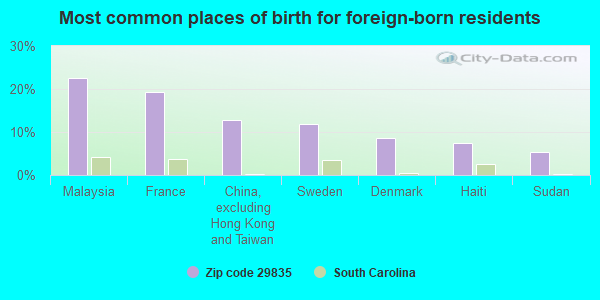
Foreign born population: 99 (1.6%) (91.5% of them are naturalized citizens)
This zip code:
1.6%
Whole state:
5.2%
23%Malaysia
19%France
13%China, excluding Hong Kong and Taiwan
12%Sweden
9%Denmark
8%Haiti
5%Sudan
14%English
12%American
12%Irish
11%African
9%German
3%Scottish
3%Norwegian
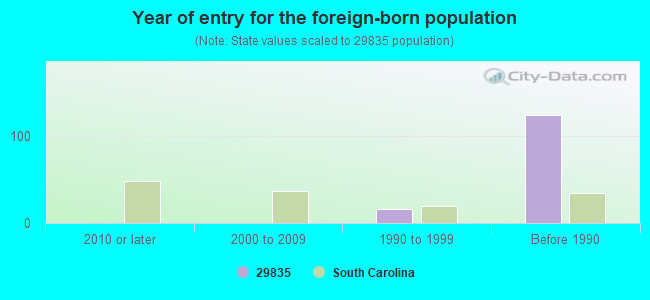
Year of entry for the foreign-born population
02010 or later
02000 to 2009
161990 to 1999
124Before 1990
Facilities with environmental interests located in this zip code:
CONCOINC (1 MILE E ON US HWY 378 in MC CORMICK, SC)
(Resource Conservation and Recovery Act (tracking hazardous waste)) STATE MASTER (South Carolina database) - HAZARDOUS WASTE PROGRAM Alternative names: CONCO INC
CSX TRANSPORTATION MCCORMICK (SC HIGHWAY 28 in MC CORMICK, SC)
(Resource Conservation and Recovery Act (tracking hazardous waste)) STATE MASTER (South Carolina database) - HAZARDOUS WASTE PROGRAM, SUPERFUND, National Pollutant Discharge Elimination System Permit Alternative names: CSX MCCORMICK TRAIN WRECK
FAST FARE SC-576 (201 HWYS 28 & 32 in MC CORMICK, SC)
(Resource Conservation and Recovery Act (tracking hazardous waste)) STATE MASTER (South Carolina database) - HAZARDOUS WASTE PROGRAM Organizations: CHARLES L POWELL (CONTACT/OWNER)
Alternative names: FAST FARE SC 576 DEACTIVATED
AUGUSTA READY MIX - MCCORMICK (US HWY 378 in MCCORMICK, SC)
AIR MINOR (AIRS/AFS) STATE MASTER (South Carolina database) - AIR PROGRAM, Business SIC classification: READY-MIXED CONCRETE Alternative names: AUGUSTA READY MIX:PLANT 1
Housing units lacking complete plumbing facilities: 4.8% Housing units lacking complete kitchen facilities: 4.6%
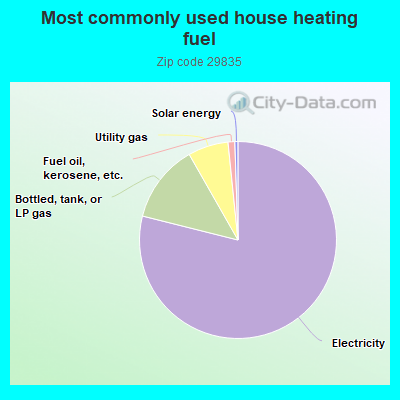
78.6%Electricity
12.8%Bottled, tank, or LP gas
6.6%Utility gas
1.1%Fuel oil, kerosene, etc.
0.5%Solar energy
Population in 1990: 5,426. Population change in the 1990s: +1,956 (+36.0%).
Place of birth for U.S.-born residents:
This state: 3,323
Northeast: 841
Midwest: 726
South: 1,080
West: 211
54% of the 29835 zip code residents lived in the same house 5 years ago. Out of people who lived in different houses, 25% lived in this county. Out of people who lived in different counties, 50% lived in South Carolina.
95% of the 29835 zip code residents lived in the same house 1 year ago. Out of people who lived in different houses, 5% moved from this county. Out of people who lived in different houses, 42% moved from different county within same state. Out of people who lived in different houses, 51% moved from different state. Out of people who lived in different houses, 11% moved from abroad.
Private vs. public school enrollment:
Students in private schools in grades 1 to 8 (elementary and middle school): 12
Here:
5.5%
South Carolina:
14.4%
Students in private schools in grades 9 to 12 (high school): 22
Here:
12.1%
South Carolina:
11.1%
Students in private undergraduate colleges: 42
Here:
31.1%
South Carolina:
21.9%
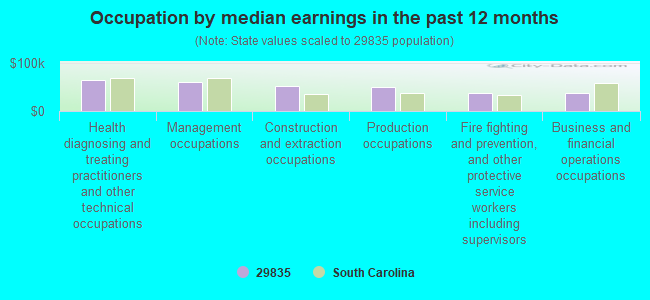
Occupation by median earnings in the past 12 months ($)
65,697Health diagnosing and treating practitioners and other technical occupations
60,213Management occupations
52,662Construction and extraction occupations
50,101Production occupations
38,225Fire fighting and prevention, and other protective service workers including supervisors
37,641Business and financial operations occupations
Companies with federal contracts located in this zip code:
J W FOOSHE, INC (305 S MAIN ST in MC CORMICK, SC; small business) : $45,730 in 3 contractsfrom 2002 to 2003
$29,700 with Army for Fuel Oils. Signed on 2002-05-17. Completion date: 2002-06-14.
$10,360, same as above.Signed on 2003-02-21. Completion date: 2003-02-24.
$5,670, same as above.Signed on 2003-01-30. Completion date: 2003-01-24.
JACHAT INC (308 MINE ST in MC CORMICK, SC; small business)
$2,880 with Army for Meat, Poultry, and Fish. Signed on 2004-06-09. Completion date: 2004-06-13.
Top industries in this zip code by the number of employees in 2005:
Health Care and Social Assistance: Nursing Care Facilities (100-249 employees: 2 establishments)
Other Services (except Public Administration): Other Similar Organizations (except Business, Professional, Labor, and Political Organizations) (100-249: 1, 1-4: 1)
Accommodation and Food Services: Limited-Service Restaurants (20-49: 1, 1-4: 2)
Other Services (except Public Administration): Religious Organizations (5-9: 3, 1-4: 1)
People in group quarters in 2010:
38 people in residential treatment centers for juveniles (non-correctional)
11 people in group homes for juveniles (non-correctional)
7 people in residential treatment centers for adults
6 people in emergency and transitional shelters (with sleeping facilities) for people experiencing homelessness
People in group quarters in 2000:
1,170 people in state prisons
116 people in other noninstitutional group quarters
111 people in nursing homes
12 people in local jails and other confinement facilities (including police lockups)
10 people in homes for abused, dependent, and neglected children
7 people in homes for the mentally retarded
Fatal accident statistics in 2013:
Fatal accident count: 1
Vehicles involved in fatal accidents: 1
Fatal accidents caused by drunken drivers: 0
Fatalities: 1
Persons involved in fatal accidents: 1
Pedestrians involved in fatal accidents: 0
Fatal accident statistics in 2012:
Fatal accident count: 2
Vehicles involved in fatal accidents: 3
Fatal accidents caused by drunken drivers: 2
Fatalities: 3
Persons involved in fatal accidents: 4
Pedestrians involved in fatal accidents: 0
2003 - 2018 National Fire Incident Reporting System (NFIRS) incidents
According to the data from the years 2003 - 2018 the average number of fires per year is 23. The highest number of reported fire incidents - 47 took place in 2016, and the least - 0 in 2011. The data has a rising trend.
When looking into fire subcategories, the most reports belonged to: Structure Fires (44.4%), and Outside Fires (43.0%).
Fire incident types reported to NFIRS in Zip Code 29835

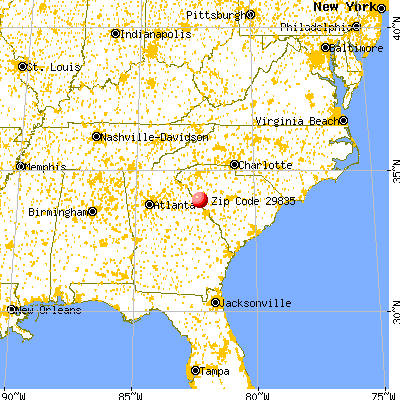


 Nearest zip codes: 29899, 29845, 29819, 29844, 30817, 29848.


 According to the data from the years 2003 - 2018 the average number of fires per year is 23. The highest number of reported fire incidents - 47 took place in 2016, and the least - 0 in 2011. The data has a rising trend.
 When looking into fire subcategories, the most reports belonged to: Structure Fires (44.4%), and Outside Fires (43.0%).