Estimated zip code population in 2022: 1,186 Zip code population in 2010: 1,104 Zip code population in 2000: 1,177
Houses and condos: 843 Renter-occupied apartments: 136
% of renters here:
24%
State:
28%
March 2022 cost of living index in zip code 29845: 78.9 (low, U.S. average is 100)
Land area: 65.8 sq. mi. Water area: 3.7 sq. mi.
Population density: 18 people per square mile
(very low).
OSM Map
General Map
Google Map
MSN Map
OSM Map
General Map
Google Map
MSN Map
OSM Map
General Map
Google Map
MSN Map
OSM Map
General Map
Google Map
MSN Map
Please wait while loading the map...
Real estate property taxes paid for housing units in 2022:
This zip code:
0.7% ($520)
South Carolina:
0.5% ($1,185)
Median real estate property taxes paid for housing units with mortgages in 2022: $430 (0.6%) Median real estate property taxes paid for housing units with no mortgage in 2022: $564 (0.7%)
Business Search- 14 Million verified businesses
Males: 551
(46.5%)
Females: 634
(53.5%)
For population 25 years and over in 29845:
High school or higher: 83.4%
Bachelor's degree or higher: 14.8%
Graduate or professional degree: 1.7%
Unemployed: 0.5%
Mean travel time to work (commute): 30.4 minutes
For population 15 years and over in 29845:
Never married: 26.2%
Now married: 52.4%
Separated: 3.0%
Widowed: 6.7%
Divorced: 11.7%
Zip code 29845 compared to state average:
Median house value significantly below state average.
Unemployed percentage significantly below state average.
Black race population percentage above state average.
Hispanic race population percentage significantly below state average.
Median age significantly above state average.
Foreign-born population percentage significantly below state average.
Length of stay since moving in significantly above state average.
Number of college students significantly below state average.
Percentage of population with a bachelor's degree or higher below state average.
Estimated median house/condo value in 2022: $78,194
29845:
$78,194
South Carolina:
$254,600
Median resident age:
This zip code:
55.7 years
South Carolina median age:
40.5 years
Average household size:
This zip code:
2.1 people
South Carolina:
2.4 people
Averages for the 2020 tax year for zip code 29845, filed in 2021:
Average Adjusted Gross Income (AGI) in 2020: $40,569 (Individual Income Tax Returns)
Here:
$40,569
State:
$65,754
Salary/wage: $35,860 (reported on 72.7% of returns)
Here:
$35,860
State:
$52,566
(% of AGI for various income ranges: 1268.1% for AGIs below $25k, 3841.8% for AGIs $25k-50k, 5820.0% for AGIs $50k-75k, 4350.0% for AGIs $75k-100k)
Taxable interest for individuals: $310 (reported on 18.2% of returns)
This zip code:
$310
South Carolina:
$1,749
(% of AGI for various income ranges: 5.6% for AGIs below $25k, 5.5% for AGIs $25k-50k, 40.0% for AGIs $75k-100k)
Ordinary dividends: $1,420 (reported on 9.1% of returns)
Here:
$1,420
State:
$8,783
(% of AGI for various income ranges: 142.0% for AGIs $50k-75k)
Net capital gain/loss in AGI: +$3,260 (reported on 9.1% of returns)
Here:
+$3,260
State:
+$24,194
(% of AGI for various income ranges: 4.4% for AGIs below $25k, 312.0% for AGIs $50k-75k)
Profit/loss from business: +$3,644 (reported on 16.4% of returns)
Here:
+$3,644
State:
+$11,253
(% of AGI for various income ranges: 110.0% for AGIs below $25k, 138.2% for AGIs $25k-50k)
Taxable individual retirement arrangement distribution: $15,075 (reported on 7.3% of returns)
29845:
$15,075
South Carolina:
$21,604
(% of AGI for various income ranges: 88.8% for AGIs below $25k, 922.0% for AGIs $50k-75k)
Earned income credit: $2,269 (reported on 23.6% of returns)
Here:
$2,269
State:
$2,397
(% of AGI for various income ranges: 128.8% for AGIs below $25k, 80.9% for AGIs $25k-50k)
Percentage of individuals using paid preparers for their 2020 taxes: 87.3%
Here:
87%
State:
93%
(% for various income ranges: 87.0% for AGIs below $25k, 87.5% for AGIs $25k-50k, 87.5% for AGIs $50k-75k, 75.0% for AGIs $75k-100k, 100.0% for AGIs $100k-200k)
Averages for the 2012 tax year for zip code 29845, filed in 2013:
Average Adjusted Gross Income (AGI) in 2012: $33,120 (Individual Income Tax Returns)
Here:
$33,120
State:
$51,133
Salary/wage: $29,986 (reported on 84.0% of returns)
Here:
$29,986
State:
$42,173
(% of AGI for various income ranges: 77.8% for AGIs below $25k, 78.6% for AGIs $25k-50k, 74.8% for AGIs $50k-75k, 72.0% for AGIs $75k-100k)
Taxable interest for individuals: $400 (reported on 16.0% of returns)
This zip code:
$400
South Carolina:
$1,468
(% of AGI for various income ranges: 0.2% for AGIs $25k-50k, 0.6% for AGIs $50k-75k)
Ordinary dividends: $525 (reported on 8.0% of returns)
Here:
$525
State:
$6,511
Profit/loss from business: +$4,750 (reported on 12.0% of returns)
Here:
+$4,750
State:
+$10,167
(% of AGI for various income ranges: 5.6% for AGIs below $25k, 1.8% for AGIs $25k-50k)
Taxable individual retirement arrangement distribution: $10,067 (reported on 6.0% of returns)
29845:
$10,067
South Carolina:
$17,019
Total itemized deductions: $14,820 (26% of AGI, reported on 20.0% of returns)
Here:
$14,820
State:
$22,890
Here:
25.9% of AGI
State:
21.4% of AGI
(% of AGI for various income ranges: 9.3% for AGIs $25k-50k, 10.7% for AGIs $50k-75k, 14.2% for AGIs $75k-100k)
Charity contributions: $3,814 (reported on 14.0% of returns)
Here:
$3,814
State:
$5,169
(% of AGI for various income ranges: 2.6% for AGIs $25k-50k, 3.1% for AGIs $75k-100k)
Taxes paid: $3,770 (reported on 20.0% of returns)
29845:
$3,770
State:
$7,644
(% of AGI for various income ranges: 1.7% for AGIs $25k-50k, 2.6% for AGIs $50k-75k, 4.7% for AGIs $75k-100k)
Earned income credit: $2,441 (reported on 34.0% of returns)
Here:
$2,441
State:
$2,418
(% of AGI for various income ranges: 10.6% for AGIs below $25k, 1.2% for AGIs $25k-50k)
Percentage of individuals using paid preparers for their 2012 taxes: 60.0%
Here:
60%
State:
57%
(% for various income ranges: 58.3% for AGIs below $25k, 56.2% for AGIs $25k-50k, 66.7% for AGIs $50k-75k, 75.0% for AGIs $75k-100k)
Averages for the 2004 tax year for zip code 29845, filed in 2005:
Average Adjusted Gross Income (AGI) in 2004: $26,353 (Individual Income Tax Returns)
Here:
$26,353
State:
$41,965
Salary/wage: $25,706 (reported on 87.3% of returns)
Here:
$25,706
State:
$35,695
(% of AGI for various income ranges: 125.2% for AGIs below $10k, 83.5% for AGIs $10k-25k, 87.7% for AGIs $25k-50k, 89.6% for AGIs $50k-75k, 62.0% for AGIs $75k-100k)
Taxable interest for individuals: $426 (reported on 20.4% of returns)
This zip code:
$426
South Carolina:
$1,623
(% of AGI for various income ranges: 1.0% for AGIs below $10k, 0.5% for AGIs $10k-25k, 0.3% for AGIs $25k-50k, 0.2% for AGIs $50k-75k)
Taxable dividends: $730 (reported on 7.0% of returns)
Here:
$730
State:
$3,999
Net capital gain/loss: +$833 (reported on 5.7% of returns)
Here:
+$833
State:
+$13,100
Profit/loss from business: +$1,353 (reported on 6.4% of returns)
Here:
+$1,353
State:
+$9,144
Total itemized deductions: $13,890 (32% of AGI, reported on 22.3% of returns)
Here:
$13,890
State:
$19,039
Here:
31.9% of AGI
State:
22.8% of AGI
(% of AGI for various income ranges: 7.8% for AGIs $10k-25k, 11.6% for AGIs $25k-50k, 18.5% for AGIs $50k-75k, 12.1% for AGIs $75k-100k)
Charity contributions deductions: $3,279 (7% of AGI, reported on 21.0% of returns)
Here:
$3,279
State:
$4,305
Here:
7.4% of AGI
State:
5.0% of AGI
(% of AGI for various income ranges: 1.6% for AGIs $10k-25k, 2.6% for AGIs $25k-50k, 4.1% for AGIs $50k-75k, 3.0% for AGIs $75k-100k)
Total tax: $2,438 (reported on 59.2% of returns)
29845:
$2,438
State:
$6,497
(% of AGI for various income ranges: 2.2% for AGIs below $10k, 2.3% for AGIs $10k-25k, 5.2% for AGIs $25k-50k, 7.9% for AGIs $50k-75k, 10.1% for AGIs $75k-100k)
Earned income credit: $1,872 (reported on 36.9% of returns)
Here:
$1,872
State:
$1,882
Percentage of individuals using paid preparers for their 2004 taxes: 76.7%
Here:
77%
State:
66%
(% for various income ranges: 73.6% for AGIs below $10k, 78.9% for AGIs $10k-25k, 77.4% for AGIs $25k-50k, 70.2% for AGIs $50k-75k, 82.4% for AGIs $75k-100k)
Household received Food Stamps/SNAP in the past 12 months: 60 Household did not receive Food Stamps/SNAP in the past 12 months: 509
Women who had a birth in the past 12 months: 58 (54 now married, 6 unmarried) Women who did not have a birth in the past 12 months: 150 (61 now married, 88 unmarried)
Housing units in zip code 29845 with a mortgage: 143 (4 second mortgage, 4 both second mortgage and home equity loan) Houses without a mortgage: 1
Median monthly owner costs for units with a mortgage: $1,116 Median monthly owner costs for units without a mortgage: $383
Residents with income below the poverty level in 2022:
This zip code:
9.8%
Whole state:
14.0%
Residents with income below 50% of the poverty level in 2022:
This zip code:
7.2%
Whole state:
7.3%
Median number of rooms in houses and condos:
Here:
5.7
State:
6.4
Median number of rooms in apartments:
Here:
4.9
State:
4.5
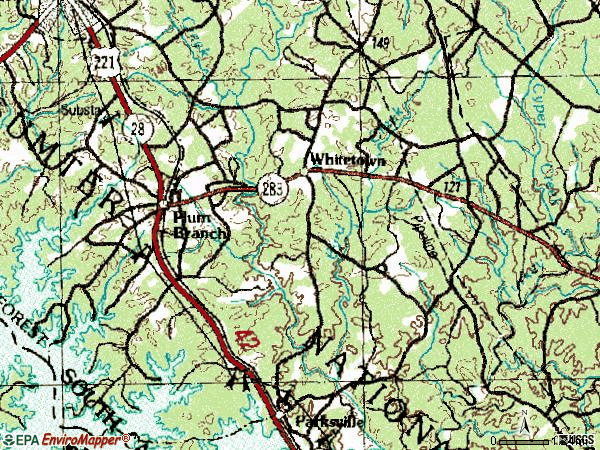
Notable locations in this zip code not listed on our city pages
Notable locations in zip code 29845: Key Bridge Hunt Camp (A), Byrd Creek Rifle Range (B), Clark Hill Marina (C), Prices Mill (D), Plum Branch Volunteer Fire Department (E). Display/hide their locations on the map
Churches in zip code 29845 include: Pine Grove Church (A), Mount Moriah Church (B), Mount Lebanon Church (C), New Hope Church (D), Plum Branch Baptist Church (E), Cedar Springs Church (F), Rehoboth Church (G). Display/hide their locations on the map
Cemeteries: Pine Grove Cemetery (1), Plum Branch Cemetery (2), Rohoboth Cemetery (3), Old Rohoboth Cemetery (4), New Hope Cemetery (5). Display/hide their locations on the map
Streams, rivers, and creeks: Byrd Creek (A), Mack Branch (B), Landam Branch (C), Dordon Creek (D), Coon Creek (E), Church Branch (F). Display/hide their locations on the map
Size of family households: 274 2-persons, 100 3-persons, 7 4-persons, 2 5-persons, 10 6-persons
Size of nonfamily households: 170 1-person, 9 2-persons
50 married couples with children.
45 single-parent households (16 men, 29 women).
100.3% of residents of 29845 zip code speak English at home.
0.2% of residents speak other Indo-European language at home (100% very well).
Foreign born population: 1 (0.1%) (100.0% of them are naturalized citizens)
This zip code:
0.1%
Whole state:
5.2%
100%France
26%African
20%American
7%English
4%German
2%Irish
1%Scottish
1%Scotch-Irish
Facilities with environmental interests located in this zip code:
FUNWAY INDUSTRIES INC (HIGHWAY 28 in PLUM BRANCH, SC)
(Resource Conservation and Recovery Act (tracking hazardous waste)) STATE MASTER (South Carolina database) - HAZARDOUS WASTE PROGRAM Organizations: OPERNAME (CONTACT/OPERATOR)
, ED JORDAN (CONTACT/OWNER)
Alternative names: FUNWAY INDUSTRIES INC_ DEACTIVATED
Housing units lacking complete plumbing facilities: 5.7% Housing units lacking complete kitchen facilities: 6.1%
68.2%Electricity
13.6%Fuel oil, kerosene, etc.
8.8%Bottled, tank, or LP gas
7.8%Utility gas
2.0%No fuel used
Population in 1990: 1,144. Population change in the 1990s: +33 (+2.9%).
Place of birth for U.S.-born residents:
This state: 812
Northeast: 11
Midwest: 20
South: 312
West: 11
78% of the 29845 zip code residents lived in the same house 5 years ago. Out of people who lived in different houses, 66% lived in this county. Out of people who lived in different counties, 50% lived in South Carolina.
97% of the 29845 zip code residents lived in the same house 1 year ago. Out of people who lived in different houses, 18% moved from this county. Out of people who lived in different houses, 79% moved from different county within same state.
Private vs. public school enrollment:
Students in private schools in grades 1 to 8 (elementary and middle school): 17
Here:
43.9%
South Carolina:
14.4%
Students in private schools in grades 9 to 12 (high school):
Here:
0.0%
South Carolina:
11.1%
Students in private undergraduate colleges:
Here:
0.0%
South Carolina:
21.9%
Occupation by median earnings in the past 12 months ($)
70,939Transportation occupations
67,468Health diagnosing and treating practitioners and other technical occupations
62,706Management occupations
41,188Production occupations
37,981Office and administrative support occupations
21,602Sales and related occupations
Top industries in this zip code by the number of employees in 2005:
Health Care and Social Assistance: Child Day Care Services (10-19 employees: 1 establishment)
Construction: Highway, Street, and Bridge Construction (1-4: 1)
Other Services (except Public Administration): Religious Organizations (1-4: 1)
Other Services (except Public Administration): Beauty Salons (1-4: 1)
Arts, Entertainment, and Recreation: Marinas (1-4: 1)
Construction: Commercial and Institutional Building Construction (1-4: 1)
Fatal accident statistics in 2014:
Fatal accident count: 1
Vehicles involved in fatal accidents: 1
Fatal accidents caused by drunken drivers: 0
Fatalities: 1
Persons involved in fatal accidents: 1
Pedestrians involved in fatal accidents: 0
Fatal accident statistics in 2010:
Fatal accident count: 1
Vehicles involved in fatal accidents: 2
Fatal accidents caused by drunken drivers: 1
Fatalities: 1
Persons involved in fatal accidents: 2
Pedestrians involved in fatal accidents: 0
Most common first names in zip code 29845 among deceased individuals
Name
Count
Lived (average)
James
17
71.4 years
Willie
15
67.4 years
William
13
73.6 years
John
9
69.5 years
George
9
67.7 years
Charles
8
75.8 years
Robert
7
66.4 years
Joe
6
74.8 years
Fred
6
75.0 years
Harold
5
60.0 years
Most common last names in zip code 29845 among deceased individuals
Last name
Count
Lived (average)
White
20
71.7 years
Price
15
78.6 years
Cunningham
11
77.4 years
Gilchrist
10
79.1 years
Harrison
7
62.6 years
Morgan
7
58.7 years
Chamberlain
7
75.4 years
Robertson
7
73.3 years
Wilkie
6
66.1 years
Searles
6
79.2 years
Discuss Parksville, South Carolina (SC) on our hugely popular South Carolina forum.

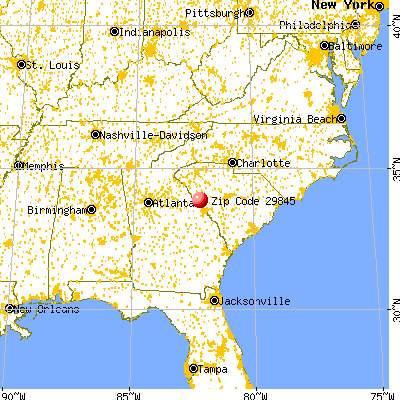


 Nearest zip codes: 29844, 29838, 29899, 29835, 29848, 29821.