Estimated zip code population in 2022: 5,659 Zip code population in 2010: 4,487 Zip code population in 2000: 3,446
Houses and condos: 1,887 Renter-occupied apartments: 355
% of renters here:
20%
State:
34%
March 2022 cost of living index in zip code 30543: 82.3 (low, U.S. average is 100)
Land area: 37.7 sq. mi. Water area: 0.2 sq. mi.
Population density: 150 people per square mile
(very low).
OSM Map
General Map
Google Map
MSN Map
OSM Map
General Map
Google Map
MSN Map
OSM Map
General Map
Google Map
MSN Map
OSM Map
General Map
Google Map
MSN Map
Please wait while loading the map...
Real estate property taxes paid for housing units in 2022:
This zip code:
0.7% ($1,906)
Georgia:
0.7% ($2,160)
Median real estate property taxes paid for housing units with mortgages in 2022: $2,187 (0.8%) Median real estate property taxes paid for housing units with no mortgage in 2022: $1,377 (0.6%)
Business Search- 14 Million verified businesses
Males: 2,827
(50.0%)
Females: 2,832
(50.0%)
For population 25 years and over in 30543:
High school or higher: 73.0%
Bachelor's degree or higher: 8.1%
Graduate or professional degree: 3.3%
Unemployed: 5.2%
Mean travel time to work (commute): 32.4 minutes
For population 15 years and over in 30543:
Never married: 24.0%
Now married: 59.5%
Separated: 1.9%
Widowed: 5.3%
Divorced: 9.3%
Zip code 30543 compared to state average:
Black race population percentage significantly below state average.
Hispanic race population percentage significantly above state average.
Renting percentage below state average.
Number of college students below state average.
Percentage of population with a bachelor's degree or higher significantly below state average.
Averages for the 2020 tax year for zip code 30543, filed in 2021:
Average Adjusted Gross Income (AGI) in 2020: $51,420 (Individual Income Tax Returns)
Here:
$51,420
State:
$70,847
Salary/wage: $43,836 (reported on 86.5% of returns)
Here:
$43,836
State:
$59,126
(% of AGI for various income ranges: 1237.0% for AGIs below $25k, 3711.6% for AGIs $25k-50k, 7380.0% for AGIs $50k-75k, 9680.0% for AGIs $75k-100k, 16253.3% for AGIs $100k-200k)
Taxable interest for individuals: $1,180 (reported on 15.3% of returns)
This zip code:
$1,180
Georgia:
$2,011
(% of AGI for various income ranges: 6.1% for AGIs below $25k, 12.1% for AGIs $25k-50k, 11.5% for AGIs $50k-75k, 41.3% for AGIs $75k-100k, 106.7% for AGIs $100k-200k)
Ordinary dividends: $4,333 (reported on 6.6% of returns)
Here:
$4,333
State:
$8,996
(% of AGI for various income ranges: 8.0% for AGIs below $25k, 7.0% for AGIs $25k-50k, 19.6% for AGIs $50k-75k, 68.0% for AGIs $75k-100k, 338.3% for AGIs $100k-200k)
Net capital gain/loss in AGI: +$12,976 (reported on 7.4% of returns)
Here:
+$12,976
State:
+$28,402
(% of AGI for various income ranges: 2.5% for AGIs below $25k, 3.0% for AGIs $25k-50k, 44.6% for AGIs $50k-75k, 146.7% for AGIs $75k-100k, 1530.8% for AGIs $100k-200k)
Profit/loss from business: +$8,383 (reported on 18.3% of returns)
Here:
+$8,383
State:
+$6,707
(% of AGI for various income ranges: 200.0% for AGIs below $25k, 140.5% for AGIs $25k-50k, 195.8% for AGIs $50k-75k, 21.3% for AGIs $75k-100k, 749.2% for AGIs $100k-200k)
Taxable individual retirement arrangement distribution: $17,589 (reported on 3.9% of returns)
30543:
$17,589
Georgia:
$20,525
(% of AGI for various income ranges: 44.7% for AGIs below $25k, 151.2% for AGIs $50k-75k, 753.3% for AGIs $100k-200k)
Total itemized deductions: $27,492 (reported on 5.7% of returns)
Here:
$27,492
State:
$34,001
(% of AGI for various income ranges: 93.2% for AGIs $25k-50k, 250.4% for AGIs $50k-75k, 408.7% for AGIs $75k-100k, 1482.5% for AGIs $100k-200k)
Charity contributions: $9,109 (reported on 4.8% of returns)
Here:
$9,109
State:
$14,164
(% of AGI for various income ranges: 58.8% for AGIs $50k-75k, 77.3% for AGIs $75k-100k, 610.8% for AGIs $100k-200k)
Taxes paid: $6,992 (reported on 5.7% of returns)
30543:
$6,992
State:
$7,540
(% of AGI for various income ranges: 18.4% for AGIs $25k-50k, 75.4% for AGIs $50k-75k, 103.3% for AGIs $75k-100k, 377.5% for AGIs $100k-200k)
Earned income credit: $2,459 (reported on 23.6% of returns)
Here:
$2,459
State:
$2,530
(% of AGI for various income ranges: 129.8% for AGIs below $25k, 87.2% for AGIs $25k-50k)
Percentage of individuals using paid preparers for their 2020 taxes: 93.9%
Here:
94%
State:
93%
(% for various income ranges: 91.6% for AGIs below $25k, 95.5% for AGIs $25k-50k, 97.2% for AGIs $50k-75k, 95.0% for AGIs $75k-100k, 90.0% for AGIs $100k-200k, 100.0% for AGIs over 200k)
Averages for the 2012 tax year for zip code 30543, filed in 2013:
Average Adjusted Gross Income (AGI) in 2012: $38,644 (Individual Income Tax Returns)
Here:
$38,644
State:
$56,131
Salary/wage: $36,117 (reported on 86.3% of returns)
Here:
$36,117
State:
$47,942
(% of AGI for various income ranges: 78.9% for AGIs below $25k, 84.3% for AGIs $25k-50k, 86.8% for AGIs $50k-75k, 84.3% for AGIs $75k-100k, 67.4% for AGIs $100k-200k)
Taxable interest for individuals: $1,358 (reported on 18.9% of returns)
This zip code:
$1,358
Georgia:
$1,706
(% of AGI for various income ranges: 1.3% for AGIs below $25k, 0.8% for AGIs $25k-50k, 0.4% for AGIs $50k-75k, 0.3% for AGIs $75k-100k, 0.6% for AGIs $100k-200k)
Ordinary dividends: $2,019 (reported on 9.1% of returns)
Here:
$2,019
State:
$7,265
(% of AGI for various income ranges: 0.4% for AGIs below $25k, 0.3% for AGIs $25k-50k, 0.9% for AGIs $50k-75k, 0.6% for AGIs $100k-200k)
Profit/loss from business: +$6,320 (reported on 17.1% of returns)
Here:
+$6,320
State:
+$7,583
(% of AGI for various income ranges: 8.9% for AGIs below $25k, 2.6% for AGIs $25k-50k, 1.9% for AGIs $50k-75k, 2.2% for AGIs $75k-100k)
Taxable individual retirement arrangement distribution: $12,127 (reported on 6.3% of returns)
30543:
$12,127
Georgia:
$17,199
(% of AGI for various income ranges: 2.9% for AGIs below $25k, 2.3% for AGIs $25k-50k, 6.5% for AGIs $75k-100k)
Total itemized deductions: $17,775 (27% of AGI, reported on 29.7% of returns)
Here:
$17,775
State:
$23,886
Here:
26.8% of AGI
State:
21.5% of AGI
(% of AGI for various income ranges: 10.2% for AGIs below $25k, 12.7% for AGIs $25k-50k, 15.0% for AGIs $50k-75k, 15.1% for AGIs $75k-100k, 14.8% for AGIs $100k-200k)
Charity contributions: $3,092 (reported on 22.9% of returns)
Here:
$3,092
State:
$5,507
(% of AGI for various income ranges: 1.0% for AGIs below $25k, 1.3% for AGIs $25k-50k, 1.6% for AGIs $50k-75k, 2.3% for AGIs $75k-100k, 3.2% for AGIs $100k-200k)
Taxes paid: $4,588 (reported on 29.7% of returns)
30543:
$4,588
State:
$7,838
(% of AGI for various income ranges: 1.3% for AGIs below $25k, 2.3% for AGIs $25k-50k, 3.6% for AGIs $50k-75k, 4.9% for AGIs $75k-100k, 5.7% for AGIs $100k-200k)
Earned income credit: $2,390 (reported on 29.1% of returns)
Here:
$2,390
State:
$2,589
(% of AGI for various income ranges: 8.2% for AGIs below $25k, 2.1% for AGIs $25k-50k)
Percentage of individuals using paid preparers for their 2012 taxes: 60.0%
Here:
60%
State:
55%
(% for various income ranges: 58.2% for AGIs below $25k, 62.5% for AGIs $25k-50k, 66.7% for AGIs $50k-75k, 50.0% for AGIs $75k-100k, 55.6% for AGIs $100k-200k)
Averages for the 2004 tax year for zip code 30543, filed in 2005:
Average Adjusted Gross Income (AGI) in 2004: $37,754 (Individual Income Tax Returns)
Here:
$37,754
State:
$47,553
Salary/wage: $34,838 (reported on 89.0% of returns)
Here:
$34,838
State:
$42,178
(% of AGI for various income ranges: 103.7% for AGIs below $10k, 80.3% for AGIs $10k-25k, 90.3% for AGIs $25k-50k, 86.7% for AGIs $50k-75k, 90.2% for AGIs $75k-100k, 49.2% for AGIs over 100k)
Taxable interest for individuals: $1,346 (reported on 27.5% of returns)
This zip code:
$1,346
Georgia:
$1,772
(% of AGI for various income ranges: 3.5% for AGIs below $10k, 2.2% for AGIs $10k-25k, 0.7% for AGIs $25k-50k, 0.6% for AGIs $50k-75k, 0.4% for AGIs $75k-100k, 1.5% for AGIs over 100k)
Taxable dividends: $2,403 (reported on 12.4% of returns)
Here:
$2,403
State:
$4,283
(% of AGI for various income ranges: 1.5% for AGIs below $10k, 0.2% for AGIs $10k-25k, 0.1% for AGIs $25k-50k, 0.5% for AGIs $50k-75k, 0.1% for AGIs $75k-100k, 3.7% for AGIs over 100k)
Net capital gain/loss: +$3,949 (reported on 8.3% of returns)
Here:
+$3,949
State:
+$16,461
(% of AGI for various income ranges: 0.7% for AGIs below $10k, 1.2% for AGIs $10k-25k, 0.1% for AGIs $25k-50k, 1.6% for AGIs $50k-75k, 1.6% for AGIs over 100k)
Profit/loss from business: +$5,812 (reported on 15.0% of returns)
Here:
+$5,812
State:
+$8,201
(% of AGI for various income ranges: 15.3% for AGIs below $10k, 6.5% for AGIs $10k-25k, 1.9% for AGIs $25k-50k, 2.0% for AGIs $50k-75k, 1.2% for AGIs $75k-100k)
IRA payment deduction: $2,400 (reported on 2.4% of returns)
30543:
$2,400
Georgia:
$2,969
Total itemized deductions: $14,598 (25% of AGI, reported on 37.4% of returns)
Here:
$14,598
State:
$19,944
Here:
24.8% of AGI
State:
22.6% of AGI
(% of AGI for various income ranges: 15.2% for AGIs $10k-25k, 13.8% for AGIs $25k-50k, 16.2% for AGIs $50k-75k, 15.4% for AGIs $75k-100k, 12.9% for AGIs over 100k)
Charity contributions deductions: $2,874 (5% of AGI, reported on 29.5% of returns)
Here:
$2,874
State:
$4,354
Here:
4.8% of AGI
State:
4.7% of AGI
(% of AGI for various income ranges: 1.5% for AGIs $10k-25k, 1.8% for AGIs $25k-50k, 2.3% for AGIs $50k-75k, 2.4% for AGIs $75k-100k, 3.7% for AGIs over 100k)
Total tax: $4,480 (reported on 69.8% of returns)
30543:
$4,480
State:
$8,223
(% of AGI for various income ranges: 4.1% for AGIs below $10k, 3.8% for AGIs $10k-25k, 5.3% for AGIs $25k-50k, 7.5% for AGIs $50k-75k, 9.3% for AGIs $75k-100k, 18.8% for AGIs over 100k)
Earned income credit: $1,832 (reported on 20.0% of returns)
Here:
$1,832
State:
$1,986
Percentage of individuals using paid preparers for their 2004 taxes: 70.4%
Here:
70%
State:
62%
(% for various income ranges: 61.6% for AGIs below $10k, 72.1% for AGIs $10k-25k, 72.1% for AGIs $25k-50k, 72.8% for AGIs $50k-75k, 67.0% for AGIs $75k-100k, 78.6% for AGIs over 100k)
Household received Food Stamps/SNAP in the past 12 months: 40 Household did not receive Food Stamps/SNAP in the past 12 months: 1,721
Women who had a birth in the past 12 months: 47 (47 now married, 0 unmarried) Women who did not have a birth in the past 12 months: 1,230 (763 now married, 464 unmarried)
Housing units in zip code 30543 with a mortgage: 894 (21 second mortgage, 16 both second mortgage and home equity loan) Houses without a mortgage: 29
Median monthly owner costs for units with a mortgage: $1,266 Median monthly owner costs for units without a mortgage: $379
Residents with income below the poverty level in 2022:
This zip code:
11.0%
Whole state:
12.7%
Residents with income below 50% of the poverty level in 2022:
This zip code:
9.2%
Whole state:
6.3%
Median number of rooms in houses and condos:
Here:
6.3
State:
6.8
Median number of rooms in apartments:
Here:
5.7
State:
4.6
Notable locations in this zip code not listed on our city pages
Notable locations in zip code 30543: Hall County Fire Services Station 10 (A), Banks County Fire and Emergency Medical Services Station 240 (B). Display/hide their locations on the map
Churches in zip code 30543 include: Gillsville Baptist Church (A), Lebanon Church (B), Midway Church (C), Pine Grove Church (D), Pleasant Hill Church (E). Display/hide their locations on the map
Cemeteries: Midway Cemetery (1), Gillsville Cemetery (2), Pine Grove Cemetery (3), Henderson Cemetery (4), Lebanon Cemetery (5), Jarrett Cemetery (6), King Cemetery (7). Display/hide their locations on the map
Size of family households: 352 2-persons, 223 3-persons, 415 4-persons, 145 5-persons, 200 6-persons, 22 7-or-more-persons
Size of nonfamily households: 363 1-person, 43 2-persons, 13 4-persons
1,285 married couples with children.
381 single-parent households (173 men, 208 women).
66.0% of residents of 30543 zip code speak English at home.
32.9% of residents speak Spanish at home (51% very well, 21% well, 20% not well, 8% not at all).
0.3% of residents speak other Indo-European language at home (100% well).
Foreign born population: 789 (13.9%) (17.5% of them are naturalized citizens)
This zip code:
13.9%
Whole state:
10.7%
89%Honduras
5%Costa Rica
28%American
6%English
4%Irish
3%German
1%Scottish
1%African
0%British
Year of entry for the foreign-born population
5482010 or later
3142000 to 2009
2021990 to 1999
93Before 1990
Facilities with environmental interests located in this zip code:
(Resource Conservation and Recovery Act (tracking hazardous waste)) Organizations: OPERNAME (CONTACT/OPERATOR)
, SIMPSON TRUCKING & GRADING (CONTACT/OWNER)
Alternative names: JOE & DOUGS TRUCK EQUIPMENT
DAVIS LARRY GRADING (4996 GILLSVILLE HWY in GILLSVILLE, GA)
(Resource Conservation and Recovery Act (tracking hazardous waste)) Organizations: LARRY DAVIS SR (CONTACT/OWNER)
Housing units lacking complete plumbing facilities: 2.1% Housing units lacking complete kitchen facilities: 3.4%
72.3%Electricity
13.8%Utility gas
9.3%Bottled, tank, or LP gas
4.1%Wood
0.7%No fuel used
Population in 1990: 1,585. Population change in the 1990s: +1,861 (+117.4%).
Place of birth for U.S.-born residents:
This state: 3,762
Northeast: 239
Midwest: 95
South: 339
West: 83
54% of the 30543 zip code residents lived in the same house 5 years ago. Out of people who lived in different houses, 62% lived in this county. Out of people who lived in different counties, 50% lived in Georgia.
93% of the 30543 zip code residents lived in the same house 1 year ago. Out of people who lived in different houses, 42% moved from this county. Out of people who lived in different houses, 56% moved from different county within same state.
Private vs. public school enrollment:
Students in private schools in grades 1 to 8 (elementary and middle school): 241
Here:
22.2%
Georgia:
12.1%
Students in private schools in grades 9 to 12 (high school): 94
Here:
23.3%
Georgia:
10.8%
Students in private undergraduate colleges: 29
Here:
31.6%
Georgia:
17.1%
Occupation by median earnings in the past 12 months ($)
85,160Construction and extraction occupations
73,403Health diagnosing and treating practitioners and other technical occupations
72,274Architecture and engineering occupations
60,503Management occupations
53,713Health technologists and technicians
49,556Business and financial operations occupations
Top industries in this zip code by the number of employees in 2005:
Health Care and Social Assistance: Other Individual and Family Services (100-249 employees: 1 establishment)
Construction: Highway, Street, and Bridge Construction (20-49: 1)
Construction: Plumbing, Heating, and Air-Conditioning Contractors (5-9: 1, 1-4: 2)
Other Services (except Public Administration): Religious Organizations (5-9: 1, 1-4: 2)
Other Services (except Public Administration): Commercial and Industrial Machinery and Equipment (except Automotive and Electronic) Repair and Maintenance (5-9: 1)
Fatal accident statistics in 2013:
Fatal accident count: 2
Vehicles involved in fatal accidents: 2
Fatal accidents caused by drunken drivers: 1
Fatalities: 2
Persons involved in fatal accidents: 2
Pedestrians involved in fatal accidents: 0
Fatal accident statistics in 2012:
Fatal accident count: 2
Vehicles involved in fatal accidents: 2
Fatal accidents caused by drunken drivers: 2
Fatalities: 2
Persons involved in fatal accidents: 2
Pedestrians involved in fatal accidents: 0
Home Mortgage Disclosure Act Aggregated Statistics For Year 2009 (Based on 4 partial tracts)
A) FHA, FSA/RHS & VA Home Purchase Loans
B) Conventional Home Purchase Loans
C) Refinancings
D) Home Improvement Loans
F) Non-occupant Loans on < 5 Family Dwellings (A B C & D)
G) Loans On Manufactured Home Dwelling (A B C & D)
Number
Average Value
Number
Average Value
Number
Average Value
Number
Average Value
Number
Average Value
Number
Average Value
LOANS ORIGINATED
30
$94,070
15
$119,047
113
$126,855
6
$44,118
27
$89,992
14
$49,019
APPLICATIONS APPROVED, NOT ACCEPTED
1
$160,990
0
$0
11
$93,652
1
$8,870
1
$69,480
1
$66,520
APPLICATIONS DENIED
8
$100,189
4
$93,145
80
$122,225
10
$32,240
4
$118,825
11
$67,685
APPLICATIONS WITHDRAWN
4
$115,140
4
$99,240
36
$134,390
1
$198,940
1
$95,920
0
$0
FILES CLOSED FOR INCOMPLETENESS
2
$100,615
1
$157,190
9
$115,067
0
$0
0
$0
1
$70,540
Aggregated Statistics For Year 2008 (Based on 4 partial tracts)
A) FHA, FSA/RHS & VA Home Purchase Loans
B) Conventional Home Purchase Loans
C) Refinancings
D) Home Improvement Loans
E) Loans on Dwellings For 5+ Families
F) Non-occupant Loans on < 5 Family Dwellings (A B C & D)
G) Loans On Manufactured Home Dwelling (A B C & D)
Number
Average Value
Number
Average Value
Number
Average Value
Number
Average Value
Number
Average Value
Number
Average Value
Number
Average Value
LOANS ORIGINATED
26
$117,478
41
$131,323
142
$133,733
12
$28,380
0
$0
37
$105,322
22
$71,045
APPLICATIONS APPROVED, NOT ACCEPTED
1
$48,380
6
$95,262
14
$115,186
2
$102,160
0
$0
1
$142,650
6
$78,637
APPLICATIONS DENIED
11
$100,462
11
$153,863
106
$132,504
19
$38,287
1
$85,740
8
$134,676
13
$94,072
APPLICATIONS WITHDRAWN
4
$133,418
1
$203,960
47
$132,870
2
$149,345
0
$0
4
$122,695
4
$73,202
FILES CLOSED FOR INCOMPLETENESS
2
$115,130
1
$111,590
13
$166,765
0
$0
0
$0
0
$0
0
$0
Aggregated Statistics For Year 2007 (Based on 4 partial tracts)
A) FHA, FSA/RHS & VA Home Purchase Loans
B) Conventional Home Purchase Loans
C) Refinancings
D) Home Improvement Loans
F) Non-occupant Loans on < 5 Family Dwellings (A B C & D)
G) Loans On Manufactured Home Dwelling (A B C & D)
Number
Average Value
Number
Average Value
Number
Average Value
Number
Average Value
Number
Average Value
Number
Average Value
LOANS ORIGINATED
21
$107,635
107
$137,138
157
$115,928
21
$57,244
41
$111,864
27
$81,618
APPLICATIONS APPROVED, NOT ACCEPTED
0
$0
11
$182,355
37
$115,964
7
$58,870
5
$109,936
3
$45,040
APPLICATIONS DENIED
3
$131,893
32
$111,104
176
$121,381
27
$50,999
13
$94,838
11
$79,413
APPLICATIONS WITHDRAWN
2
$138,325
14
$134,771
59
$127,810
4
$71,835
2
$137,265
1
$76,140
FILES CLOSED FOR INCOMPLETENESS
0
$0
5
$166,418
22
$136,634
0
$0
2
$187,730
1
$69,700
Aggregated Statistics For Year 2006 (Based on 4 partial tracts)
A) FHA, FSA/RHS & VA Home Purchase Loans
B) Conventional Home Purchase Loans
C) Refinancings
D) Home Improvement Loans
F) Non-occupant Loans on < 5 Family Dwellings (A B C & D)
G) Loans On Manufactured Home Dwelling (A B C & D)
Number
Average Value
Number
Average Value
Number
Average Value
Number
Average Value
Number
Average Value
Number
Average Value
LOANS ORIGINATED
29
$121,705
175
$106,685
193
$108,751
23
$46,930
55
$108,390
29
$66,615
APPLICATIONS APPROVED, NOT ACCEPTED
2
$95,075
19
$89,298
33
$100,289
4
$21,762
3
$130,383
4
$75,835
APPLICATIONS DENIED
3
$125,100
50
$106,897
157
$121,777
36
$43,428
16
$88,344
15
$67,945
APPLICATIONS WITHDRAWN
2
$125,240
15
$101,459
85
$122,223
3
$77,433
3
$68,847
4
$80,025
FILES CLOSED FOR INCOMPLETENESS
0
$0
6
$103,710
31
$114,365
0
$0
3
$107,607
0
$0
Aggregated Statistics For Year 2005 (Based on 4 partial tracts)
A) FHA, FSA/RHS & VA Home Purchase Loans
B) Conventional Home Purchase Loans
C) Refinancings
D) Home Improvement Loans
F) Non-occupant Loans on < 5 Family Dwellings (A B C & D)
G) Loans On Manufactured Home Dwelling (A B C & D)
Number
Average Value
Number
Average Value
Number
Average Value
Number
Average Value
Number
Average Value
Number
Average Value
LOANS ORIGINATED
40
$116,964
175
$96,882
215
$103,583
20
$50,736
48
$94,923
26
$62,343
APPLICATIONS APPROVED, NOT ACCEPTED
1
$164,490
14
$102,706
37
$100,674
4
$28,425
3
$64,713
6
$66,892
APPLICATIONS DENIED
3
$131,010
37
$83,938
190
$109,736
28
$48,466
8
$110,039
18
$72,033
APPLICATIONS WITHDRAWN
5
$118,396
22
$111,826
114
$118,389
10
$108,244
6
$168,675
5
$97,864
FILES CLOSED FOR INCOMPLETENESS
0
$0
9
$90,560
41
$113,106
1
$202,160
1
$139,720
1
$65,890
Aggregated Statistics For Year 2004 (Based on 4 partial tracts)
A) FHA, FSA/RHS & VA Home Purchase Loans
B) Conventional Home Purchase Loans
C) Refinancings
D) Home Improvement Loans
E) Loans on Dwellings For 5+ Families
F) Non-occupant Loans on < 5 Family Dwellings (A B C & D)
G) Loans On Manufactured Home Dwelling (A B C & D)
Detailed PMIC statistics for the following Tracts:0001.00
, 0007.00
2002 - 2018 National Fire Incident Reporting System (NFIRS) incidents
Based on the data from the years 2002 - 2018 the average number of fires per year is 13. The highest number of reported fire incidents - 27 took place in 2016, and the least - 3 in 2004. The data has a dropping trend.
When looking into fire subcategories, the most reports belonged to: Outside Fires (49.1%), and Structure Fires (28.6%).
Fire incident types reported to NFIRS in Zip Code 30543

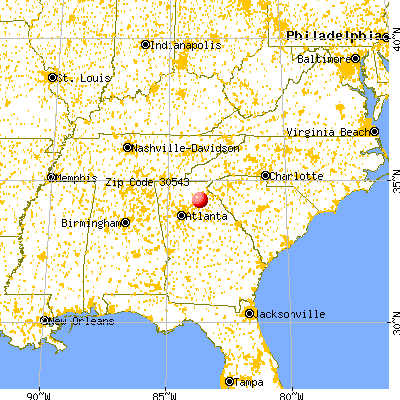


 Nearest zip codes: 30558, 30575, 30554, 30567, 30507, 30501.


 Based on the data from the years 2002 - 2018 the average number of fires per year is 13. The highest number of reported fire incidents - 27 took place in 2016, and the least - 3 in 2004. The data has a dropping trend.
 When looking into fire subcategories, the most reports belonged to: Outside Fires (49.1%), and Structure Fires (28.6%).