Estimated zip code population in 2022: 8,863 Zip code population in 2010: 8,535 Zip code population in 2000: 5,875
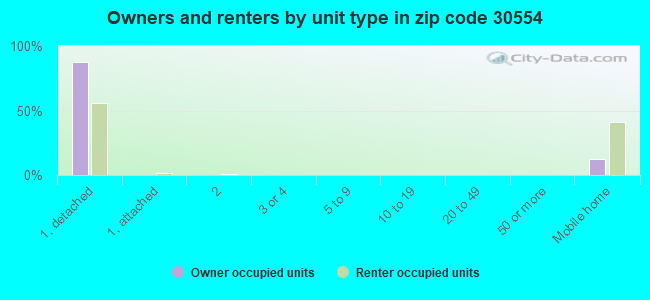
Houses and condos: 3,462 Renter-occupied apartments: 790
% of renters here:
24%
State:
34%
March 2022 cost of living index in zip code 30554: 81.8 (low, U.S. average is 100)
Land area: 72.9 sq. mi. Water area: 1.1 sq. mi.
Population density: 121 people per square mile
(very low).
OSM Map
General Map
Google Map
MSN Map
OSM Map
General Map
Google Map
MSN Map
OSM Map
General Map
Google Map
MSN Map
OSM Map
General Map
Google Map
MSN Map
Please wait while loading the map...
Real estate property taxes paid for housing units in 2022:
This zip code:
0.6% ($1,519)
Georgia:
0.7% ($2,160)
Median real estate property taxes paid for housing units with mortgages in 2022: $1,844 (0.6%) Median real estate property taxes paid for housing units with no mortgage in 2022: $980 (0.4%)
Business Search- 14 Million verified businesses
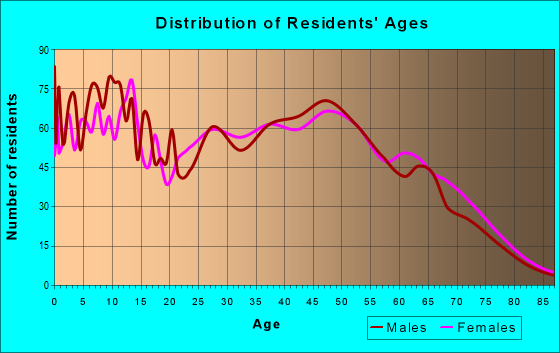
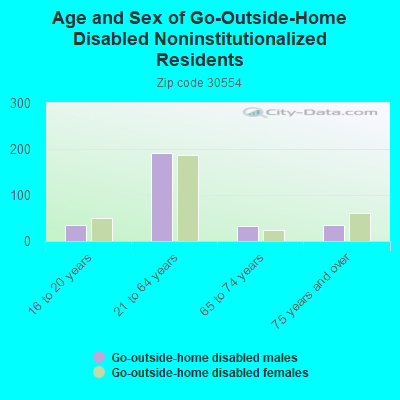
Males: 4,279
(48.3%)
Females: 4,584
(51.7%)
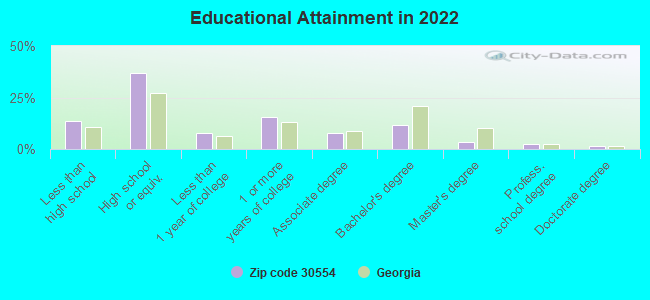
For population 25 years and over in 30554:
High school or higher: 85.4%
Bachelor's degree or higher: 18.4%
Graduate or professional degree: 6.8%
Unemployed: 2.9%
Mean travel time to work (commute): 29.5 minutes
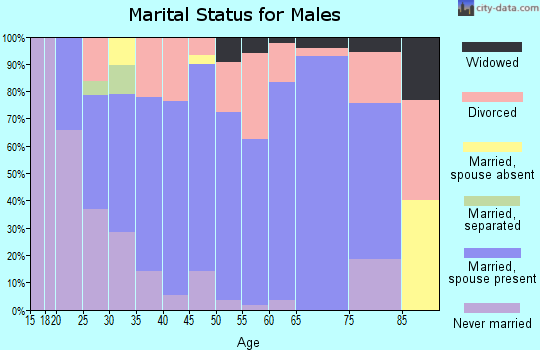
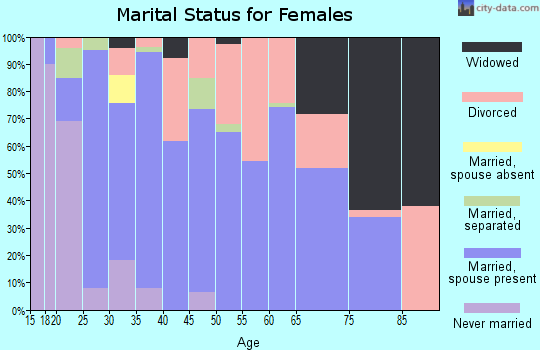
For population 15 years and over in 30554:
Never married: 24.6%
Now married: 53.0%
Separated: 0.5%
Widowed: 7.6%
Divorced: 14.2%
Zip code 30554 compared to state average:
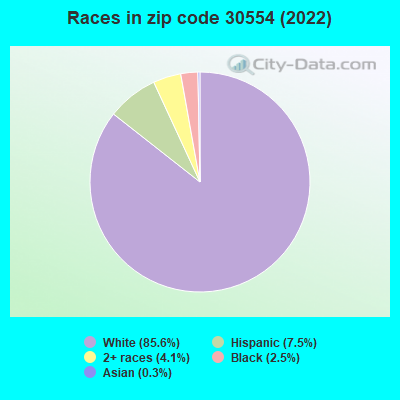
Black race population percentage significantly below state average.
Median age above state average.
Foreign-born population percentage below state average.
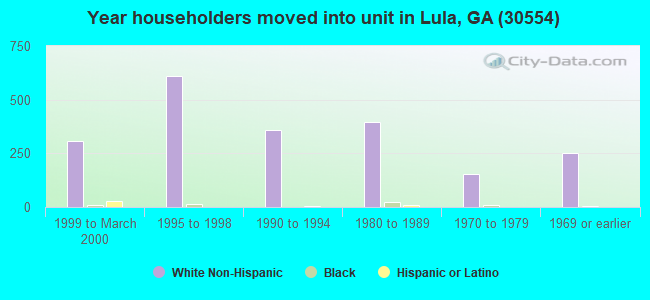
Length of stay since moving in significantly above state average.
Percentage of population with a bachelor's degree or higher below state average.
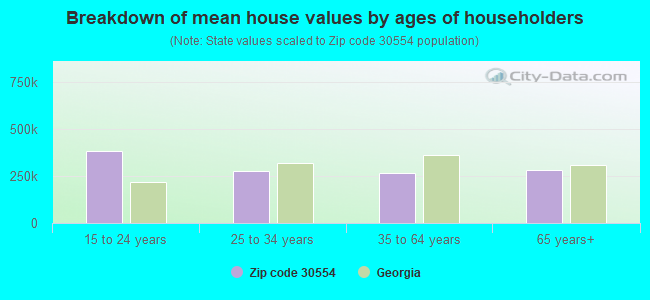
Estimated median house/condo value in 2022: $266,680
30554:
$266,680
Georgia:
$297,400
According to our research of Georgia and other state lists, there were 18 registered sex offenders living in 30554 zip code as of May 28, 2024. The ratio of all residents to sex offenders in zip code 30554 is 432 to 1. The ratio of registered sex offenders to all residents in this zip code is near the state average.
Median resident age:
This zip code:
41.8 years
Georgia median age:
37.6 years
Average household size:
This zip code:
2.7 people
Georgia:
2.6 people
Averages for the 2020 tax year for zip code 30554, filed in 2021:
Average Adjusted Gross Income (AGI) in 2020: $56,246 (Individual Income Tax Returns)
Here:
$56,246
State:
$70,847
Salary/wage: $49,700 (reported on 84.8% of returns)
Here:
$49,700
State:
$59,126
(% of AGI for various income ranges: 1107.2% for AGIs below $25k, 3736.8% for AGIs $25k-50k, 6993.6% for AGIs $50k-75k, 10016.3% for AGIs $75k-100k, 19101.4% for AGIs $100k-200k, 54743.3% for AGIs over 200k)
Taxable interest for individuals: $1,280 (reported on 18.1% of returns)
This zip code:
$1,280
Georgia:
$2,011
(% of AGI for various income ranges: 7.8% for AGIs below $25k, 9.4% for AGIs $25k-50k, 29.1% for AGIs $50k-75k, 24.8% for AGIs $75k-100k, 135.5% for AGIs $100k-200k, 760.0% for AGIs over 200k)
Ordinary dividends: $4,770 (reported on 8.7% of returns)
Here:
$4,770
State:
$8,996
(% of AGI for various income ranges: 10.4% for AGIs below $25k, 16.5% for AGIs $25k-50k, 17.9% for AGIs $50k-75k, 26.3% for AGIs $75k-100k, 153.6% for AGIs $100k-200k, 2810.0% for AGIs over 200k)
Net capital gain/loss in AGI: +$16,950 (reported on 8.4% of returns)
Here:
+$16,950
State:
+$28,402
(% of AGI for various income ranges: 3.9% for AGIs below $25k, 12.6% for AGIs $25k-50k, 59.1% for AGIs $50k-75k, 163.0% for AGIs $75k-100k, 339.1% for AGIs $100k-200k, 12720.0% for AGIs over 200k)
Profit/loss from business: +$9,306 (reported on 17.8% of returns)
Here:
+$9,306
State:
+$6,707
(% of AGI for various income ranges: 175.1% for AGIs below $25k, 155.9% for AGIs $25k-50k, 162.1% for AGIs $50k-75k, 187.0% for AGIs $75k-100k, 621.8% for AGIs $100k-200k, 2406.7% for AGIs over 200k)
Taxable individual retirement arrangement distribution: $13,260 (reported on 5.2% of returns)
30554:
$13,260
Georgia:
$20,525
(% of AGI for various income ranges: 50.2% for AGIs below $25k, 62.5% for AGIs $25k-50k, 82.3% for AGIs $50k-75k, 131.1% for AGIs $75k-100k, 412.7% for AGIs $100k-200k)
Total itemized deductions: $32,696 (reported on 6.3% of returns)
Here:
$32,696
State:
$34,001
(% of AGI for various income ranges: 100.1% for AGIs $25k-50k, 230.9% for AGIs $50k-75k, 391.5% for AGIs $75k-100k, 1108.6% for AGIs $100k-200k, 8050.0% for AGIs over 200k)
Charity contributions: $13,158 (reported on 5.0% of returns)
Here:
$13,158
State:
$14,164
(% of AGI for various income ranges: 21.4% for AGIs $25k-50k, 52.1% for AGIs $50k-75k, 106.3% for AGIs $75k-100k, 424.1% for AGIs $100k-200k, 2843.3% for AGIs over 200k)
Taxes paid: $6,650 (reported on 6.3% of returns)
30554:
$6,650
State:
$7,540
(% of AGI for various income ranges: 14.2% for AGIs $25k-50k, 44.0% for AGIs $50k-75k, 96.7% for AGIs $75k-100k, 284.5% for AGIs $100k-200k, 1270.0% for AGIs over 200k)
Earned income credit: $2,375 (reported on 18.9% of returns)
Here:
$2,375
State:
$2,530
(% of AGI for various income ranges: 108.0% for AGIs below $25k, 81.8% for AGIs $25k-50k)
Percentage of individuals using paid preparers for their 2020 taxes: 95.5%
Here:
96%
State:
93%
(% for various income ranges: 95.1% for AGIs below $25k, 95.3% for AGIs $25k-50k, 95.3% for AGIs $50k-75k, 97.4% for AGIs $75k-100k, 95.2% for AGIs $100k-200k, 100.0% for AGIs over 200k)
Averages for the 2012 tax year for zip code 30554, filed in 2013:
Average Adjusted Gross Income (AGI) in 2012: $43,190 (Individual Income Tax Returns)
Here:
$43,190
State:
$56,131
Salary/wage: $39,215 (reported on 86.6% of returns)
Here:
$39,215
State:
$47,942
(% of AGI for various income ranges: 74.4% for AGIs below $25k, 85.0% for AGIs $25k-50k, 84.3% for AGIs $50k-75k, 80.8% for AGIs $75k-100k, 87.2% for AGIs $100k-200k)
Taxable interest for individuals: $959 (reported on 20.6% of returns)
This zip code:
$959
Georgia:
$1,706
(% of AGI for various income ranges: 0.9% for AGIs below $25k, 0.3% for AGIs $25k-50k, 0.3% for AGIs $50k-75k, 0.5% for AGIs $75k-100k, 0.6% for AGIs $100k-200k)
Ordinary dividends: $2,107 (reported on 8.8% of returns)
Here:
$2,107
State:
$7,265
(% of AGI for various income ranges: 0.7% for AGIs below $25k, 0.4% for AGIs $50k-75k, 0.3% for AGIs $75k-100k, 1.0% for AGIs $100k-200k)
Net capital gain/loss in AGI: +$3,076 (reported on 5.6% of returns)
Here:
+$3,076
State:
+$16,323
(% of AGI for various income ranges: 0.3% for AGIs below $25k, 0.2% for AGIs $25k-50k, 1.7% for AGIs $100k-200k)
Profit/loss from business: +$6,126 (reported on 17.6% of returns)
Here:
+$6,126
State:
+$7,583
(% of AGI for various income ranges: 10.7% for AGIs below $25k, 2.5% for AGIs $25k-50k, 1.2% for AGIs $50k-75k, 0.5% for AGIs $75k-100k, 1.5% for AGIs $100k-200k)
Taxable individual retirement arrangement distribution: $13,024 (reported on 5.6% of returns)
30554:
$13,024
Georgia:
$17,199
(% of AGI for various income ranges: 2.2% for AGIs below $25k, 1.5% for AGIs $25k-50k, 2.8% for AGIs $50k-75k, 2.2% for AGIs $100k-200k)
Total itemized deductions: $18,789 (25% of AGI, reported on 31.7% of returns)
Here:
$18,789
State:
$23,886
Here:
25.5% of AGI
State:
21.5% of AGI
(% of AGI for various income ranges: 8.8% for AGIs below $25k, 10.4% for AGIs $25k-50k, 14.9% for AGIs $50k-75k, 14.5% for AGIs $75k-100k, 17.9% for AGIs $100k-200k, 18.7% for AGIs over 200k)
Charity contributions: $4,019 (reported on 24.2% of returns)
Here:
$4,019
State:
$5,507
(% of AGI for various income ranges: 0.7% for AGIs below $25k, 1.4% for AGIs $25k-50k, 2.1% for AGIs $50k-75k, 2.8% for AGIs $75k-100k, 4.8% for AGIs $100k-200k)
Taxes paid: $5,211 (reported on 31.4% of returns)
30554:
$5,211
State:
$7,838
(% of AGI for various income ranges: 1.1% for AGIs below $25k, 2.2% for AGIs $25k-50k, 4.0% for AGIs $50k-75k, 4.6% for AGIs $75k-100k, 5.9% for AGIs $100k-200k, 6.0% for AGIs over 200k)
Earned income credit: $2,450 (reported on 25.5% of returns)
Here:
$2,450
State:
$2,589
(% of AGI for various income ranges: 9.1% for AGIs below $25k, 1.5% for AGIs $25k-50k)
Percentage of individuals using paid preparers for their 2012 taxes: 60.1%
Here:
60%
State:
55%
(% for various income ranges: 58.9% for AGIs below $25k, 60.5% for AGIs $25k-50k, 59.2% for AGIs $50k-75k, 59.3% for AGIs $75k-100k, 77.8% for AGIs $100k-200k)
Averages for the 2004 tax year for zip code 30554, filed in 2005:
Average Adjusted Gross Income (AGI) in 2004: $38,071 (Individual Income Tax Returns)
Here:
$38,071
State:
$47,553
Salary/wage: $35,381 (reported on 88.5% of returns)
Here:
$35,381
State:
$42,178
(% of AGI for various income ranges: 134.5% for AGIs below $10k, 78.4% for AGIs $10k-25k, 86.8% for AGIs $25k-50k, 86.7% for AGIs $50k-75k, 87.0% for AGIs $75k-100k, 57.4% for AGIs over 100k)
Taxable interest for individuals: $1,005 (reported on 30.8% of returns)
This zip code:
$1,005
Georgia:
$1,772
(% of AGI for various income ranges: 5.4% for AGIs below $10k, 1.7% for AGIs $10k-25k, 0.9% for AGIs $25k-50k, 0.5% for AGIs $50k-75k, 0.3% for AGIs $75k-100k, 0.6% for AGIs over 100k)
Taxable dividends: $898 (reported on 11.0% of returns)
Here:
$898
State:
$4,283
(% of AGI for various income ranges: 2.3% for AGIs below $10k, 0.6% for AGIs $10k-25k, 0.1% for AGIs $25k-50k, 0.2% for AGIs $50k-75k, 0.1% for AGIs $75k-100k, 0.6% for AGIs over 100k)
Net capital gain/loss: +$5,438 (reported on 7.6% of returns)
Here:
+$5,438
State:
+$16,461
(% of AGI for various income ranges: -1.4% for AGIs below $10k, 0.4% for AGIs $10k-25k, 0.8% for AGIs $25k-50k, 0.7% for AGIs $50k-75k, 0.4% for AGIs $75k-100k, 4.0% for AGIs over 100k)
Profit/loss from business: +$6,715 (reported on 17.4% of returns)
Here:
+$6,715
State:
+$8,201
(% of AGI for various income ranges: 10.6% for AGIs below $10k, 6.8% for AGIs $10k-25k, 4.0% for AGIs $25k-50k, 1.4% for AGIs $50k-75k, 3.1% for AGIs $75k-100k, 0.6% for AGIs over 100k)
Profit/loss from farming: +$61 (reported on 4.8% of returns)
Here:
+$61
State:
-$6,357
(% of AGI for various income ranges: -18.1% for AGIs below $10k, -0.7% for AGIs $10k-25k, 0.9% for AGIs $25k-50k, 0.4% for AGIs $50k-75k, -0.6% for AGIs $75k-100k, 0.5% for AGIs over 100k)
IRA payment deduction: $2,811 (reported on 1.3% of returns)
30554:
$2,811
Georgia:
$2,969
Total itemized deductions: $15,264 (24% of AGI, reported on 34.7% of returns)
Here:
$15,264
State:
$19,944
Here:
24.4% of AGI
State:
22.6% of AGI
(% of AGI for various income ranges: 11.4% for AGIs below $10k, 7.5% for AGIs $10k-25k, 13.2% for AGIs $25k-50k, 15.0% for AGIs $50k-75k, 15.6% for AGIs $75k-100k, 16.7% for AGIs over 100k)
Charity contributions deductions: $3,152 (5% of AGI, reported on 29.1% of returns)
Here:
$3,152
State:
$4,354
Here:
4.9% of AGI
State:
4.7% of AGI
(% of AGI for various income ranges: 0.9% for AGIs below $10k, 0.8% for AGIs $10k-25k, 2.0% for AGIs $25k-50k, 2.5% for AGIs $50k-75k, 2.7% for AGIs $75k-100k, 4.2% for AGIs over 100k)
Total tax: $4,432 (reported on 75.2% of returns)
30554:
$4,432
State:
$8,223
(% of AGI for various income ranges: 4.0% for AGIs below $10k, 4.3% for AGIs $10k-25k, 6.5% for AGIs $25k-50k, 7.9% for AGIs $50k-75k, 10.1% for AGIs $75k-100k, 17.2% for AGIs over 100k)
Earned income credit: $1,783 (reported on 19.2% of returns)
Here:
$1,783
State:
$1,986
Percentage of individuals using paid preparers for their 2004 taxes: 69.0%
Here:
69%
State:
62%
(% for various income ranges: 60.3% for AGIs below $10k, 73.5% for AGIs $10k-25k, 70.1% for AGIs $25k-50k, 70.9% for AGIs $50k-75k, 65.7% for AGIs $75k-100k, 69.2% for AGIs over 100k)
Likely homosexual households (counted as self-reported same-sex unmarried-partner households)
Lesbian couples: 0.1% of all households
Gay men: 0.0% of all households
Household received Food Stamps/SNAP in the past 12 months: 346 Household did not receive Food Stamps/SNAP in the past 12 months: 2,886
Women who had a birth in the past 12 months: 68 (68 now married, 0 unmarried) Women who did not have a birth in the past 12 months: 1,925 (904 now married, 1,019 unmarried)
Housing units in zip code 30554 with a mortgage: 1,213 (96 second mortgage, 88 both second mortgage and home equity loan) Houses without a mortgage: 74
Median monthly owner costs for units with a mortgage: $1,289 Median monthly owner costs for units without a mortgage: $395
Residents with income below the poverty level in 2022:
This zip code:
8.2%
Whole state:
12.7%
Residents with income below 50% of the poverty level in 2022:
This zip code:
3.7%
Whole state:
6.3%
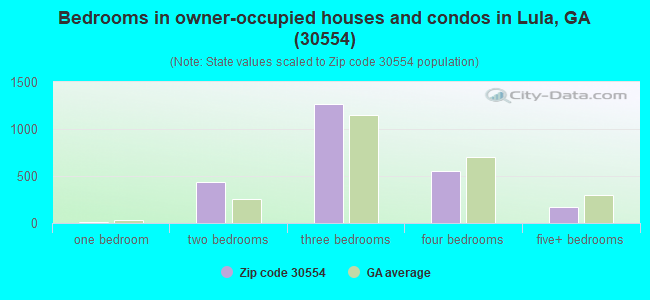
Median number of rooms in houses and condos:
Here:
6.6
State:
6.8
Median number of rooms in apartments:
Here:
5.4
State:
4.6
Notable locations in this zip code not listed on our city pages
Notable locations in zip code 30554: Silver Shoal (A), Heads Mill (B), Rock Springs Fire Department (C), Hall County Fire Services Station 6 (D), Satterfield Store (E). Display/hide their locations on the map
Churches in zip code 30554 include: Antioch Church (A), Bellton Church (B), Bethlehem Church (C), Liberty Baptist Church (D), Mount Sinai Church (E), First Baptist Church (F), Living Mission Church (G), Rock Springs Church (H), Grove Creek Church (I). Display/hide their locations on the map
Cemeteries: Hickory Flat Cemetery (1), Silver Shoal Cemetery (2), Clemons Chapel Cemetery (3), Holly Springs Cemetery (4), Living Mission Cemetery (5), Skitts Mountain Cemetery (6), Whitehall Cemetery (7). Display/hide their locations on the map
Size of family households: 1,028 2-persons, 509 3-persons, 551 4-persons, 186 5-persons, 87 6-persons, 58 7-or-more-persons
Size of nonfamily households: 693 1-person, 100 2-persons, 22 3-persons
1,063 married couples with children.
325 single-parent households (113 men, 212 women).
92.9% of residents of 30554 zip code speak English at home.
5.9% of residents speak Spanish at home (63% very well, 21% well, 9% not well, 7% not at all).
0.4% of residents speak other Indo-European language at home (100% very well).
0.5% of residents speak Asian or Pacific Island language at home (100% very well).
Foreign born population: 428 (4.8%) (41.7% of them are naturalized citizens)
This zip code:
4.8%
Whole state:
10.7%
61%Honduras
9%Bolivia
8%Sweden
8%United Kingdom, excluding England and Scotland
5%Malaysia
2%Belgium
2%Hong Kong
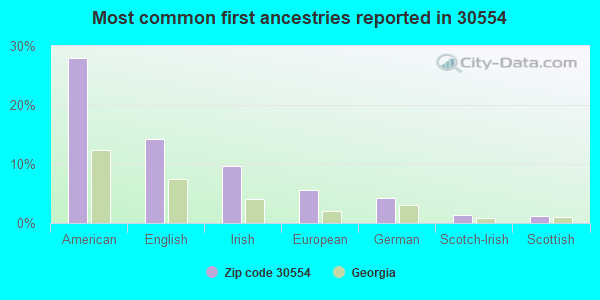
28%American
14%English
10%Irish
6%European
4%German
1%Scotch-Irish
1%Scottish
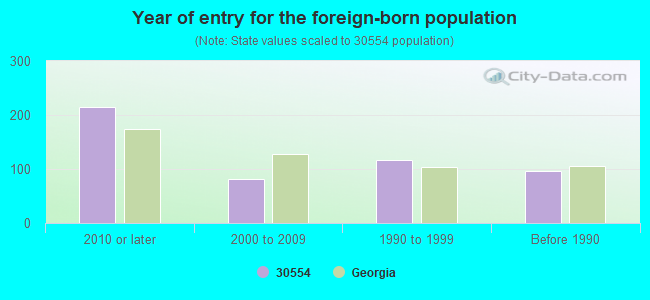
Year of entry for the foreign-born population
2152010 or later
822000 to 2009
1171990 to 1999
96Before 1990
Facilities with environmental interests located in this zip code:
CIRCLE K #2305 (HWY 365 in LULA, GA)
STATE MASTER (Georgia's Geographic Environmental Information) - UST-1, UNDERGROUND STORAGE TANK PROGRAM, UST-4, UST-2, UST-3, Conditionally Exempt Small Quantity Generators, less than 100 kg/month of hazardous waste (Resource Conservation and Recovery Act (tracking hazardous waste)) - notification Organizations: DELTA ENVIRONMENTAL CONSULTANTS INC (CONTACT/AGENT)
, CIRCLE K STORES INC (CONTACT/OPERATOR)
, LARRY HOLCOMB (CONTACT/OWNER)
, ATLANTA PETROLEUM EQ (INSTALLER)
LULA ELEMENTARY SCHOOL (6130 CHATTAHOOCHEE STREET in LULA, GA)
(National Center for Education Statistics) - STATE ID-4054 Organizations: HALL COUNTY (SCHOOL DISTRICT)
National Pollutant Discharge Elimination System NON-MAJOR (Tracking pollutant discharge elimination systems) - permit Business SIC classification: SEWERAGE SYSTEMS Organizations: CITY OF LULA (CONTACT/OWNER)
Alternative names: CITY OF LULA, LULA POND, LULA WPCP
Housing units lacking complete plumbing facilities: 5.1% Housing units lacking complete kitchen facilities: 4.7%
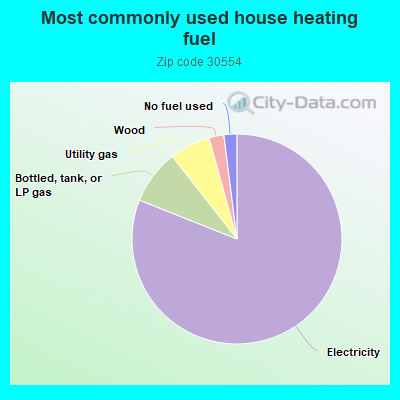
81.2%Electricity
8.4%Bottled, tank, or LP gas
6.3%Utility gas
2.3%Wood
2.0%No fuel used
Population in 1990: 3,365. Population change in the 1990s: +2,510 (+74.6%).
Place of birth for U.S.-born residents:
This state: 6,576
Northeast: 282
Midwest: 418
South: 905
West: 111
62% of the 30554 zip code residents lived in the same house 5 years ago. Out of people who lived in different houses, 53% lived in this county. Out of people who lived in different counties, 50% lived in Georgia.
93% of the 30554 zip code residents lived in the same house 1 year ago. Out of people who lived in different houses, 41% moved from this county. Out of people who lived in different houses, 41% moved from different county within same state. Out of people who lived in different houses, 19% moved from different state.
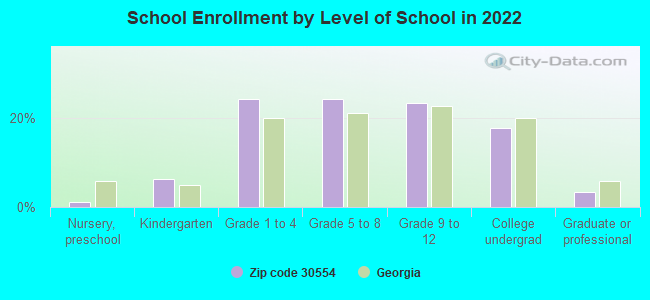
Private vs. public school enrollment:
Students in private schools in grades 1 to 8 (elementary and middle school): 27
Here:
3.0%
Georgia:
12.1%
Students in private schools in grades 9 to 12 (high school): 34
Here:
7.7%
Georgia:
10.8%
Students in private undergraduate colleges: 16
Here:
4.9%
Georgia:
17.1%
Occupation by median earnings in the past 12 months ($)
108,193Health diagnosing and treating practitioners and other technical occupations
86,398Legal occupations
80,589Management occupations
77,037Business and financial operations occupations
71,063Farming, fishing, and forestry occupations
64,140Construction and extraction occupations
Top industries in this zip code by the number of employees in 2005:
Detailed PMIC statistics for the following Tracts:0001.00
, 0002.01
2002 - 2018 National Fire Incident Reporting System (NFIRS) incidents
Based on the data from the years 2002 - 2018 the average number of fire incidents per year is 30. The highest number of reported fire incidents - 62 took place in 2007, and the least - 13 in 2013. The data has a dropping trend.
When looking into fire subcategories, the most incidents belonged to: Outside Fires (40.3%), and Structure Fires (33.0%).
Fire incident types reported to NFIRS in Zip Code 30554


+$61
-$6,357
(% of AGI for various income ranges: -18.1% for AGIs below $10k, -0.7% for AGIs $10k-25k, 0.9% for AGIs $25k-50k, 0.4% for AGIs $50k-75k, -0.6% for AGIs $75k-100k, 0.5% for AGIs over 100k)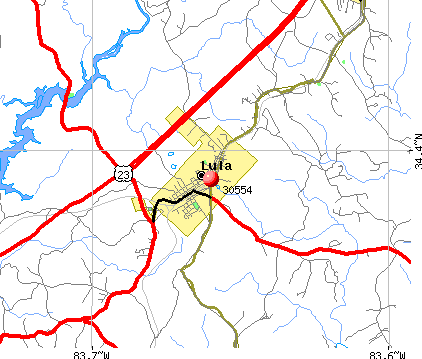 Nearest zip codes: 30510, 30543, 30531, 30527, 30558, 30501.
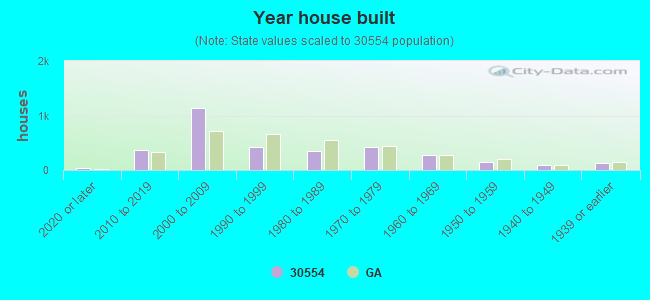


 Based on the data from the years 2002 - 2018 the average number of fire incidents per year is 30. The highest number of reported fire incidents - 62 took place in 2007, and the least - 13 in 2013. The data has a dropping trend.
 When looking into fire subcategories, the most incidents belonged to: Outside Fires (40.3%), and Structure Fires (33.0%).