Estimated zip code population in 2022: 3,634 Zip code population in 2010: 3,569 Zip code population in 2000: 3,541
Houses and condos: 1,556 Renter-occupied apartments: 352
% of renters here:
24%
State:
34%
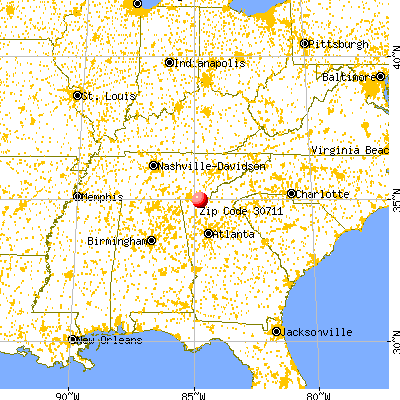
March 2022 cost of living index in zip code 30711: 79.0 (low, U.S. average is 100)
Land area: 69.5 sq. mi. Water area: 0.1 sq. mi.
Population density: 52 people per square mile
(very low).
OSM Map
General Map
Google Map
MSN Map
OSM Map
General Map
Google Map
MSN Map
OSM Map
General Map
Google Map
MSN Map
OSM Map
General Map
Google Map
MSN Map
Please wait while loading the map...
Real estate property taxes paid for housing units in 2022:
This zip code:
0.5% ($750)
Georgia:
0.7% ($2,160)
Median real estate property taxes paid for housing units with mortgages in 2022: $944 (0.5%) Median real estate property taxes paid for housing units with no mortgage in 2022: $527 (0.4%)
Averages for the 2020 tax year for zip code 30711, filed in 2021:
Average Adjusted Gross Income (AGI) in 2020: $47,132 (Individual Income Tax Returns)
Here:
$47,132
State:
$70,847
Salary/wage: $41,050 (reported on 87.4% of returns)
Here:
$41,050
State:
$59,126
(% of AGI for various income ranges: 1218.9% for AGIs below $25k, 3665.8% for AGIs $25k-50k, 6567.1% for AGIs $50k-75k, 9735.0% for AGIs $75k-100k, 19712.9% for AGIs $100k-200k)
Taxable interest for individuals: $1,013 (reported on 16.1% of returns)
This zip code:
$1,013
Georgia:
$2,011
(% of AGI for various income ranges: 8.7% for AGIs below $25k, 5.5% for AGIs $25k-50k, 34.7% for AGIs $50k-75k, 11.2% for AGIs $75k-100k, 158.6% for AGIs $100k-200k)
Ordinary dividends: $1,217 (reported on 4.2% of returns)
Here:
$1,217
State:
$8,996
(% of AGI for various income ranges: 13.4% for AGIs $25k-50k, 31.4% for AGIs $100k-200k)
Net capital gain/loss in AGI: +$13,044 (reported on 6.3% of returns)
Here:
+$13,044
State:
+$28,402
(% of AGI for various income ranges: 5.8% for AGIs below $25k, 10.0% for AGIs $50k-75k, 1621.4% for AGIs $100k-200k)
Profit/loss from business: +$6,948 (reported on 14.7% of returns)
Here:
+$6,948
State:
+$6,707
(% of AGI for various income ranges: 168.2% for AGIs below $25k, 96.1% for AGIs $25k-50k, 137.6% for AGIs $50k-75k, 315.7% for AGIs $100k-200k)
Taxable individual retirement arrangement distribution: $8,712 (reported on 5.6% of returns)
30711:
$8,712
Georgia:
$20,525
(% of AGI for various income ranges: 95.5% for AGIs below $25k, 196.5% for AGIs $50k-75k)
Total itemized deductions: $26,400 (reported on 3.5% of returns)
Here:
$26,400
State:
$34,001
(% of AGI for various income ranges: 169.5% for AGIs $25k-50k, 965.7% for AGIs $100k-200k)
Charity contributions: $7,300 (reported on 2.8% of returns)
Here:
$7,300
State:
$14,164
(% of AGI for various income ranges: 417.1% for AGIs $100k-200k)
Taxes paid: $5,620 (reported on 3.5% of returns)
30711:
$5,620
State:
$7,540
(% of AGI for various income ranges: 25.8% for AGIs $25k-50k, 261.4% for AGIs $100k-200k)
Earned income credit: $2,224 (reported on 23.1% of returns)
Here:
$2,224
State:
$2,530
(% of AGI for various income ranges: 109.5% for AGIs below $25k, 83.7% for AGIs $25k-50k)
Percentage of individuals using paid preparers for their 2020 taxes: 96.5%
Here:
97%
State:
93%
(% for various income ranges: 96.0% for AGIs below $25k, 95.7% for AGIs $25k-50k, 95.5% for AGIs $50k-75k, 100.0% for AGIs $75k-100k, 100.0% for AGIs $100k-200k)
Averages for the 2012 tax year for zip code 30711, filed in 2013:
Average Adjusted Gross Income (AGI) in 2012: $36,138 (Individual Income Tax Returns)
Here:
$36,138
State:
$56,131
Salary/wage: $33,882 (reported on 87.0% of returns)
Here:
$33,882
State:
$47,942
(% of AGI for various income ranges: 77.4% for AGIs below $25k, 88.9% for AGIs $25k-50k, 83.4% for AGIs $50k-75k, 81.5% for AGIs $75k-100k, 66.9% for AGIs $100k-200k)
Taxable interest for individuals: $1,223 (reported on 16.8% of returns)
This zip code:
$1,223
Georgia:
$1,706
(% of AGI for various income ranges: 0.8% for AGIs below $25k, 0.9% for AGIs $25k-50k, 0.5% for AGIs $50k-75k, 0.2% for AGIs $100k-200k)
Ordinary dividends: $660 (reported on 3.8% of returns)
Here:
$660
State:
$7,265
Net capital gain/loss in AGI: +$2,225 (reported on 3.1% of returns)
Here:
+$2,225
State:
+$16,323
Profit/loss from business: +$7,712 (reported on 12.2% of returns)
Here:
+$7,712
State:
+$7,583
(% of AGI for various income ranges: 11.3% for AGIs below $25k, 1.0% for AGIs $25k-50k, 1.8% for AGIs $50k-75k)
Taxable individual retirement arrangement distribution: $11,917 (reported on 4.6% of returns)
30711:
$11,917
Georgia:
$17,199
Total itemized deductions: $16,204 (24% of AGI, reported on 18.3% of returns)
Here:
$16,204
State:
$23,886
Here:
23.9% of AGI
State:
21.5% of AGI
(% of AGI for various income ranges: 7.3% for AGIs $25k-50k, 11.5% for AGIs $50k-75k, 10.2% for AGIs $75k-100k, 12.3% for AGIs $100k-200k)
Charity contributions: $3,693 (reported on 11.5% of returns)
Here:
$3,693
State:
$5,507
(% of AGI for various income ranges: 0.5% for AGIs $25k-50k, 1.9% for AGIs $50k-75k, 1.1% for AGIs $75k-100k, 2.8% for AGIs $100k-200k)
Taxes paid: $4,617 (reported on 17.6% of returns)
30711:
$4,617
State:
$7,838
(% of AGI for various income ranges: 1.3% for AGIs $25k-50k, 2.6% for AGIs $50k-75k, 3.7% for AGIs $75k-100k, 4.7% for AGIs $100k-200k)
Earned income credit: $2,464 (reported on 29.8% of returns)
Here:
$2,464
State:
$2,589
(% of AGI for various income ranges: 9.4% for AGIs below $25k, 1.5% for AGIs $25k-50k)
Percentage of individuals using paid preparers for their 2012 taxes: 58.8%
Here:
59%
State:
55%
(% for various income ranges: 56.9% for AGIs below $25k, 53.7% for AGIs $25k-50k, 72.2% for AGIs $50k-75k, 66.7% for AGIs $75k-100k, 60.0% for AGIs $100k-200k)
Averages for the 2004 tax year for zip code 30711, filed in 2005:
Average Adjusted Gross Income (AGI) in 2004: $32,201 (Individual Income Tax Returns)
Here:
$32,201
State:
$47,553
Salary/wage: $31,006 (reported on 89.3% of returns)
Here:
$31,006
State:
$42,178
(% of AGI for various income ranges: 158.0% for AGIs below $10k, 88.4% for AGIs $10k-25k, 90.7% for AGIs $25k-50k, 87.5% for AGIs $50k-75k, 90.3% for AGIs $75k-100k, 50.8% for AGIs over 100k)
Taxable interest for individuals: $1,249 (reported on 23.8% of returns)
This zip code:
$1,249
Georgia:
$1,772
(% of AGI for various income ranges: 3.9% for AGIs below $10k, 0.8% for AGIs $10k-25k, 0.6% for AGIs $25k-50k, 0.6% for AGIs $50k-75k, 0.1% for AGIs $75k-100k, 2.9% for AGIs over 100k)
Taxable dividends: $1,176 (reported on 4.8% of returns)
Here:
$1,176
State:
$4,283
(% of AGI for various income ranges: 0.1% for AGIs below $10k, 0.1% for AGIs $25k-50k, 0.2% for AGIs $50k-75k, 0.5% for AGIs over 100k)
Net capital gain/loss: +$24,507 (reported on 4.9% of returns)
Here:
+$24,507
State:
+$16,461
(% of AGI for various income ranges: -0.5% for AGIs below $10k, 0.4% for AGIs $25k-50k, 1.7% for AGIs $50k-75k, 27.9% for AGIs over 100k)
Profit/loss from business: +$6,979 (reported on 13.3% of returns)
Here:
+$6,979
State:
+$8,201
(% of AGI for various income ranges: 22.1% for AGIs below $10k, 6.0% for AGIs $10k-25k, 1.9% for AGIs $25k-50k, 3.2% for AGIs $50k-75k)
IRA payment deduction: $2,688 (reported on 1.1% of returns)
30711:
$2,688
Georgia:
$2,969
Total itemized deductions: $13,599 (22% of AGI, reported on 14.6% of returns)
Here:
$13,599
State:
$19,944
Here:
22.4% of AGI
State:
22.6% of AGI
(% of AGI for various income ranges: 2.5% for AGIs $10k-25k, 5.2% for AGIs $25k-50k, 8.2% for AGIs $50k-75k, 12.6% for AGIs $75k-100k, 5.5% for AGIs over 100k)
Charity contributions deductions: $2,467 (4% of AGI, reported on 10.6% of returns)
Here:
$2,467
State:
$4,354
Here:
3.7% of AGI
State:
4.7% of AGI
(% of AGI for various income ranges: 0.7% for AGIs $25k-50k, 1.1% for AGIs $50k-75k, 2.2% for AGIs $75k-100k, 0.7% for AGIs over 100k)
Total tax: $3,643 (reported on 69.4% of returns)
30711:
$3,643
State:
$8,223
(% of AGI for various income ranges: 6.7% for AGIs below $10k, 3.6% for AGIs $10k-25k, 6.2% for AGIs $25k-50k, 8.1% for AGIs $50k-75k, 9.8% for AGIs $75k-100k, 17.3% for AGIs over 100k)
Earned income credit: $1,764 (reported on 27.0% of returns)
Here:
$1,764
State:
$1,986
Percentage of individuals using paid preparers for their 2004 taxes: 69.3%
Here:
69%
State:
62%
(% for various income ranges: 63.6% for AGIs below $10k, 69.9% for AGIs $10k-25k, 70.2% for AGIs $25k-50k, 70.7% for AGIs $50k-75k, 75.0% for AGIs $75k-100k, 82.8% for AGIs over 100k)
Household received Food Stamps/SNAP in the past 12 months: 163 Household did not receive Food Stamps/SNAP in the past 12 months: 1,316
Women who had a birth in the past 12 months: 94 (32 now married, 61 unmarried) Women who did not have a birth in the past 12 months: 743 (424 now married, 317 unmarried)
Housing units in zip code 30711 with a mortgage: 555 (6 second mortgage, 6 both second mortgage and home equity loan) Median monthly owner costs for units with a mortgage: $1,023 Median monthly owner costs for units without a mortgage: $295
Residents with income below the poverty level in 2022:
This zip code:
16.0%
Whole state:
12.7%
Residents with income below 50% of the poverty level in 2022:
This zip code:
1.8%
Whole state:
6.3%
Median number of rooms in houses and condos:
Here:
6.0
State:
6.8
Median number of rooms in apartments:
Here:
5.6
State:
4.6
Notable locations in this zip code not listed on our city pages
Churches in zip code 30711 include: Conasauga Church (A), Mount Sumac Church (B), Fairy Valley Church (C), Cisco Baptist Church (D), North Mount Pleasant Church (E), Calvary Church (F), Summerour Church (G). Display/hide their locations on the map
Streams, rivers, and creeks: Thomas Creek (A), Sugar Creek (B), Rough Creek (C), North Prong Sumac Creek (D), Muddy Branch (E), McIntire Branch (F), Lawground Branch (G), Hickory Creek (H), Head Branch (I). Display/hide their locations on the map
485 married couples with children.
196 single-parent households (196 women).
94.2% of residents of 30711 zip code speak English at home.
4.7% of residents speak Spanish at home (100% very well).
0.7% of residents speak other Indo-European language at home (100% very well).
Foreign born population: 225 (6.2%) (24.8% of them are naturalized citizens)
This zip code:
6.2%
Whole state:
10.7%
67%Honduras
15%Philippines
60%English
17%Irish
10%American
3%German
3%Scottish
2%Scotch-Irish
1%Swedish
Year of entry for the foreign-born population
02010 or later
02000 to 2009
1531990 to 1999
59Before 1990
Housing units lacking complete plumbing facilities: 1.7% Housing units lacking complete kitchen facilities: 2.0%
86.5%Electricity
9.1%Bottled, tank, or LP gas
1.9%Wood
1.7%Other fuel
1.1%Fuel oil, kerosene, etc.
Population in 1990: 2,901. Population change in the 1990s: +640 (+22.1%).
Place of birth for U.S.-born residents:
This state: 2,512
Northeast: 77
Midwest: 55
South: 716
West: 20
61% of the 30711 zip code residents lived in the same house 5 years ago. Out of people who lived in different houses, 55% lived in this county. Out of people who lived in different counties, 50% lived in Georgia.
98% of the 30711 zip code residents lived in the same house 1 year ago. Out of people who lived in different houses, 76% moved from this county. Out of people who lived in different houses, 20% moved from different county within same state. Out of people who lived in different houses, 10% moved from different state.
Private vs. public school enrollment:
Students in private schools in grades 1 to 8 (elementary and middle school):
Here:
0.0%
Georgia:
12.1%
Students in private schools in grades 9 to 12 (high school):
Here:
0.0%
Georgia:
10.8%
Students in private undergraduate colleges:
Here:
0.0%
Georgia:
17.1%
Occupation by median earnings in the past 12 months ($)
75,258Management occupations
64,238Construction and extraction occupations
63,680Sales and related occupations
55,012Transportation occupations
53,080Installation, maintenance, and repair occupations
49,868Education, training, and library occupations
Top industries in this zip code by the number of employees in 2005:
Construction: Plumbing, Heating, and Air-Conditioning Contractors (5-9 employees: 1 establishment)
Professional, Scientific, and Technical Services: Computer Systems Design Services (1-4: 1)
Other Services (except Public Administration): Religious Organizations (1-4: 1)
Administrative and Support and Waste Management and Remediation Services: Landscaping Services (1-4: 1)
Professional, Scientific, and Technical Services: Offices of Certified Public Accountants (1-4: 1)
Fatal accident statistics in 2014:
Fatal accident count: 2
Vehicles involved in fatal accidents: 2
Fatal accidents caused by drunken drivers: 1
Fatalities: 2
Persons involved in fatal accidents: 3
Pedestrians involved in fatal accidents: 0
Fatal accident statistics in 2013:
Fatal accident count: 1
Vehicles involved in fatal accidents: 1
Fatal accidents caused by drunken drivers: 1
Fatalities: 1
Persons involved in fatal accidents: 1
Pedestrians involved in fatal accidents: 0
Home Mortgage Disclosure Act Aggregated Statistics For Year 2009 (Based on 4 partial tracts)
A) FHA, FSA/RHS & VA Home Purchase Loans
B) Conventional Home Purchase Loans
C) Refinancings
D) Home Improvement Loans
E) Loans on Dwellings For 5+ Families
F) Non-occupant Loans on < 5 Family Dwellings (A B C & D)
G) Loans On Manufactured Home Dwelling (A B C & D)
Number
Average Value
Number
Average Value
Number
Average Value
Number
Average Value
Number
Average Value
Number
Average Value
Number
Average Value
LOANS ORIGINATED
9
$105,339
7
$83,656
63
$120,173
6
$22,195
1
$141,030
15
$105,133
9
$62,209
APPLICATIONS APPROVED, NOT ACCEPTED
0
$0
3
$41,870
3
$186,967
0
$0
0
$0
0
$0
4
$35,885
APPLICATIONS DENIED
4
$84,398
9
$66,528
42
$125,445
7
$39,349
0
$0
2
$81,650
11
$50,606
APPLICATIONS WITHDRAWN
3
$65,613
1
$62,640
22
$111,882
3
$54,197
0
$0
0
$0
5
$54,234
FILES CLOSED FOR INCOMPLETENESS
2
$107,455
0
$0
2
$90,935
0
$0
0
$0
0
$0
0
$0
Aggregated Statistics For Year 2008 (Based on 4 partial tracts)
A) FHA, FSA/RHS & VA Home Purchase Loans
B) Conventional Home Purchase Loans
C) Refinancings
D) Home Improvement Loans
F) Non-occupant Loans on < 5 Family Dwellings (A B C & D)
G) Loans On Manufactured Home Dwelling (A B C & D)
Number
Average Value
Number
Average Value
Number
Average Value
Number
Average Value
Number
Average Value
Number
Average Value
LOANS ORIGINATED
11
$106,256
13
$116,759
76
$96,153
7
$50,406
21
$107,073
25
$64,330
APPLICATIONS APPROVED, NOT ACCEPTED
1
$46,870
6
$64,398
7
$115,311
0
$0
3
$62,417
7
$55,596
APPLICATIONS DENIED
5
$83,452
16
$61,185
60
$115,904
8
$37,805
5
$80,028
18
$56,127
APPLICATIONS WITHDRAWN
1
$125,150
1
$151,200
32
$126,485
3
$89,910
0
$0
2
$95,200
FILES CLOSED FOR INCOMPLETENESS
0
$0
2
$234,200
4
$111,818
0
$0
0
$0
0
$0
Aggregated Statistics For Year 2007 (Based on 4 partial tracts)
A) FHA, FSA/RHS & VA Home Purchase Loans
B) Conventional Home Purchase Loans
C) Refinancings
D) Home Improvement Loans
F) Non-occupant Loans on < 5 Family Dwellings (A B C & D)
G) Loans On Manufactured Home Dwelling (A B C & D)
Number
Average Value
Number
Average Value
Number
Average Value
Number
Average Value
Number
Average Value
Number
Average Value
LOANS ORIGINATED
10
$92,398
44
$91,317
88
$105,488
9
$40,943
16
$73,759
31
$63,997
APPLICATIONS APPROVED, NOT ACCEPTED
1
$41,690
8
$64,569
12
$127,442
2
$12,375
1
$30,430
4
$39,875
APPLICATIONS DENIED
6
$93,287
17
$72,389
60
$110,396
13
$46,443
4
$35,262
19
$63,748
APPLICATIONS WITHDRAWN
1
$61,340
3
$182,990
20
$122,896
1
$106,270
0
$0
2
$41,100
FILES CLOSED FOR INCOMPLETENESS
2
$66,670
1
$273,440
7
$162,681
1
$76,930
1
$113,180
0
$0
Aggregated Statistics For Year 2006 (Based on 4 partial tracts)
A) FHA, FSA/RHS & VA Home Purchase Loans
B) Conventional Home Purchase Loans
C) Refinancings
D) Home Improvement Loans
F) Non-occupant Loans on < 5 Family Dwellings (A B C & D)
G) Loans On Manufactured Home Dwelling (A B C & D)
Number
Average Value
Number
Average Value
Number
Average Value
Number
Average Value
Number
Average Value
Number
Average Value
LOANS ORIGINATED
14
$99,780
49
$99,634
61
$88,998
16
$48,021
12
$103,395
21
$51,705
APPLICATIONS APPROVED, NOT ACCEPTED
2
$66,235
5
$73,202
15
$97,815
3
$38,197
1
$96,770
7
$48,839
APPLICATIONS DENIED
3
$98,370
24
$86,378
60
$99,634
11
$32,305
3
$68,187
28
$65,956
APPLICATIONS WITHDRAWN
1
$73,440
4
$94,758
40
$101,422
1
$38,020
2
$68,710
3
$66,050
FILES CLOSED FOR INCOMPLETENESS
0
$0
2
$187,700
12
$122,823
0
$0
0
$0
1
$45,790
Aggregated Statistics For Year 2005 (Based on 4 partial tracts)
A) FHA, FSA/RHS & VA Home Purchase Loans
B) Conventional Home Purchase Loans
C) Refinancings
D) Home Improvement Loans
F) Non-occupant Loans on < 5 Family Dwellings (A B C & D)
G) Loans On Manufactured Home Dwelling (A B C & D)
Number
Average Value
Number
Average Value
Number
Average Value
Number
Average Value
Number
Average Value
Number
Average Value
LOANS ORIGINATED
11
$98,363
48
$108,921
72
$89,979
12
$43,474
15
$51,115
28
$58,842
APPLICATIONS APPROVED, NOT ACCEPTED
2
$106,450
12
$82,847
19
$84,451
3
$20,417
0
$0
7
$51,274
APPLICATIONS DENIED
2
$63,610
34
$65,426
67
$91,952
14
$29,225
3
$44,427
32
$47,025
APPLICATIONS WITHDRAWN
2
$97,300
6
$91,940
43
$112,262
7
$66,867
0
$0
4
$112,980
FILES CLOSED FOR INCOMPLETENESS
0
$0
1
$81,860
13
$123,898
0
$0
0
$0
2
$102,000
Aggregated Statistics For Year 2004 (Based on 4 partial tracts)
A) FHA, FSA/RHS & VA Home Purchase Loans
B) Conventional Home Purchase Loans
C) Refinancings
D) Home Improvement Loans
F) Non-occupant Loans on < 5 Family Dwellings (A B C & D)
G) Loans On Manufactured Home Dwelling (A B C & D)
Detailed PMIC statistics for the following Tracts:0101.00
, 0102.00
2003 - 2018 National Fire Incident Reporting System (NFIRS) incidents
Based on the data from the years 2003 - 2018 the average number of fires per year is 10. The highest number of fire incidents - 36 took place in 2008, and the least - 0 in 2004. The data has a declining trend.
When looking into fire subcategories, the most incidents belonged to: Outside Fires (54.4%), and Structure Fires (31.6%).
Fire incident types reported to NFIRS in Zip Code 30711


 Nearest zip codes: 30708, 30751, 37362, 30541, 30705, 37361.


 Based on the data from the years 2003 - 2018 the average number of fires per year is 10. The highest number of fire incidents - 36 took place in 2008, and the least - 0 in 2004. The data has a declining trend.
 When looking into fire subcategories, the most incidents belonged to: Outside Fires (54.4%), and Structure Fires (31.6%).