Estimated zip code population in 2022: 3,684 Zip code population in 2010: 3,395 Zip code population in 2000: 2,776
Houses and condos: 1,603 Renter-occupied apartments: 223
% of renters here:
15%
State:
33%
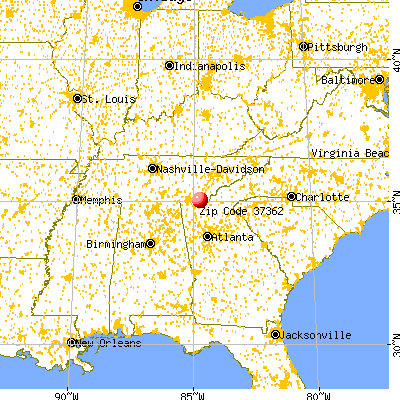
March 2022 cost of living index in zip code 37362: 78.8 (low, U.S. average is 100)
Land area: 76.0 sq. mi. Water area: 0.0 sq. mi.
Population density: 48 people per square mile
(very low).
OSM Map
General Map
Google Map
MSN Map
OSM Map
General Map
Google Map
MSN Map
OSM Map
General Map
Google Map
MSN Map
OSM Map
General Map
Google Map
MSN Map
Please wait while loading the map...
Real estate property taxes paid for housing units in 2022:
This zip code:
0.5% ($675)
Tennessee:
0.5% ($1,376)
Median real estate property taxes paid for housing units with mortgages in 2022: $787 (0.4%) Median real estate property taxes paid for housing units with no mortgage in 2022: $571 (0.6%)
Business Search- 14 Million verified businesses
Males: 1,967
(53.4%)
Females: 1,717
(46.6%)
For population 25 years and over in 37362:
High school or higher: 81.7%
Bachelor's degree or higher: 9.2%
Graduate or professional degree: 2.0%
Unemployed: 7.9%
Mean travel time to work (commute): 25.8 minutes
For population 15 years and over in 37362:
Never married: 19.1%
Now married: 51.6%
Separated: 1.3%
Widowed: 8.9%
Divorced: 19.1%
Zip code 37362 compared to state average:
Median household income below state average.
Median house value below state average.
Unemployed percentage above state average.
Black race population percentage significantly below state average.
Hispanic race population percentage significantly below state average.
Median age above state average.
Foreign-born population percentage significantly below state average.
Renting percentage below state average.
Length of stay since moving in significantly above state average.
Number of college students significantly below state average.
Percentage of population with a bachelor's degree or higher significantly below state average.
Averages for the 2020 tax year for zip code 37362, filed in 2021:
Average Adjusted Gross Income (AGI) in 2020: $47,867 (Individual Income Tax Returns)
Here:
$47,867
State:
$69,014
Salary/wage: $43,992 (reported on 84.7% of returns)
Here:
$43,992
State:
$55,872
(% of AGI for various income ranges: 1115.3% for AGIs below $25k, 3657.6% for AGIs $25k-50k, 6077.4% for AGIs $50k-75k, 8788.3% for AGIs $75k-100k, 18383.3% for AGIs $100k-200k)
Taxable interest for individuals: $529 (reported on 18.7% of returns)
This zip code:
$529
Tennessee:
$1,945
(% of AGI for various income ranges: 7.7% for AGIs below $25k, 10.9% for AGIs $25k-50k, 4.7% for AGIs $50k-75k, 5.8% for AGIs $75k-100k, 68.9% for AGIs $100k-200k)
Ordinary dividends: $522 (reported on 6.0% of returns)
Here:
$522
State:
$8,105
(% of AGI for various income ranges: 2.6% for AGIs below $25k, 11.6% for AGIs $50k-75k, 15.6% for AGIs $100k-200k)
Net capital gain/loss in AGI: +$6,586 (reported on 4.7% of returns)
Here:
+$6,586
State:
+$33,664
(% of AGI for various income ranges: 31.8% for AGIs $25k-50k, 392.2% for AGIs $100k-200k)
Profit/loss from business: +$12,974 (reported on 12.7% of returns)
Here:
+$12,974
State:
+$18,991
(% of AGI for various income ranges: 107.9% for AGIs below $25k, 97.9% for AGIs $25k-50k, 413.7% for AGIs $50k-75k, 208.3% for AGIs $75k-100k, 702.2% for AGIs $100k-200k)
Taxable individual retirement arrangement distribution: $15,888 (reported on 5.3% of returns)
37362:
$15,888
Tennessee:
$20,036
(% of AGI for various income ranges: 32.3% for AGIs below $25k, 119.1% for AGIs $25k-50k, 605.8% for AGIs $75k-100k)
Total itemized deductions: $28,867 (reported on 2.0% of returns)
Here:
$28,867
State:
$40,136
(% of AGI for various income ranges: 455.8% for AGIs $50k-75k)
Charity contributions: $12,750 (reported on 1.3% of returns)
Here:
$12,750
State:
$19,852
(% of AGI for various income ranges: 75.0% for AGIs $25k-50k)
Taxes paid: $4,267 (reported on 2.0% of returns)
37362:
$4,267
State:
$6,038
(% of AGI for various income ranges: 67.4% for AGIs $50k-75k)
Earned income credit: $2,288 (reported on 22.0% of returns)
Here:
$2,288
State:
$2,391
(% of AGI for various income ranges: 110.5% for AGIs below $25k, 82.4% for AGIs $25k-50k)
Percentage of individuals using paid preparers for their 2020 taxes: 96.0%
Here:
96%
State:
93%
(% for various income ranges: 96.4% for AGIs below $25k, 95.1% for AGIs $25k-50k, 95.8% for AGIs $50k-75k, 100.0% for AGIs $75k-100k, 93.3% for AGIs $100k-200k)
Averages for the 2012 tax year for zip code 37362, filed in 2013:
Average Adjusted Gross Income (AGI) in 2012: $36,147 (Individual Income Tax Returns)
Here:
$36,147
State:
$53,767
Salary/wage: $34,757 (reported on 88.5% of returns)
Here:
$34,757
State:
$45,421
(% of AGI for various income ranges: 81.7% for AGIs below $25k, 87.4% for AGIs $25k-50k, 86.2% for AGIs $50k-75k, 86.8% for AGIs $75k-100k, 80.7% for AGIs $100k-200k)
Taxable interest for individuals: $472 (reported on 18.0% of returns)
This zip code:
$472
Tennessee:
$1,732
(% of AGI for various income ranges: 0.5% for AGIs below $25k, 0.3% for AGIs $25k-50k, 0.2% for AGIs $50k-75k, 0.1% for AGIs $75k-100k, 0.1% for AGIs $100k-200k)
Ordinary dividends: $960 (reported on 3.6% of returns)
Here:
$960
State:
$6,739
Profit/loss from business: +$9,333 (reported on 12.9% of returns)
Here:
+$9,333
State:
+$15,240
(% of AGI for various income ranges: 7.8% for AGIs below $25k, 3.9% for AGIs $25k-50k, 1.9% for AGIs $50k-75k, 3.3% for AGIs $75k-100k)
Taxable individual retirement arrangement distribution: $7,960 (reported on 3.6% of returns)
37362:
$7,960
Tennessee:
$15,505
Total itemized deductions: $16,194 (24% of AGI, reported on 12.9% of returns)
Here:
$16,194
State:
$21,976
Here:
24.1% of AGI
State:
17.8% of AGI
(% of AGI for various income ranges: 6.4% for AGIs $25k-50k, 5.9% for AGIs $50k-75k, 7.2% for AGIs $75k-100k, 9.5% for AGIs $100k-200k)
Charity contributions: $5,192 (reported on 8.6% of returns)
Here:
$5,192
State:
$6,709
(% of AGI for various income ranges: 0.7% for AGIs $25k-50k, 1.2% for AGIs $50k-75k, 1.8% for AGIs $75k-100k, 3.2% for AGIs $100k-200k)
Taxes paid: $2,961 (reported on 12.9% of returns)
37362:
$2,961
State:
$4,829
(% of AGI for various income ranges: 1.0% for AGIs $25k-50k, 1.1% for AGIs $50k-75k, 1.5% for AGIs $75k-100k, 1.9% for AGIs $100k-200k)
Earned income credit: $2,223 (reported on 28.1% of returns)
Here:
$2,223
State:
$2,404
(% of AGI for various income ranges: 7.7% for AGIs below $25k, 1.7% for AGIs $25k-50k)
Percentage of individuals using paid preparers for their 2012 taxes: 61.9%
Here:
62%
State:
52%
(% for various income ranges: 59.7% for AGIs below $25k, 61.0% for AGIs $25k-50k, 63.6% for AGIs $50k-75k, 75.0% for AGIs $75k-100k, 66.7% for AGIs $100k-200k)
Averages for the 2004 tax year for zip code 37362, filed in 2005:
Average Adjusted Gross Income (AGI) in 2004: $31,491 (Individual Income Tax Returns)
Here:
$31,491
State:
$44,088
Salary/wage: $30,257 (reported on 91.2% of returns)
Here:
$30,257
State:
$38,825
(% of AGI for various income ranges: 87.3% for AGIs below $10k, 84.6% for AGIs $10k-25k, 93.2% for AGIs $25k-50k, 87.1% for AGIs $50k-75k, 88.5% for AGIs $75k-100k, 69.9% for AGIs over 100k)
Taxable interest for individuals: $633 (reported on 26.7% of returns)
This zip code:
$633
Tennessee:
$1,802
(% of AGI for various income ranges: 1.7% for AGIs below $10k, 1.0% for AGIs $10k-25k, 0.6% for AGIs $25k-50k, 0.2% for AGIs $50k-75k, 0.2% for AGIs $75k-100k, 0.3% for AGIs over 100k)
Taxable dividends: $312 (reported on 5.8% of returns)
Here:
$312
State:
$3,727
(% of AGI for various income ranges: 0.1% for AGIs $10k-25k, 0.1% for AGIs $25k-50k, 0.0% for AGIs $50k-75k, 0.1% for AGIs $75k-100k)
Net capital gain/loss: +$7,982 (reported on 4.2% of returns)
Here:
+$7,982
State:
+$15,776
(% of AGI for various income ranges: -0.1% for AGIs $10k-25k, 0.0% for AGIs $25k-50k, 0.3% for AGIs $50k-75k, 10.7% for AGIs $75k-100k)
Profit/loss from business: +$7,196 (reported on 14.6% of returns)
Here:
+$7,196
State:
+$12,882
(% of AGI for various income ranges: 13.7% for AGIs below $10k, 6.5% for AGIs $10k-25k, 1.7% for AGIs $25k-50k, 4.7% for AGIs $50k-75k, -0.7% for AGIs $75k-100k)
IRA payment deduction: $1,765 (reported on 1.3% of returns)
37362:
$1,765
Tennessee:
$2,934
Total itemized deductions: $13,570 (23% of AGI, reported on 11.2% of returns)
Here:
$13,570
State:
$18,035
Here:
22.6% of AGI
State:
19.9% of AGI
(% of AGI for various income ranges: 2.6% for AGIs $10k-25k, 4.0% for AGIs $25k-50k, 5.0% for AGIs $50k-75k, 11.3% for AGIs $75k-100k, 6.7% for AGIs over 100k)
Charity contributions deductions: $4,461 (7% of AGI, reported on 8.7% of returns)
Here:
$4,461
State:
$5,167
Here:
6.8% of AGI
State:
5.3% of AGI
(% of AGI for various income ranges: 0.3% for AGIs $10k-25k, 0.6% for AGIs $25k-50k, 1.3% for AGIs $50k-75k, 3.4% for AGIs $75k-100k, 3.6% for AGIs over 100k)
Total tax: $3,265 (reported on 73.1% of returns)
37362:
$3,265
State:
$7,482
(% of AGI for various income ranges: 4.3% for AGIs below $10k, 4.0% for AGIs $10k-25k, 5.7% for AGIs $25k-50k, 8.8% for AGIs $50k-75k, 9.9% for AGIs $75k-100k, 17.6% for AGIs over 100k)
Earned income credit: $1,649 (reported on 22.3% of returns)
Here:
$1,649
State:
$1,826
Percentage of individuals using paid preparers for their 2004 taxes: 69.6%
Here:
70%
State:
60%
(% for various income ranges: 63.2% for AGIs below $10k, 71.3% for AGIs $10k-25k, 71.6% for AGIs $25k-50k, 69.9% for AGIs $50k-75k, 64.4% for AGIs $75k-100k, 78.3% for AGIs over 100k)
Household received Food Stamps/SNAP in the past 12 months: 228 Household did not receive Food Stamps/SNAP in the past 12 months: 1,233
Women who had a birth in the past 12 months: 41 (30 now married, 11 unmarried) Women who did not have a birth in the past 12 months: 547 (328 now married, 218 unmarried)
Housing units in zip code 37362 with a mortgage: 496 (66 second mortgage, 67 both second mortgage and home equity loan) Median monthly owner costs for units with a mortgage: $1,064 Median monthly owner costs for units without a mortgage: $304
Residents with income below the poverty level in 2022:
This zip code:
14.2%
Whole state:
13.3%
Residents with income below 50% of the poverty level in 2022:
This zip code:
7.2%
Whole state:
7.1%
Median number of rooms in houses and condos:
Here:
5.9
State:
6.5
Median number of rooms in apartments:
Here:
4.7
State:
4.4
Notable locations in this zip code not listed on our city pages
Notable locations in zip code 37362: Sylco Campground (A), Sheeds Creek Checking Station (B), West Polk County Fire and Rescue Station 3 (C). Display/hide their locations on the map
Churches in zip code 37362 include: Conasauga River Baptist Church (A), Ball Play Church (B), Ladd Springs Church (C), Shady Springs Church (D), Antioch Church (E), Mountain Springs Church (F), Antioch Church (G), Shady Springs Church (H), Mountain Springs Church (I). Display/hide their locations on the map
Cemeteries: Swan Cemetery (1), Shannon Cemetery (2), Ware Cemetery (3), Ball Play Cemetery (4), Hooker Cemetery (5), Hillard - Ladd Cemetery (6), Dills Cemetery (7). Display/hide their locations on the map
Streams, rivers, and creeks: York Branch (A), Jack Branch (B), Dull Hoe Creek (C), Gunterpole Branch (D), Hand Branch (E), Hawkins Branch (F), Iron Ore Branch (G), Little Sylco Branch (H), Old Fort Creek (I). Display/hide their locations on the map
Size of family households: 487 2-persons, 252 3-persons, 218 4-persons, 41 5-persons, 33 6-persons, 36 7-or-more-persons
Size of nonfamily households: 360 1-person, 32 2-persons
426 married couples with children.
196 single-parent households (25 men, 171 women).
99.9% of residents of 37362 zip code speak English at home.
Foreign born population: 0 (0.0%)
:
0.0%
Whole state:
5.6%
39%American
15%Irish
9%English
7%German
3%French
1%European
1%Norwegian
Housing units lacking complete plumbing facilities: 6.1% Housing units lacking complete kitchen facilities: 4.0%
70.9%Electricity
17.2%Bottled, tank, or LP gas
7.2%Wood
2.7%Fuel oil, kerosene, etc.
1.5%No fuel used
0.6%Utility gas
Population in 1990: 1,522. Population change in the 1990s: +1,254 (+82.4%).
Place of birth for U.S.-born residents:
This state: 2,565
Northeast: 232
Midwest: 178
South: 629
West: 57
70% of the 37362 zip code residents lived in the same house 5 years ago. Out of people who lived in different houses, 52% lived in this county. Out of people who lived in different counties, 50% lived in Tennessee.
98% of the 37362 zip code residents lived in the same house 1 year ago. Out of people who lived in different houses, 75% moved from this county. Out of people who lived in different houses, 27% moved from different county within same state. Out of people who lived in different houses, 18% moved from different state.
Private vs. public school enrollment:
Students in private schools in grades 1 to 8 (elementary and middle school): 58
Here:
15.3%
Tennessee:
15.0%
Students in private schools in grades 9 to 12 (high school): 59
Here:
40.0%
Tennessee:
16.2%
Students in private undergraduate colleges:
Here:
0.0%
Tennessee:
23.5%
Occupation by median earnings in the past 12 months ($)
78,541Management occupations
47,083Transportation occupations
45,611Personal care and service occupations
45,315Construction and extraction occupations
40,064Office and administrative support occupations
38,766Installation, maintenance, and repair occupations
Top industries in this zip code by the number of employees in 2005:
Mining: Crushed and Broken Limestone Mining and Quarrying (20-49 employees: 1 establishment)
Construction: Plumbing, Heating, and Air-Conditioning Contractors (10-19: 1, 1-4: 1)
Wholesale Trade: Construction and Mining (except Oil Well) Machinery and Equipment Merchant Wholesalers (5-9: 1)
Wholesale Trade: Recyclable Material Merchant Wholesalers (5-9: 1)
Administrative and Support and Waste Management and Remediation Services: Landscaping Services (5-9: 1)
Construction: Commercial and Institutional Building Construction (5-9: 1)
Other Services (except Public Administration): Religious Organizations (1-4: 3)
Construction: Site Preparation Contractors (1-4: 2)
Fatal accident statistics in 2011:
Fatal accident count: 1
Vehicles involved in fatal accidents: 1
Fatal accidents caused by drunken drivers: 0
Fatalities: 1
Persons involved in fatal accidents: 1
Pedestrians involved in fatal accidents: 0
Fatal accident statistics in 2010:
Fatal accident count: 1
Vehicles involved in fatal accidents: 1
Fatal accidents caused by drunken drivers: 1
Fatalities: 1
Persons involved in fatal accidents: 2
Pedestrians involved in fatal accidents: 0
Home Mortgage Disclosure Act Aggregated Statistics For Year 2009 (Based on 2 partial tracts)
A) FHA, FSA/RHS & VA Home Purchase Loans
B) Conventional Home Purchase Loans
C) Refinancings
D) Home Improvement Loans
F) Non-occupant Loans on < 5 Family Dwellings (A B C & D)
G) Loans On Manufactured Home Dwelling (A B C & D)
Number
Average Value
Number
Average Value
Number
Average Value
Number
Average Value
Number
Average Value
Number
Average Value
LOANS ORIGINATED
20
$130,153
14
$129,982
76
$124,112
6
$30,520
9
$121,419
9
$58,446
APPLICATIONS APPROVED, NOT ACCEPTED
0
$0
1
$62,260
8
$115,595
0
$0
0
$0
1
$49,440
APPLICATIONS DENIED
2
$107,585
3
$84,387
26
$111,087
5
$13,460
1
$194,570
5
$56,584
APPLICATIONS WITHDRAWN
2
$120,630
2
$103,920
18
$126,506
1
$7,320
0
$0
1
$118,570
FILES CLOSED FOR INCOMPLETENESS
2
$109,185
0
$0
10
$120,035
0
$0
0
$0
0
$0
Aggregated Statistics For Year 2008 (Based on 2 partial tracts)
A) FHA, FSA/RHS & VA Home Purchase Loans
B) Conventional Home Purchase Loans
C) Refinancings
D) Home Improvement Loans
F) Non-occupant Loans on < 5 Family Dwellings (A B C & D)
G) Loans On Manufactured Home Dwelling (A B C & D)
Number
Average Value
Number
Average Value
Number
Average Value
Number
Average Value
Number
Average Value
Number
Average Value
LOANS ORIGINATED
22
$112,765
28
$140,904
53
$104,853
9
$33,521
12
$80,840
11
$52,980
APPLICATIONS APPROVED, NOT ACCEPTED
0
$0
2
$211,505
5
$109,322
2
$51,505
0
$0
1
$67,750
APPLICATIONS DENIED
5
$120,218
5
$95,772
40
$124,236
6
$48,832
3
$70,653
6
$49,518
APPLICATIONS WITHDRAWN
1
$114,450
4
$100,258
20
$132,556
1
$45,780
2
$94,765
1
$64,550
FILES CLOSED FOR INCOMPLETENESS
0
$0
0
$0
3
$111,703
0
$0
0
$0
0
$0
Aggregated Statistics For Year 2007 (Based on 2 partial tracts)
A) FHA, FSA/RHS & VA Home Purchase Loans
B) Conventional Home Purchase Loans
C) Refinancings
D) Home Improvement Loans
E) Loans on Dwellings For 5+ Families
F) Non-occupant Loans on < 5 Family Dwellings (A B C & D)
G) Loans On Manufactured Home Dwelling (A B C & D)
Number
Average Value
Number
Average Value
Number
Average Value
Number
Average Value
Number
Average Value
Number
Average Value
Number
Average Value
LOANS ORIGINATED
13
$115,999
56
$116,902
78
$116,352
13
$50,781
1
$142,380
12
$85,151
23
$69,964
APPLICATIONS APPROVED, NOT ACCEPTED
0
$0
7
$116,609
12
$124,292
2
$115,825
0
$0
1
$93,850
4
$65,350
APPLICATIONS DENIED
3
$121,773
12
$92,590
62
$119,080
13
$55,006
0
$0
1
$103,920
14
$65,956
APPLICATIONS WITHDRAWN
1
$126,350
4
$155,195
22
$109,643
2
$76,910
0
$0
0
$0
2
$51,505
FILES CLOSED FOR INCOMPLETENESS
0
$0
0
$0
9
$176,609
0
$0
0
$0
0
$0
0
$0
Aggregated Statistics For Year 2006 (Based on 2 partial tracts)
A) FHA, FSA/RHS & VA Home Purchase Loans
B) Conventional Home Purchase Loans
C) Refinancings
D) Home Improvement Loans
F) Non-occupant Loans on < 5 Family Dwellings (A B C & D)
G) Loans On Manufactured Home Dwelling (A B C & D)
Number
Average Value
Number
Average Value
Number
Average Value
Number
Average Value
Number
Average Value
Number
Average Value
LOANS ORIGINATED
12
$111,627
80
$106,999
76
$85,994
12
$42,079
22
$80,365
18
$55,063
APPLICATIONS APPROVED, NOT ACCEPTED
0
$0
9
$100,512
19
$96,692
2
$18,770
5
$60,978
4
$75,422
APPLICATIONS DENIED
2
$59,745
23
$86,982
70
$98,492
13
$37,715
11
$82,195
21
$55,176
APPLICATIONS WITHDRAWN
0
$0
7
$114,581
32
$105,051
2
$78,055
3
$58,293
2
$81,260
FILES CLOSED FOR INCOMPLETENESS
0
$0
2
$124,295
4
$110,902
0
$0
0
$0
0
$0
Aggregated Statistics For Year 2005 (Based on 2 partial tracts)
A) FHA, FSA/RHS & VA Home Purchase Loans
B) Conventional Home Purchase Loans
C) Refinancings
D) Home Improvement Loans
F) Non-occupant Loans on < 5 Family Dwellings (A B C & D)
G) Loans On Manufactured Home Dwelling (A B C & D)
Number
Average Value
Number
Average Value
Number
Average Value
Number
Average Value
Number
Average Value
Number
Average Value
LOANS ORIGINATED
11
$104,004
63
$78,793
74
$90,446
12
$32,313
15
$73,279
22
$51,378
APPLICATIONS APPROVED, NOT ACCEPTED
1
$28,380
11
$76,619
14
$92,181
2
$20,830
1
$24,260
6
$55,852
APPLICATIONS DENIED
4
$69,128
26
$76,294
56
$110,673
11
$30,631
5
$104,562
20
$57,362
APPLICATIONS WITHDRAWN
0
$0
7
$80,639
43
$115,791
3
$247,213
2
$38,685
5
$70,868
FILES CLOSED FOR INCOMPLETENESS
0
$0
5
$75,994
11
$122,607
0
$0
0
$0
0
$0
Aggregated Statistics For Year 2004 (Based on 2 partial tracts)
A) FHA, FSA/RHS & VA Home Purchase Loans
B) Conventional Home Purchase Loans
C) Refinancings
D) Home Improvement Loans
F) Non-occupant Loans on < 5 Family Dwellings (A B C & D)
G) Loans On Manufactured Home Dwelling (A B C & D)
Detailed PMIC statistics for the following Tracts:0116.00
2005 - 2018 National Fire Incident Reporting System (NFIRS) incidents
Based on the data from the years 2005 - 2018 the average number of fire incidents per year is 16. The highest number of reported fire incidents - 39 took place in 2008, and the least - 4 in 2015. The data has a dropping trend.
When looking into fire subcategories, the most incidents belonged to: Outside Fires (51.8%), and Structure Fires (30.5%).
Fire incident types reported to NFIRS in Zip Code 37362


 Nearest zip codes: 30751, 37361, 30708, 30711, 37323, 37307.


 Based on the data from the years 2005 - 2018 the average number of fire incidents per year is 16. The highest number of reported fire incidents - 39 took place in 2008, and the least - 4 in 2015. The data has a dropping trend.
 When looking into fire subcategories, the most incidents belonged to: Outside Fires (51.8%), and Structure Fires (30.5%).