Estimated zip code population in 2022: 5,040 Zip code population in 2010: 4,647 Zip code population in 2000: 3,456
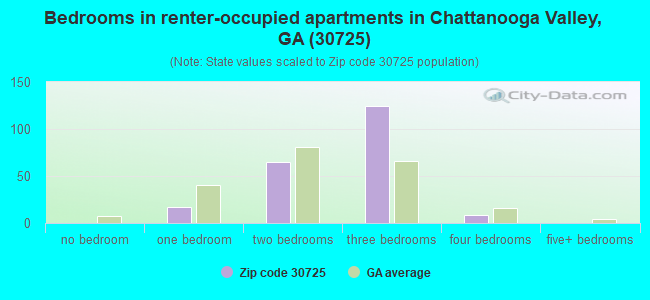
Houses and condos: 1,940 Renter-occupied apartments: 212
% of renters here:
12%
State:
34%
March 2022 cost of living index in zip code 30725: 87.4 (less than average, U.S. average is 100)
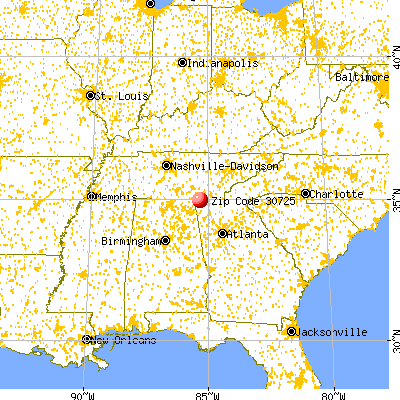
Land area: 14.9 sq. mi. Water area: 0.0 sq. mi.
Population density: 337 people per square mile
(very low).
OSM Map
General Map
Google Map
MSN Map
OSM Map
General Map
Google Map
MSN Map
OSM Map
General Map
Google Map
MSN Map
OSM Map
General Map
Google Map
MSN Map
Please wait while loading the map...
Real estate property taxes paid for housing units in 2022:
This zip code:
0.7% ($1,611)
Georgia:
0.7% ($2,160)
Median real estate property taxes paid for housing units with mortgages in 2022: $1,629 (0.6%) Median real estate property taxes paid for housing units with no mortgage in 2022: $1,547 (0.8%)
Business Search- 14 Million verified businesses
Males: 2,701
(53.6%)
Females: 2,337
(46.4%)
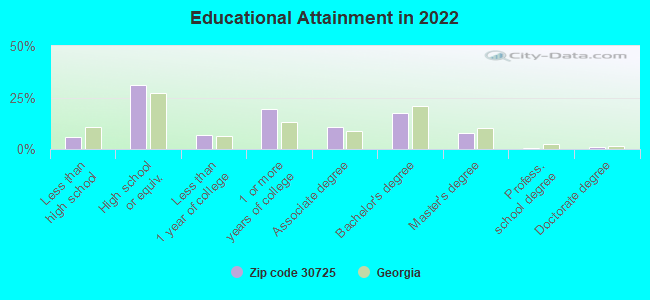
For population 25 years and over in 30725:
High school or higher: 94.3%
Bachelor's degree or higher: 26.7%
Graduate or professional degree: 9.3%
Unemployed: 1.3%
Mean travel time to work (commute): 23.5 minutes
For population 15 years and over in 30725:
Never married: 22.8%
Now married: 49.4%
Separated: 0.3%
Widowed: 7.0%
Divorced: 20.5%
Zip code 30725 compared to state average:
Unemployed percentage significantly below state average.
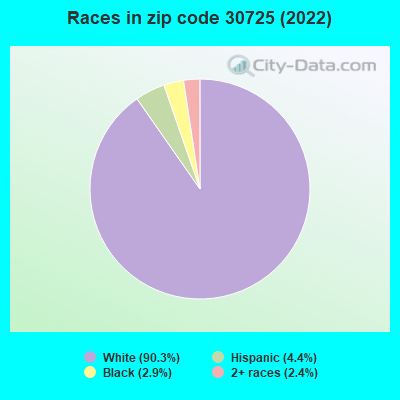
Black race population percentage significantly below state average.
Hispanic race population percentage below state average.
Median age above state average.
Foreign-born population percentage significantly below state average.
Renting percentage significantly below state average.
Length of stay since moving in significantly above state average.
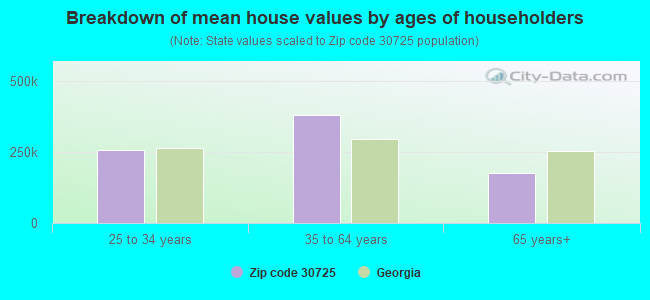
Estimated median house/condo value in 2022: $238,259
30725:
$238,259
Georgia:
$297,400
According to our research of Georgia and other state lists, there were 12 registered sex offenders living in 30725 zip code as of May 28, 2024. The ratio of all residents to sex offenders in zip code 30725 is 370 to 1. The ratio of registered sex offenders to all residents in this zip code is near the state average.
Median resident age:
This zip code:
42.1 years
Georgia median age:
37.6 years
Average household size:
This zip code:
2.9 people
Georgia:
2.6 people
Averages for the 2020 tax year for zip code 30725, filed in 2021:
Average Adjusted Gross Income (AGI) in 2020: $58,599 (Individual Income Tax Returns)
Here:
$58,599
State:
$70,847
Salary/wage: $51,448 (reported on 82.8% of returns)
Here:
$51,448
State:
$59,126
(% of AGI for various income ranges: 1039.6% for AGIs below $25k, 3593.8% for AGIs $25k-50k, 6392.4% for AGIs $50k-75k, 9825.3% for AGIs $75k-100k, 16103.3% for AGIs $100k-200k)
Taxable interest for individuals: $662 (reported on 25.6% of returns)
This zip code:
$662
Georgia:
$2,011
(% of AGI for various income ranges: 10.6% for AGIs below $25k, 13.6% for AGIs $25k-50k, 37.2% for AGIs $50k-75k, 38.7% for AGIs $75k-100k, 26.1% for AGIs $100k-200k)
Ordinary dividends: $3,796 (reported on 12.3% of returns)
Here:
$3,796
State:
$8,996
(% of AGI for various income ranges: 14.0% for AGIs below $25k, 22.1% for AGIs $25k-50k, 34.4% for AGIs $50k-75k, 36.7% for AGIs $75k-100k, 152.2% for AGIs $100k-200k)
Net capital gain/loss in AGI: +$9,062 (reported on 11.8% of returns)
Here:
+$9,062
State:
+$28,402
(% of AGI for various income ranges: 2.6% for AGIs below $25k, 33.1% for AGIs $25k-50k, 49.2% for AGIs $50k-75k, 174.7% for AGIs $75k-100k, 346.7% for AGIs $100k-200k)
Profit/loss from business: +$10,282 (reported on 16.7% of returns)
Here:
+$10,282
State:
+$6,707
(% of AGI for various income ranges: 155.6% for AGIs below $25k, 179.7% for AGIs $25k-50k, 251.2% for AGIs $50k-75k, 208.7% for AGIs $75k-100k, 597.8% for AGIs $100k-200k)
Taxable individual retirement arrangement distribution: $14,847 (reported on 8.4% of returns)
30725:
$14,847
Georgia:
$20,525
(% of AGI for various income ranges: 72.0% for AGIs below $25k, 73.8% for AGIs $25k-50k, 208.8% for AGIs $50k-75k, 203.3% for AGIs $75k-100k, 582.8% for AGIs $100k-200k)
Total itemized deductions: $44,333 (reported on 4.4% of returns)
Here:
$44,333
State:
$34,001
(% of AGI for various income ranges: 496.0% for AGIs $50k-75k, 580.6% for AGIs $100k-200k)
Charity contributions: $14,911 (reported on 4.4% of returns)
Here:
$14,911
State:
$14,164
(% of AGI for various income ranges: 195.6% for AGIs $50k-75k, 245.0% for AGIs $100k-200k)
Taxes paid: $7,767 (reported on 4.4% of returns)
30725:
$7,767
State:
$7,540
(% of AGI for various income ranges: 75.2% for AGIs $50k-75k, 160.0% for AGIs $100k-200k)
Earned income credit: $2,447 (reported on 16.7% of returns)
Here:
$2,447
State:
$2,530
(% of AGI for various income ranges: 97.0% for AGIs below $25k, 89.0% for AGIs $25k-50k)
Percentage of individuals using paid preparers for their 2020 taxes: 94.1%
Here:
94%
State:
93%
(% for various income ranges: 92.3% for AGIs below $25k, 93.9% for AGIs $25k-50k, 94.3% for AGIs $50k-75k, 95.5% for AGIs $75k-100k, 96.4% for AGIs $100k-200k, 100.0% for AGIs over 200k)
Averages for the 2012 tax year for zip code 30725, filed in 2013:
Average Adjusted Gross Income (AGI) in 2012: $47,167 (Individual Income Tax Returns)
Here:
$47,167
State:
$56,131
Salary/wage: $43,594 (reported on 83.8% of returns)
Here:
$43,594
State:
$47,942
(% of AGI for various income ranges: 70.0% for AGIs below $25k, 81.6% for AGIs $25k-50k, 81.1% for AGIs $50k-75k, 81.0% for AGIs $75k-100k, 81.2% for AGIs $100k-200k, 54.5% for AGIs over 200k)
Taxable interest for individuals: $714 (reported on 27.0% of returns)
This zip code:
$714
Georgia:
$1,706
(% of AGI for various income ranges: 1.4% for AGIs below $25k, 0.3% for AGIs $25k-50k, 0.3% for AGIs $50k-75k, 0.2% for AGIs $75k-100k, 0.4% for AGIs $100k-200k)
Ordinary dividends: $1,990 (reported on 10.8% of returns)
Here:
$1,990
State:
$7,265
(% of AGI for various income ranges: 0.5% for AGIs below $25k, 0.6% for AGIs $25k-50k, 0.2% for AGIs $50k-75k, 0.2% for AGIs $75k-100k, 0.9% for AGIs $100k-200k)
Net capital gain/loss in AGI: +$1,327 (reported on 8.1% of returns)
Here:
+$1,327
State:
+$16,323
(% of AGI for various income ranges: 0.2% for AGIs $50k-75k, 0.3% for AGIs $75k-100k, 0.7% for AGIs $100k-200k)
Profit/loss from business: +$7,766 (reported on 20.5% of returns)
Here:
+$7,766
State:
+$7,583
(% of AGI for various income ranges: 12.9% for AGIs below $25k, 2.3% for AGIs $25k-50k, 2.0% for AGIs $50k-75k, 2.2% for AGIs $75k-100k, 3.5% for AGIs $100k-200k)
Taxable individual retirement arrangement distribution: $11,100 (reported on 8.6% of returns)
30725:
$11,100
Georgia:
$17,199
(% of AGI for various income ranges: 2.8% for AGIs below $25k, 3.1% for AGIs $25k-50k, 1.5% for AGIs $50k-75k, 4.6% for AGIs $75k-100k)
Total itemized deductions: $18,486 (22% of AGI, reported on 31.4% of returns)
Here:
$18,486
State:
$23,886
Here:
21.8% of AGI
State:
21.5% of AGI
(% of AGI for various income ranges: 6.7% for AGIs below $25k, 8.3% for AGIs $25k-50k, 13.3% for AGIs $50k-75k, 16.3% for AGIs $75k-100k, 14.9% for AGIs $100k-200k, 10.8% for AGIs over 200k)
Charity contributions: $4,683 (reported on 25.9% of returns)
Here:
$4,683
State:
$5,507
(% of AGI for various income ranges: 0.8% for AGIs below $25k, 1.1% for AGIs $25k-50k, 2.8% for AGIs $50k-75k, 3.5% for AGIs $75k-100k, 3.3% for AGIs $100k-200k, 3.5% for AGIs over 200k)
Taxes paid: $5,596 (reported on 30.8% of returns)
30725:
$5,596
State:
$7,838
(% of AGI for various income ranges: 1.0% for AGIs below $25k, 1.7% for AGIs $25k-50k, 3.6% for AGIs $50k-75k, 4.7% for AGIs $75k-100k, 5.1% for AGIs $100k-200k, 5.4% for AGIs over 200k)
Earned income credit: $2,498 (reported on 21.6% of returns)
Here:
$2,498
State:
$2,589
(% of AGI for various income ranges: 8.5% for AGIs below $25k, 1.3% for AGIs $25k-50k)
Percentage of individuals using paid preparers for their 2012 taxes: 54.6%
Here:
55%
State:
55%
(% for various income ranges: 52.7% for AGIs below $25k, 54.3% for AGIs $25k-50k, 55.2% for AGIs $50k-75k, 57.9% for AGIs $75k-100k, 66.7% for AGIs $100k-200k)
Averages for the 2004 tax year for zip code 30725, filed in 2005:
Average Adjusted Gross Income (AGI) in 2004: $38,947 (Individual Income Tax Returns)
Here:
$38,947
State:
$47,553
Salary/wage: $36,652 (reported on 86.5% of returns)
Here:
$36,652
State:
$42,178
(% of AGI for various income ranges: 146.8% for AGIs below $10k, 78.1% for AGIs $10k-25k, 83.1% for AGIs $25k-50k, 85.9% for AGIs $50k-75k, 87.3% for AGIs $75k-100k, 65.5% for AGIs over 100k)
Taxable interest for individuals: $1,229 (reported on 34.6% of returns)
This zip code:
$1,229
Georgia:
$1,772
(% of AGI for various income ranges: 5.5% for AGIs below $10k, 1.6% for AGIs $10k-25k, 1.1% for AGIs $25k-50k, 0.5% for AGIs $50k-75k, 0.4% for AGIs $75k-100k, 1.8% for AGIs over 100k)
Taxable dividends: $2,220 (reported on 12.5% of returns)
Here:
$2,220
State:
$4,283
(% of AGI for various income ranges: 2.9% for AGIs below $10k, 0.3% for AGIs $10k-25k, 0.5% for AGIs $25k-50k, 0.1% for AGIs $50k-75k, 0.3% for AGIs $75k-100k, 2.2% for AGIs over 100k)
Net capital gain/loss: +$5,337 (reported on 10.0% of returns)
Here:
+$5,337
State:
+$16,461
(% of AGI for various income ranges: -3.4% for AGIs below $10k, 0.1% for AGIs $10k-25k, 0.1% for AGIs $25k-50k, 0.5% for AGIs $50k-75k, 0.4% for AGIs $75k-100k, 6.0% for AGIs over 100k)
Profit/loss from business: +$5,988 (reported on 17.9% of returns)
Here:
+$5,988
State:
+$8,201
(% of AGI for various income ranges: 16.9% for AGIs below $10k, 8.4% for AGIs $10k-25k, 3.2% for AGIs $25k-50k, 2.3% for AGIs $50k-75k, 0.9% for AGIs $75k-100k, 0.1% for AGIs over 100k)
IRA payment deduction: $2,308 (reported on 1.5% of returns)
30725:
$2,308
Georgia:
$2,969
Total itemized deductions: $15,269 (21% of AGI, reported on 27.6% of returns)
Here:
$15,269
State:
$19,944
Here:
21.1% of AGI
State:
22.6% of AGI
(% of AGI for various income ranges: 12.4% for AGIs below $10k, 7.1% for AGIs $10k-25k, 9.9% for AGIs $25k-50k, 12.4% for AGIs $50k-75k, 13.2% for AGIs $75k-100k, 10.1% for AGIs over 100k)
Charity contributions deductions: $3,577 (5% of AGI, reported on 24.0% of returns)
Here:
$3,577
State:
$4,354
Here:
4.7% of AGI
State:
4.7% of AGI
(% of AGI for various income ranges: 1.2% for AGIs $10k-25k, 1.7% for AGIs $25k-50k, 2.4% for AGIs $50k-75k, 2.8% for AGIs $75k-100k, 2.9% for AGIs over 100k)
Total tax: $5,233 (reported on 75.0% of returns)
30725:
$5,233
State:
$8,223
(% of AGI for various income ranges: 3.7% for AGIs below $10k, 4.0% for AGIs $10k-25k, 6.5% for AGIs $25k-50k, 8.4% for AGIs $50k-75k, 10.2% for AGIs $75k-100k, 20.8% for AGIs over 100k)
Earned income credit: $1,859 (reported on 18.3% of returns)
Here:
$1,859
State:
$1,986
Percentage of individuals using paid preparers for their 2004 taxes: 60.3%
Here:
60%
State:
62%
(% for various income ranges: 52.2% for AGIs below $10k, 64.8% for AGIs $10k-25k, 61.7% for AGIs $25k-50k, 58.2% for AGIs $50k-75k, 57.7% for AGIs $75k-100k, 72.1% for AGIs over 100k)
Household received Food Stamps/SNAP in the past 12 months: 98 Household did not receive Food Stamps/SNAP in the past 12 months: 1,635
Women who had a birth in the past 12 months: 23 (23 now married, 0 unmarried) Women who did not have a birth in the past 12 months: 1,119 (541 now married, 577 unmarried)
Housing units in zip code 30725 with a mortgage: 684 (54 second mortgage, 57 both second mortgage and home equity loan) Median monthly owner costs for units with a mortgage: $1,438 Median monthly owner costs for units without a mortgage: $454
Residents with income below the poverty level in 2022:
This zip code:
10.5%
Whole state:
12.7%
Residents with income below 50% of the poverty level in 2022:
This zip code:
7.6%
Whole state:
6.3%
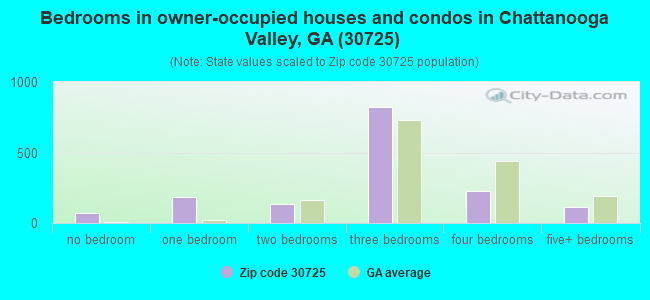
Median number of rooms in houses and condos:
Here:
5.9
State:
6.8
Median number of rooms in apartments:
Here:
5.5
State:
4.6
Notable locations in this zip code not listed on our city pages
Notable locations in zip code 30725: Walker County Emergency Services Station 10 WCES Depot (A), Walker County Emergency Services Station 2 - Chattanooga Valley (B). Display/hide their locations on the map
Churches in zip code 30725 include: Lessly Memorial Church (A), Flintstone United Methodist Church (B), Flintstone Baptist Church (C), Chattanooga Valley Presbyterian Church (D), Chandler Chapel (E), Chattanooga Valley Church (F), Valleyview Church (G). Display/hide their locations on the map
Size of family households: 509 2-persons, 371 3-persons, 181 4-persons, 146 5-persons, 8 6-persons, 71 7-or-more-persons
Size of nonfamily households: 440 1-person, 16 2-persons
817 married couples with children.
191 single-parent households (191 women).
99.4% of residents of 30725 zip code speak English at home.
0.5% of residents speak other Indo-European language at home (100% very well).
Foreign born population: 0 (0.0%)
:
0.0%
Whole state:
10.7%
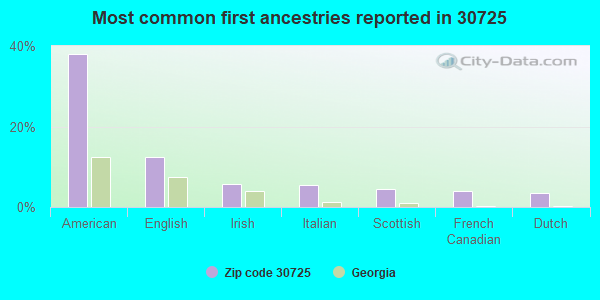
38%American
12%English
6%Irish
5%Italian
4%Scottish
4%French Canadian
3%Dutch
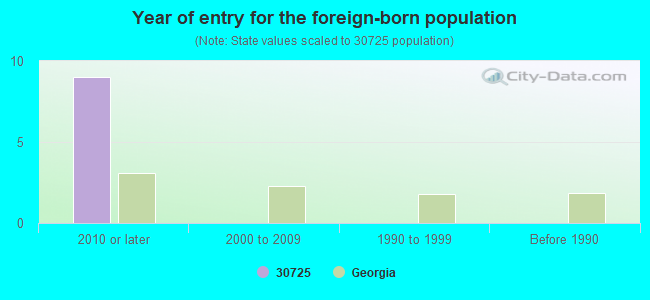
Year of entry for the foreign-born population
92010 or later
02000 to 2009
01990 to 1999
0Before 1990
Facilities with environmental interests located in this zip code:
CHATTANOOGA VALLEY MIDDLE SCHOOL (847 ALLGOOD ROAD in FLINTSTONE, GA)
STATE MASTER (Georgia's Geographic Environmental Information) - UST-1, UNDERGROUND STORAGE TANK PROGRAM (National Center for Education Statistics) - STATE ID-0290 Organizations: WALKER COUNTY BOARD OF EDUCATION (CONTACT/OPERATOR)
, ESTES EQUIP CO (INSTALLER)
, WALKER COUNTY (SCHOOL DISTRICT)
CHATTANOOGA VALLEY ELEMENTARY SCHOOL (3420 CHATTANOOGA VALLEY ROAD in FLINTSTONE, GA)
(National Center for Education Statistics) - STATE ID-4050 Organizations: WALKER COUNTY (SCHOOL DISTRICT)
Housing units lacking complete plumbing facilities: 5.9% Housing units lacking complete kitchen facilities: 3.9%
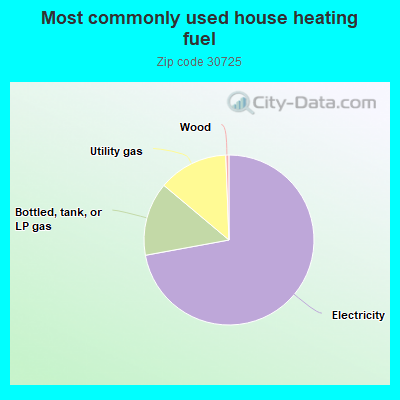
72.2%Electricity
14.0%Bottled, tank, or LP gas
13.3%Utility gas
0.6%Wood
Population in 1990: 2,775. Population change in the 1990s: +681 (+24.5%).
Place of birth for U.S.-born residents:
This state: 1,288
Northeast: 338
Midwest: 290
South: 3,026
West: 120
58% of the 30725 zip code residents lived in the same house 5 years ago. Out of people who lived in different houses, 52% lived in this county. Out of people who lived in different counties, 50% lived in Georgia.
96% of the 30725 zip code residents lived in the same house 1 year ago. Out of people who lived in different houses, 125% moved from different state.
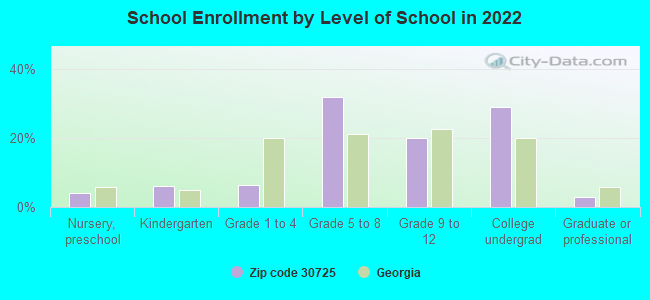
Private vs. public school enrollment:
Students in private schools in grades 1 to 8 (elementary and middle school): 68
Here:
11.8%
Georgia:
12.1%
Students in private schools in grades 9 to 12 (high school): 80
Here:
26.3%
Georgia:
10.8%
Students in private undergraduate colleges: 15
Here:
3.5%
Georgia:
17.1%
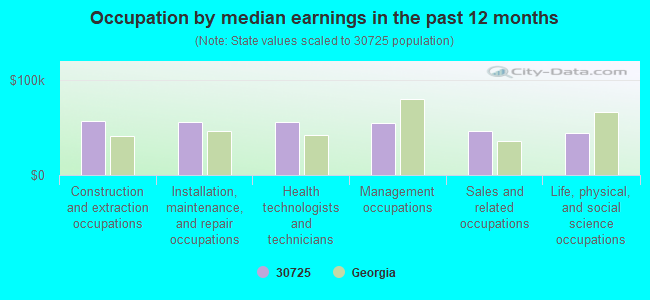
Occupation by median earnings in the past 12 months ($)
56,362Construction and extraction occupations
55,505Installation, maintenance, and repair occupations
55,289Health technologists and technicians
54,753Management occupations
45,950Sales and related occupations
44,370Life, physical, and social science occupations
Top industries in this zip code by the number of employees in 2005:
Other Services (except Public Administration): Religious Organizations (10-19 employees: 2 establishments, 5-9 employees: 1 establishment, 1-4 employees: 1 establishment)
Accommodation and Food Services: Full-Service Restaurants (5-9: 2, 1-4: 1)
Health Care and Social Assistance: Child Day Care Services (10-19: 1)
Construction: Commercial and Institutional Building Construction (10-19: 1)
Health Care and Social Assistance: Offices of Dentists (10-19: 1)
Accommodation and Food Services: Limited-Service Restaurants (10-19: 1)
Construction: Plumbing, Heating, and Air-Conditioning Contractors (5-9: 1, 1-4: 2)
Fatal accident statistics in 2013:
Fatal accident count: 1
Vehicles involved in fatal accidents: 2
Fatal accidents caused by drunken drivers: 0
Fatalities: 1
Persons involved in fatal accidents: 3
Pedestrians involved in fatal accidents: 0
Fatal accident statistics in 2011:
Fatal accident count: 1
Vehicles involved in fatal accidents: 2
Fatal accidents caused by drunken drivers: 0
Fatalities: 1
Persons involved in fatal accidents: 4
Pedestrians involved in fatal accidents: 0
Home Mortgage Disclosure Act Aggregated Statistics For Year 2009 (Based on 6 partial tracts)
A) FHA, FSA/RHS & VA Home Purchase Loans
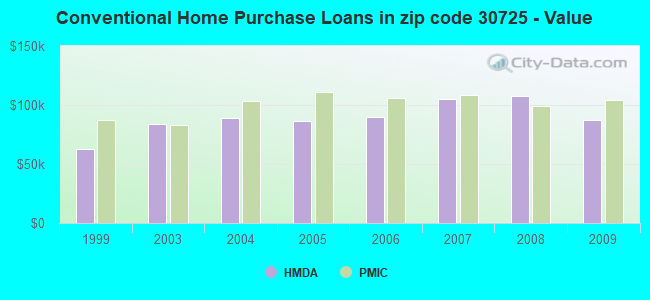
B) Conventional Home Purchase Loans
C) Refinancings
D) Home Improvement Loans
E) Loans on Dwellings For 5+ Families
F) Non-occupant Loans on < 5 Family Dwellings (A B C & D)
G) Loans On Manufactured Home Dwelling (A B C & D)
Number
Average Value
Number
Average Value
Number
Average Value
Number
Average Value
Number
Average Value
Number
Average Value
Number
Average Value
LOANS ORIGINATED
42
$110,005
31
$87,115
167
$114,104
11
$38,921
1
$594,590
47
$77,367
9
$40,409
APPLICATIONS APPROVED, NOT ACCEPTED
0
$0
2
$74,410
19
$122,667
1
$3,150
0
$0
1
$156,310
2
$54,000
APPLICATIONS DENIED
6
$118,338
6
$78,833
60
$120,108
13
$17,160
0
$0
4
$35,100
3
$53,790
APPLICATIONS WITHDRAWN
7
$87,710
3
$140,303
41
$122,625
0
$0
0
$0
5
$81,956
0
$0
FILES CLOSED FOR INCOMPLETENESS
1
$249,930
2
$46,400
10
$164,275
0
$0
0
$0
0
$0
0
$0
Aggregated Statistics For Year 2008 (Based on 6 partial tracts)
A) FHA, FSA/RHS & VA Home Purchase Loans
B) Conventional Home Purchase Loans
C) Refinancings
D) Home Improvement Loans
F) Non-occupant Loans on < 5 Family Dwellings (A B C & D)
G) Loans On Manufactured Home Dwelling (A B C & D)
Number
Average Value
Number
Average Value
Number
Average Value
Number
Average Value
Number
Average Value
Number
Average Value
LOANS ORIGINATED
43
$107,327
71
$107,695
156
$101,406
17
$18,598
52
$85,238
11
$64,138
APPLICATIONS APPROVED, NOT ACCEPTED
4
$86,935
6
$101,997
24
$103,398
3
$48,630
3
$60,647
4
$83,850
APPLICATIONS DENIED
8
$110,389
11
$84,604
104
$112,923
16
$43,342
10
$107,820
8
$72,261
APPLICATIONS WITHDRAWN
6
$92,395
4
$104,758
49
$111,260
3
$9,117
6
$96,103
1
$74,020
FILES CLOSED FOR INCOMPLETENESS
2
$72,965
2
$120,860
10
$112,618
1
$64,570
1
$110,270
0
$0
Aggregated Statistics For Year 2007 (Based on 6 partial tracts)
A) FHA, FSA/RHS & VA Home Purchase Loans
B) Conventional Home Purchase Loans
C) Refinancings
D) Home Improvement Loans
F) Non-occupant Loans on < 5 Family Dwellings (A B C & D)
G) Loans On Manufactured Home Dwelling (A B C & D)
Number
Average Value
Number
Average Value
Number
Average Value
Number
Average Value
Number
Average Value
Number
Average Value
LOANS ORIGINATED
27
$114,298
129
$105,085
187
$101,093
32
$28,897
44
$91,785
8
$51,152
APPLICATIONS APPROVED, NOT ACCEPTED
2
$76,380
21
$108,845
30
$112,267
2
$39,300
1
$79,730
2
$89,855
APPLICATIONS DENIED
10
$93,102
45
$105,114
136
$109,945
22
$24,450
9
$71,371
9
$69,642
APPLICATIONS WITHDRAWN
2
$97,545
18
$111,697
78
$108,080
3
$45,697
4
$126,062
2
$19,805
FILES CLOSED FOR INCOMPLETENESS
1
$82,300
8
$108,911
32
$113,752
1
$95,880
1
$116,200
0
$0
Aggregated Statistics For Year 2006 (Based on 6 partial tracts)
A) FHA, FSA/RHS & VA Home Purchase Loans
B) Conventional Home Purchase Loans
C) Refinancings
D) Home Improvement Loans
F) Non-occupant Loans on < 5 Family Dwellings (A B C & D)
G) Loans On Manufactured Home Dwelling (A B C & D)
Number
Average Value
Number
Average Value
Number
Average Value
Number
Average Value
Number
Average Value
Number
Average Value
LOANS ORIGINATED
31
$105,287
231
$89,870
207
$88,163
34
$38,579
41
$59,624
17
$51,171
APPLICATIONS APPROVED, NOT ACCEPTED
0
$0
28
$72,076
42
$112,999
4
$19,395
2
$94,880
9
$56,690
APPLICATIONS DENIED
11
$80,172
59
$82,629
161
$94,651
32
$33,237
16
$70,982
24
$48,653
APPLICATIONS WITHDRAWN
3
$92,193
23
$102,144
96
$96,760
6
$54,188
5
$73,524
2
$83,275
FILES CLOSED FOR INCOMPLETENESS
2
$133,480
6
$105,495
30
$102,619
0
$0
1
$78,740
0
$0
Aggregated Statistics For Year 2005 (Based on 6 partial tracts)
A) FHA, FSA/RHS & VA Home Purchase Loans
B) Conventional Home Purchase Loans
C) Refinancings
D) Home Improvement Loans
E) Loans on Dwellings For 5+ Families
F) Non-occupant Loans on < 5 Family Dwellings (A B C & D)
G) Loans On Manufactured Home Dwelling (A B C & D)
Number
Average Value
Number
Average Value
Number
Average Value
Number
Average Value
Number
Average Value
Number
Average Value
Number
Average Value
LOANS ORIGINATED
17
$103,888
239
$86,387
190
$85,694
37
$36,688
2
$718,850
58
$67,939
17
$56,795
APPLICATIONS APPROVED, NOT ACCEPTED
2
$97,140
36
$79,271
36
$103,653
7
$31,214
0
$0
6
$96,078
6
$52,765
APPLICATIONS DENIED
4
$51,612
65
$64,456
165
$91,304
34
$34,096
0
$0
15
$65,875
28
$45,726
APPLICATIONS WITHDRAWN
3
$103,497
24
$93,330
75
$98,354
10
$112,539
0
$0
3
$96,757
6
$78,912
FILES CLOSED FOR INCOMPLETENESS
0
$0
10
$92,855
27
$101,439
0
$0
0
$0
2
$93,270
0
$0
Aggregated Statistics For Year 2004 (Based on 6 partial tracts)
A) FHA, FSA/RHS & VA Home Purchase Loans
B) Conventional Home Purchase Loans
C) Refinancings
D) Home Improvement Loans
F) Non-occupant Loans on < 5 Family Dwellings (A B C & D)
G) Loans On Manufactured Home Dwelling (A B C & D)
Number
Average Value
Number
Average Value
Number
Average Value
Number
Average Value
Number
Average Value
Number
Average Value
LOANS ORIGINATED
22
$100,172
187
$89,140
206
$87,355
36
$35,536
49
$66,689
24
$55,294
APPLICATIONS APPROVED, NOT ACCEPTED
1
$128,350
34
$80,917
58
$89,219
7
$37,324
6
$109,800
12
$45,600
APPLICATIONS DENIED
6
$63,347
64
$73,067
129
$86,227
41
$25,333
21
$70,818
30
$46,475
APPLICATIONS WITHDRAWN
3
$85,873
17
$91,393
59
$87,632
10
$46,700
6
$82,103
3
$48,693
FILES CLOSED FOR INCOMPLETENESS
0
$0
9
$86,291
28
$102,994
4
$24,785
2
$72,835
1
$97,990
Aggregated Statistics For Year 2003 (Based on 6 partial tracts)
A) FHA, FSA/RHS & VA Home Purchase Loans
B) Conventional Home Purchase Loans
C) Refinancings
D) Home Improvement Loans
E) Loans on Dwellings For 5+ Families
F) Non-occupant Loans on < 5 Family Dwellings (A B C & D)
Number
Average Value
Number
Average Value
Number
Average Value
Number
Average Value
Number
Average Value
Number
Average Value
LOANS ORIGINATED
21
$80,180
139
$84,074
283
$79,291
33
$33,426
1
$216,290
34
$51,450
APPLICATIONS APPROVED, NOT ACCEPTED
2
$101,970
18
$78,375
36
$85,957
5
$50,630
0
$0
2
$30,895
APPLICATIONS DENIED
7
$95,263
44
$81,901
113
$77,709
27
$24,330
0
$0
13
$72,810
APPLICATIONS WITHDRAWN
2
$129,775
13
$89,401
54
$74,515
2
$65,240
0
$0
2
$116,155
FILES CLOSED FOR INCOMPLETENESS
0
$0
6
$51,488
10
$86,091
4
$30,328
0
$0
0
$0
Aggregated Statistics For Year 1999 (Based on 2 partial tracts)
A) FHA, FSA/RHS & VA Home Purchase Loans
B) Conventional Home Purchase Loans
C) Refinancings
D) Home Improvement Loans
F) Non-occupant Loans on < 5 Family Dwellings (A B C & D)
2002 - 2018 National Fire Incident Reporting System (NFIRS) incidents
Based on the data from the years 2002 - 2018 the average number of fire incidents per year is 21. The highest number of reported fire incidents - 37 took place in 2004, and the least - 9 in 2005. The data has a declining trend.
When looking into fire subcategories, the most incidents belonged to: Outside Fires (44.3%), and Structure Fires (36.9%).
Fire incident types reported to NFIRS in Zip Code 30725


 Nearest zip codes: 30750, 37350, 30741, 37410, 30757, 37409.


 Based on the data from the years 2002 - 2018 the average number of fire incidents per year is 21. The highest number of reported fire incidents - 37 took place in 2004, and the least - 9 in 2005. The data has a declining trend.
 When looking into fire subcategories, the most incidents belonged to: Outside Fires (44.3%), and Structure Fires (36.9%).