Estimated zip code population in 2022: 4,595 Zip code population in 2010: 4,125 Zip code population in 2000: 4,038
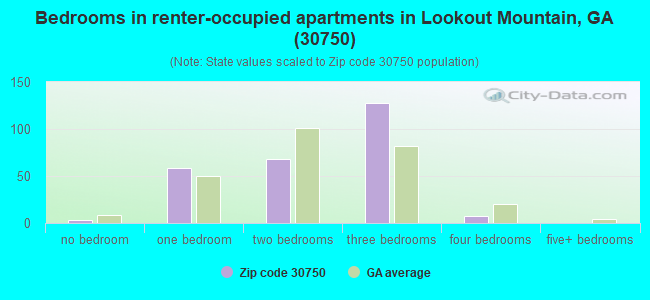
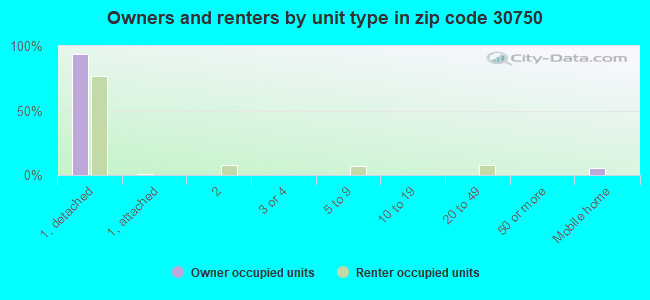
Houses and condos: 1,523 Renter-occupied apartments: 263
% of renters here:
19%
State:
34%
March 2022 cost of living index in zip code 30750: 88.4 (less than average, U.S. average is 100)
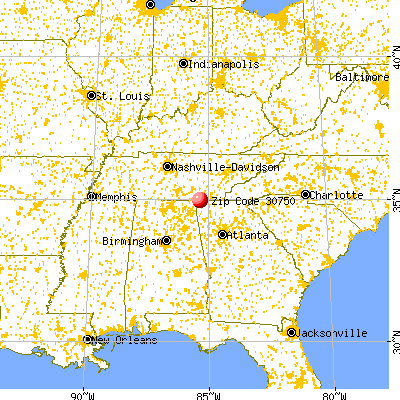
Land area: 13.2 sq. mi. Water area: 0.0 sq. mi.
Population density: 348 people per square mile
(very low).
OSM Map
General Map
Google Map
MSN Map
OSM Map
General Map
Google Map
MSN Map
OSM Map
General Map
Google Map
MSN Map
OSM Map
General Map
Google Map
MSN Map
Please wait while loading the map...
Real estate property taxes paid for housing units in 2022:
This zip code:
0.7% ($2,576)
Georgia:
0.7% ($2,160)
Median real estate property taxes paid for housing units with mortgages in 2022: $2,084 (0.5%) Median real estate property taxes paid for housing units with no mortgage in 2022: $3,010 (0.7%)
Business Search- 14 Million verified businesses
Males: 2,192
(47.7%)
Females: 2,402
(52.3%)
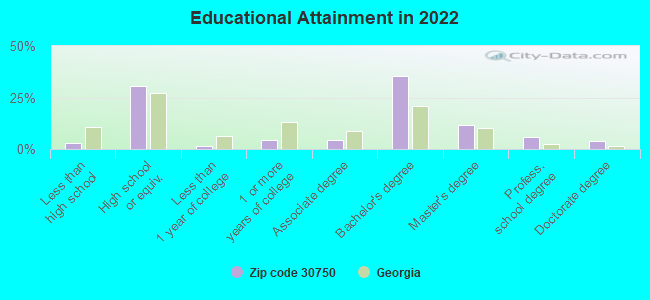
For population 25 years and over in 30750:
High school or higher: 97.8%
Bachelor's degree or higher: 57.2%
Graduate or professional degree: 21.7%
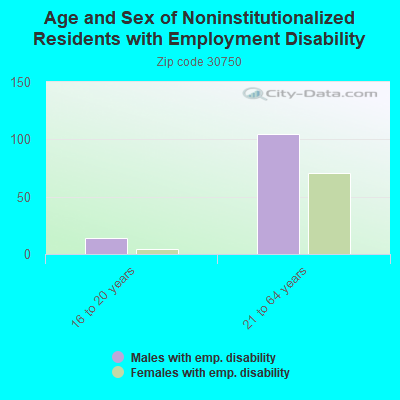
Unemployed: 4.6%
Mean travel time to work (commute): 19.6 minutes
For population 15 years and over in 30750:
Never married: 38.8%
Now married: 52.9%
Separated: 0.4%
Widowed: 3.3%
Divorced: 4.6%
Zip code 30750 compared to state average:
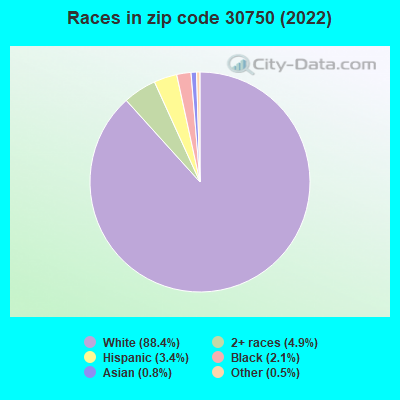
Black race population percentage significantly below state average.
Hispanic race population percentage significantly below state average.
Median age significantly below state average.
Foreign-born population percentage significantly below state average.
Renting percentage below state average.
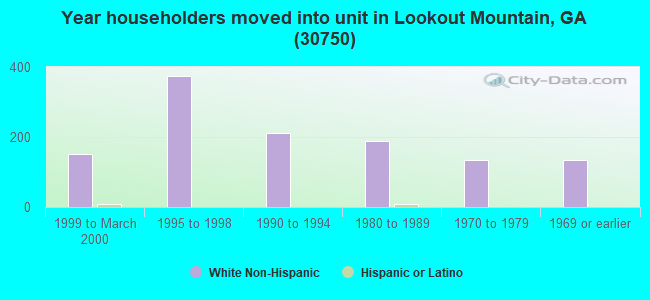
Length of stay since moving in significantly above state average.
House age above state average.
Number of college students significantly above state average.
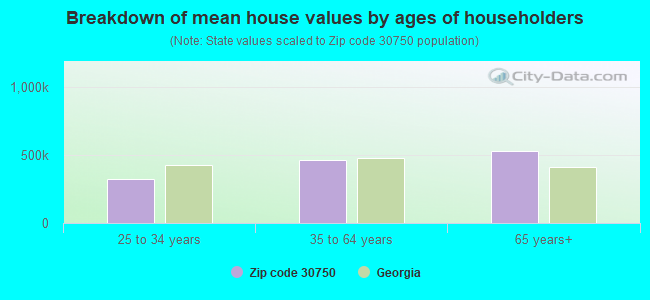
Estimated median house/condo value in 2022: $395,606
30750:
$395,606
Georgia:
$297,400
According to our research of Georgia and other state lists, there were 8 registered sex offenders living in 30750 zip code as of May 28, 2024. The ratio of all residents to sex offenders in zip code 30750 is 622 to 1. The ratio of registered sex offenders to all residents in this zip code is lower than the state average.
Median resident age:
This zip code:
28.7 years
Georgia median age:
37.6 years
Average household size:
This zip code:
2.6 people
Georgia:
2.6 people
Averages for the 2020 tax year for zip code 30750, filed in 2021:
Average Adjusted Gross Income (AGI) in 2020: $107,350 (Individual Income Tax Returns)
Here:
$107,350
State:
$70,847
Salary/wage: $74,236 (reported on 74.1% of returns)
Here:
$74,236
State:
$59,126
(% of AGI for various income ranges: 1013.3% for AGIs below $25k, 3490.0% for AGIs $25k-50k, 5535.8% for AGIs $50k-75k, 8856.2% for AGIs $75k-100k, 17580.8% for AGIs $100k-200k, 66546.0% for AGIs over 200k)
Taxable interest for individuals: $2,774 (reported on 43.9% of returns)
This zip code:
$2,774
Georgia:
$2,011
(% of AGI for various income ranges: 33.3% for AGIs below $25k, 72.4% for AGIs $25k-50k, 59.2% for AGIs $50k-75k, 103.8% for AGIs $75k-100k, 359.2% for AGIs $100k-200k, 1808.0% for AGIs over 200k)
Ordinary dividends: $15,418 (reported on 39.6% of returns)
Here:
$15,418
State:
$8,996
(% of AGI for various income ranges: 82.9% for AGIs below $25k, 235.3% for AGIs $25k-50k, 486.7% for AGIs $50k-75k, 467.5% for AGIs $75k-100k, 1585.0% for AGIs $100k-200k, 10042.0% for AGIs over 200k)
Net capital gain/loss in AGI: +$27,214 (reported on 36.7% of returns)
Here:
+$27,214
State:
+$28,402
(% of AGI for various income ranges: 86.7% for AGIs below $25k, 119.4% for AGIs $25k-50k, 240.0% for AGIs $50k-75k, 315.0% for AGIs $75k-100k, 1577.5% for AGIs $100k-200k, 22070.0% for AGIs over 200k)
Profit/loss from business: +$24,674 (reported on 27.3% of returns)
Here:
+$24,674
State:
+$6,707
(% of AGI for various income ranges: 281.7% for AGIs below $25k, 268.8% for AGIs $25k-50k, 631.7% for AGIs $50k-75k, 1260.0% for AGIs $75k-100k, 2140.8% for AGIs $100k-200k, 7816.0% for AGIs over 200k)
Taxable individual retirement arrangement distribution: $33,475 (reported on 14.4% of returns)
30750:
$33,475
Georgia:
$20,525
(% of AGI for various income ranges: 284.7% for AGIs $25k-50k, 515.0% for AGIs $50k-75k, 788.8% for AGIs $75k-100k, 1508.3% for AGIs $100k-200k, 6304.0% for AGIs over 200k)
Self-employed (Keogh) retirement plans: $24,950 (reported on 1.4% of returns)
30750:
$24,950
Georgia:
$27,751
(% of AGI for various income ranges: 415.8% for AGIs $100k-200k)
Total itemized deductions: $46,704 (reported on 18.0% of returns)
Here:
$46,704
State:
$34,001
(% of AGI for various income ranges: 209.6% for AGIs below $25k, 516.7% for AGIs $50k-75k, 713.8% for AGIs $75k-100k, 2627.5% for AGIs $100k-200k, 13658.0% for AGIs over 200k)
Charity contributions: $22,554 (reported on 17.3% of returns)
Here:
$22,554
State:
$14,164
(% of AGI for various income ranges: 307.5% for AGIs $50k-75k, 955.0% for AGIs $100k-200k, 7796.0% for AGIs over 200k)
Taxes paid: $8,296 (reported on 18.0% of returns)
30750:
$8,296
State:
$7,540
(% of AGI for various income ranges: 38.3% for AGIs below $25k, 97.5% for AGIs $50k-75k, 143.8% for AGIs $75k-100k, 581.7% for AGIs $100k-200k, 2104.0% for AGIs over 200k)
Earned income credit: $2,067 (reported on 8.6% of returns)
Here:
$2,067
State:
$2,530
(% of AGI for various income ranges: 58.3% for AGIs below $25k, 63.5% for AGIs $25k-50k)
Percentage of individuals using paid preparers for their 2020 taxes: 93.5%
Here:
94%
State:
93%
(% for various income ranges: 90.2% for AGIs below $25k, 91.7% for AGIs $25k-50k, 94.4% for AGIs $50k-75k, 100.0% for AGIs $75k-100k, 96.2% for AGIs $100k-200k, 94.1% for AGIs over 200k)
Averages for the 2012 tax year for zip code 30750, filed in 2013:
Average Adjusted Gross Income (AGI) in 2012: $92,572 (Individual Income Tax Returns)
Here:
$92,572
State:
$56,131
Salary/wage: $66,672 (reported on 78.5% of returns)
Here:
$66,672
State:
$47,942
(% of AGI for various income ranges: 66.8% for AGIs below $25k, 71.6% for AGIs $25k-50k, 68.9% for AGIs $50k-75k, 71.1% for AGIs $75k-100k, 62.2% for AGIs $100k-200k, 46.6% for AGIs over 200k)
Taxable interest for individuals: $2,800 (reported on 41.5% of returns)
This zip code:
$2,800
Georgia:
$1,706
(% of AGI for various income ranges: 1.6% for AGIs below $25k, 0.6% for AGIs $25k-50k, 1.0% for AGIs $50k-75k, 1.4% for AGIs $75k-100k, 1.6% for AGIs $100k-200k, 1.2% for AGIs over 200k)
Ordinary dividends: $11,852 (reported on 36.9% of returns)
Here:
$11,852
State:
$7,265
(% of AGI for various income ranges: 5.4% for AGIs below $25k, 4.8% for AGIs $25k-50k, 4.0% for AGIs $50k-75k, 4.0% for AGIs $75k-100k, 5.2% for AGIs $100k-200k, 4.7% for AGIs over 200k)
Net capital gain/loss in AGI: +$16,041 (reported on 30.0% of returns)
Here:
+$16,041
State:
+$16,323
(% of AGI for various income ranges: 0.7% for AGIs below $25k, 0.4% for AGIs $25k-50k, 0.5% for AGIs $75k-100k, 3.4% for AGIs $100k-200k, 8.6% for AGIs over 200k)
Profit/loss from business: +$26,557 (reported on 26.9% of returns)
Here:
+$26,557
State:
+$7,583
(% of AGI for various income ranges: 15.7% for AGIs below $25k, 10.9% for AGIs $25k-50k, 4.1% for AGIs $50k-75k, 4.4% for AGIs $75k-100k, 9.6% for AGIs $100k-200k, 6.9% for AGIs over 200k)
Taxable individual retirement arrangement distribution: $20,753 (reported on 13.1% of returns)
30750:
$20,753
Georgia:
$17,199
(% of AGI for various income ranges: 4.0% for AGIs below $25k, 4.5% for AGIs $25k-50k, 8.3% for AGIs $50k-75k, 4.3% for AGIs $100k-200k, 1.6% for AGIs over 200k)
Self-employment retirement plans: $21,067 (reported on 2.3% of returns)
30750:
$21,067
Georgia:
$23,277
Total itemized deductions: $32,443 (18% of AGI, reported on 43.1% of returns)
Here:
$32,443
State:
$23,886
Here:
18.2% of AGI
State:
21.5% of AGI
(% of AGI for various income ranges: 12.3% for AGIs below $25k, 12.5% for AGIs $25k-50k, 13.5% for AGIs $50k-75k, 19.3% for AGIs $75k-100k, 19.0% for AGIs $100k-200k, 13.7% for AGIs over 200k)
Charity contributions: $9,739 (reported on 39.2% of returns)
Here:
$9,739
State:
$5,507
(% of AGI for various income ranges: 1.3% for AGIs below $25k, 2.9% for AGIs $25k-50k, 3.8% for AGIs $50k-75k, 4.5% for AGIs $75k-100k, 5.2% for AGIs $100k-200k, 4.1% for AGIs over 200k)
Taxes paid: $11,482 (reported on 43.1% of returns)
30750:
$11,482
State:
$7,838
(% of AGI for various income ranges: 2.0% for AGIs below $25k, 2.4% for AGIs $25k-50k, 3.5% for AGIs $50k-75k, 6.2% for AGIs $75k-100k, 6.6% for AGIs $100k-200k, 5.7% for AGIs over 200k)
Earned income credit: $2,181 (reported on 12.3% of returns)
Here:
$2,181
State:
$2,589
(% of AGI for various income ranges: 5.7% for AGIs below $25k, 0.8% for AGIs $25k-50k)
Percentage of individuals using paid preparers for their 2012 taxes: 54.6%
Here:
55%
State:
55%
(% for various income ranges: 50.0% for AGIs below $25k, 48.0% for AGIs $25k-50k, 47.1% for AGIs $50k-75k, 54.5% for AGIs $75k-100k, 68.4% for AGIs $100k-200k, 75.0% for AGIs over 200k)
Averages for the 2004 tax year for zip code 30750, filed in 2005:
Average Adjusted Gross Income (AGI) in 2004: $68,302 (Individual Income Tax Returns)
Here:
$68,302
State:
$47,553
Salary/wage: $52,107 (reported on 78.6% of returns)
Here:
$52,107
State:
$42,178
(% of AGI for various income ranges: 95.7% for AGIs below $10k, 72.4% for AGIs $10k-25k, 76.2% for AGIs $25k-50k, 72.1% for AGIs $50k-75k, 71.7% for AGIs $75k-100k, 51.7% for AGIs over 100k)
Taxable interest for individuals: $2,534 (reported on 52.6% of returns)
This zip code:
$2,534
Georgia:
$1,772
(% of AGI for various income ranges: 4.4% for AGIs below $10k, 1.7% for AGIs $10k-25k, 1.6% for AGIs $25k-50k, 1.6% for AGIs $50k-75k, 1.4% for AGIs $75k-100k, 2.1% for AGIs over 100k)
Taxable dividends: $9,020 (reported on 43.4% of returns)
Here:
$9,020
State:
$4,283
(% of AGI for various income ranges: 19.0% for AGIs below $10k, 3.3% for AGIs $10k-25k, 4.5% for AGIs $25k-50k, 4.0% for AGIs $50k-75k, 3.8% for AGIs $75k-100k, 6.4% for AGIs over 100k)
Net capital gain/loss: +$16,141 (reported on 35.7% of returns)
Here:
+$16,141
State:
+$16,461
(% of AGI for various income ranges: -3.2% for AGIs below $10k, 4.4% for AGIs $10k-25k, 2.8% for AGIs $25k-50k, 1.9% for AGIs $50k-75k, 5.3% for AGIs $75k-100k, 11.5% for AGIs over 100k)
Profit/loss from business: +$15,841 (reported on 22.8% of returns)
Here:
+$15,841
State:
+$8,201
(% of AGI for various income ranges: 17.6% for AGIs below $10k, 10.4% for AGIs $10k-25k, 4.2% for AGIs $25k-50k, 7.0% for AGIs $50k-75k, 2.9% for AGIs $75k-100k, 4.9% for AGIs over 100k)
IRA payment deduction: $3,227 (reported on 3.3% of returns)
30750:
$3,227
Georgia:
$2,969
Self-employed pension: $15,952 (reported on 1.6% of returns)
Here:
$15,952
Georgia:
$16,203
Total itemized deductions: $25,419 (20% of AGI, reported on 44.1% of returns)
Here:
$25,419
State:
$19,944
Here:
20.3% of AGI
State:
22.6% of AGI
(% of AGI for various income ranges: 20.0% for AGIs below $10k, 11.9% for AGIs $10k-25k, 17.6% for AGIs $25k-50k, 19.6% for AGIs $50k-75k, 19.5% for AGIs $75k-100k, 15.4% for AGIs over 100k)
Charity contributions deductions: $7,533 (6% of AGI, reported on 40.2% of returns)
Here:
$7,533
State:
$4,354
Here:
5.6% of AGI
State:
4.7% of AGI
(% of AGI for various income ranges: 1.6% for AGIs below $10k, 1.6% for AGIs $10k-25k, 3.4% for AGIs $25k-50k, 5.2% for AGIs $50k-75k, 5.2% for AGIs $75k-100k, 4.6% for AGIs over 100k)
Total tax: $12,800 (reported on 76.3% of returns)
30750:
$12,800
State:
$8,223
(% of AGI for various income ranges: 4.8% for AGIs below $10k, 4.8% for AGIs $10k-25k, 6.3% for AGIs $25k-50k, 8.7% for AGIs $50k-75k, 9.4% for AGIs $75k-100k, 18.2% for AGIs over 100k)
Earned income credit: $1,801 (reported on 10.1% of returns)
Here:
$1,801
State:
$1,986
Percentage of individuals using paid preparers for their 2004 taxes: 60.2%
Here:
60%
State:
62%
(% for various income ranges: 51.7% for AGIs below $10k, 55.9% for AGIs $10k-25k, 62.9% for AGIs $25k-50k, 54.9% for AGIs $50k-75k, 59.0% for AGIs $75k-100k, 77.5% for AGIs over 100k)
Household received Food Stamps/SNAP in the past 12 months: 33 Household did not receive Food Stamps/SNAP in the past 12 months: 1,317
Women who had a birth in the past 12 months: 39 (39 now married, 0 unmarried) Women who did not have a birth in the past 12 months: 1,412 (560 now married, 851 unmarried)
Housing units in zip code 30750 with a mortgage: 713 (190 second mortgage, 7 home equity loan, 193 both second mortgage and home equity loan) Houses without a mortgage: 11
Median monthly owner costs for units with a mortgage: $2,287 Median monthly owner costs for units without a mortgage: $682
Residents with income below the poverty level in 2022:
This zip code:
1.7%
Whole state:
12.7%
Residents with income below 50% of the poverty level in 2022:
This zip code:
0.8%
Whole state:
6.3%
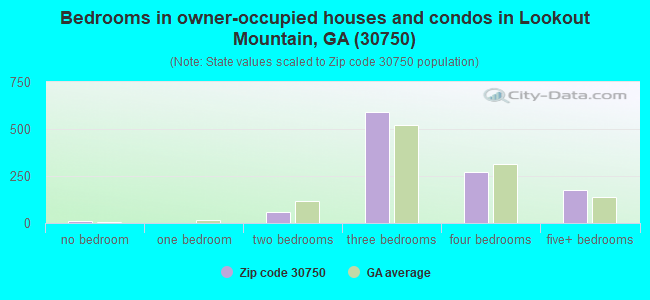
Median number of rooms in houses and condos:
Here:
7.5
State:
6.8
Median number of rooms in apartments:
Here:
4.9
State:
4.6
Notable locations in this zip code not listed on our city pages
Notable locations in zip code 30750: Rock City Gardens (A), Lookout Mountain Golf Club (B), Lookout Mountain City Hall (C), Walker County Emergency Services Station 4 Hinkle (D), Lookout Mountain Fire Department (E), West Brow Fire Department (F). Display/hide their locations on the map
Churches in zip code 30750 include: Hinkles Church (A), Griffin Church (B), West Brow Church (C), Mount Olive Church (D), West Brow Chapel (E), Payne Chapel (F), Our Lady of the Mountain Church (G), Lookout Mountain United Methodist Church (H). Display/hide their locations on the map
In group quarters: 1,053 (-1 institutionalized population)
Size of family households: 558 2-persons, 187 3-persons, 252 4-persons, 118 5-persons, 25 6-persons
Size of nonfamily households: 211 1-person, 6 2-persons
647 married couples with children.
117 single-parent households (90 men, 27 women).
95.3% of residents of 30750 zip code speak English at home.
2.6% of residents speak Spanish at home (59% very well, 32% well, 10% not well).
0.8% of residents speak other Indo-European language at home (100% very well).
0.4% of residents speak Asian or Pacific Island language at home (100% very well).
0.3% of residents speak other language at home (42% very well, 58% well).
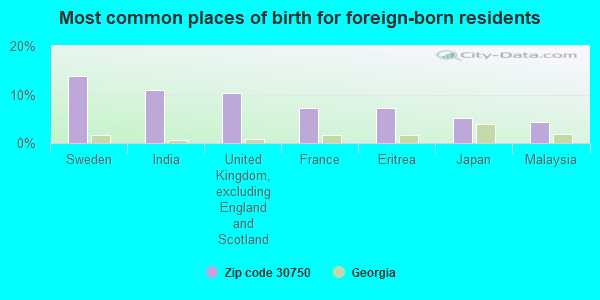
Foreign born population: 140 (3.1%) (71.7% of them are naturalized citizens)
This zip code:
3.1%
Whole state:
10.7%
14%Sweden
11%India
10%United Kingdom, excluding England and Scotland
7%France
7%Eritrea
5%Japan
4%Malaysia
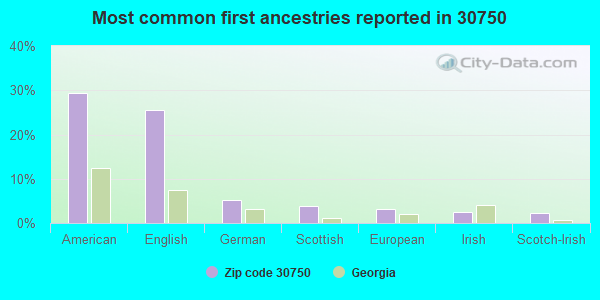
29%American
26%English
5%German
4%Scottish
3%European
3%Irish
2%Scotch-Irish
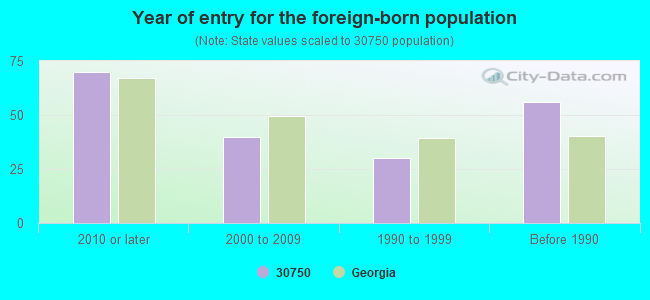
Year of entry for the foreign-born population
702010 or later
402000 to 2009
301990 to 1999
56Before 1990
Facilities with environmental interests located in this zip code:
FAIRYLAND ELEMENTARY SCHOOL (1306 LULA LAKE ROAD in LOOKOUT MOUNTAIN, GA)
(Geographic Names Information System) (National Center for Education Statistics) - STATE ID-2052 Organizations: WALKER COUNTY (SCHOOL DISTRICT)
Housing units lacking complete plumbing facilities: 2.2% Housing units lacking complete kitchen facilities: 3.4%
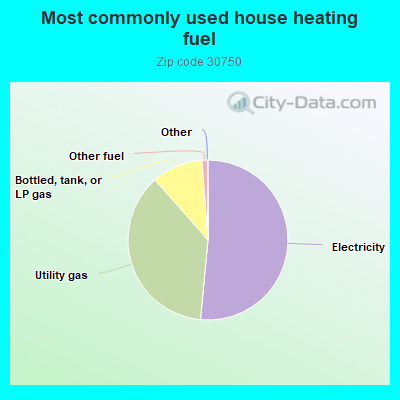
51.5%Electricity
37.0%Utility gas
10.3%Bottled, tank, or LP gas
1.1%Other fuel
Population in 1990: 2,818. Population change in the 1990s: +1,220 (+43.3%).
Place of birth for U.S.-born residents:
This state: 1,029
Northeast: 283
Midwest: 353
South: 2,595
West: 175
53% of the 30750 zip code residents lived in the same house 5 years ago. Out of people who lived in different houses, 18% lived in this county. Out of people who lived in different counties, 50% lived in Georgia.
92% of the 30750 zip code residents lived in the same house 1 year ago. Out of people who lived in different houses, 18% moved from this county. Out of people who lived in different houses, 20% moved from different county within same state. Out of people who lived in different houses, 62% moved from different state. Out of people who lived in different houses, 9% moved from abroad.
Private vs. public school enrollment:
Students in private schools in grades 1 to 8 (elementary and middle school): 87
Here:
25.6%
Georgia:
12.1%
Students in private schools in grades 9 to 12 (high school): 134
Here:
76.9%
Georgia:
10.8%
Students in private undergraduate colleges: 884
Here:
75.6%
Georgia:
17.1%
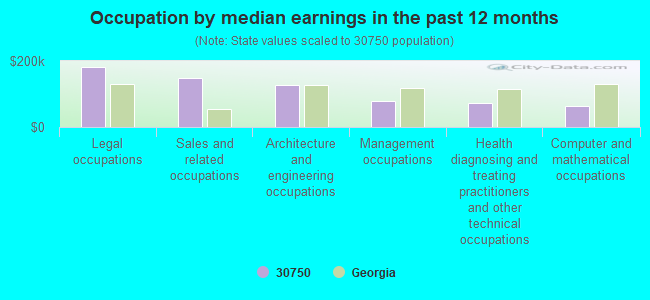
Occupation by median earnings in the past 12 months ($)
180,904Legal occupations
149,737Sales and related occupations
127,705Architecture and engineering occupations
79,609Management occupations
73,899Health diagnosing and treating practitioners and other technical occupations
63,670Computer and mathematical occupations
Top industries in this zip code by the number of employees in 2005:
Educational Services: Colleges, Universities, and Professional Schools (500-999 employees: 1 establishment)
Arts, Entertainment, and Recreation: Nature Parks and Other Similar Institutions (100-249: 1)
Accommodation and Food Services: Food Service Contractors (50-99: 1)
Arts, Entertainment, and Recreation: Golf Courses and Country Clubs (20-49: 2)
Construction: Poured Concrete Foundation and Structure Contractors (10-19: 1)
Construction: New Single-Family Housing Construction (except Operative Builders) (10-19: 1)
Accommodation and Food Services: Hotels (except Casino Hotels) and Motels (10-19: 1)
People in group quarters in 2010:
780 people in college/university student housing
2 people in workers' group living quarters and job corps centers
People in group quarters in 2000:
623 people in college dormitories (includes college quarters off campus)
Home Mortgage Disclosure Act Aggregated Statistics For Year 2009 (Based on 2 partial tracts)
A) FHA, FSA/RHS & VA Home Purchase Loans
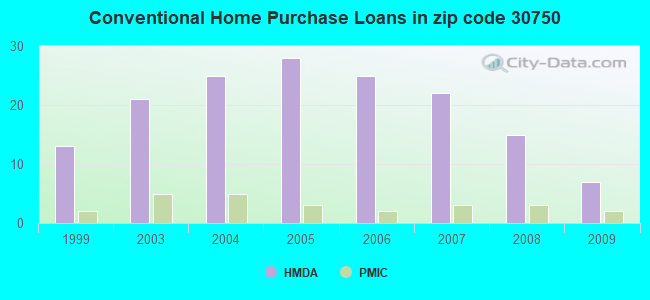
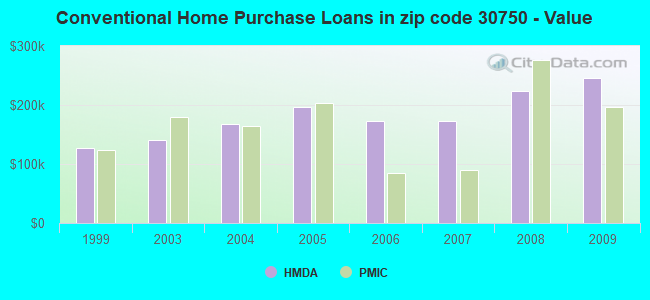
B) Conventional Home Purchase Loans
C) Refinancings
D) Home Improvement Loans
F) Non-occupant Loans on < 5 Family Dwellings (A B C & D)
G) Loans On Manufactured Home Dwelling (A B C & D)
Number
Average Value
Number
Average Value
Number
Average Value
Number
Average Value
Number
Average Value
Number
Average Value
LOANS ORIGINATED
3
$148,847
7
$246,313
39
$214,595
1
$228,970
3
$143,230
1
$25,770
APPLICATIONS APPROVED, NOT ACCEPTED
0
$0
0
$0
0
$0
0
$0
0
$0
0
$0
APPLICATIONS DENIED
0
$0
1
$148,680
12
$226,117
0
$0
0
$0
0
$0
APPLICATIONS WITHDRAWN
0
$0
2
$246,560
4
$360,550
0
$0
0
$0
0
$0
FILES CLOSED FOR INCOMPLETENESS
0
$0
0
$0
1
$369,220
0
$0
0
$0
0
$0
Aggregated Statistics For Year 2008 (Based on 2 partial tracts)
A) FHA, FSA/RHS & VA Home Purchase Loans
B) Conventional Home Purchase Loans
C) Refinancings
D) Home Improvement Loans
F) Non-occupant Loans on < 5 Family Dwellings (A B C & D)
G) Loans On Manufactured Home Dwelling (A B C & D)
Number
Average Value
Number
Average Value
Number
Average Value
Number
Average Value
Number
Average Value
Number
Average Value
LOANS ORIGINATED
1
$106,060
15
$223,053
18
$162,061
2
$24,780
5
$159,880
1
$8,920
APPLICATIONS APPROVED, NOT ACCEPTED
0
$0
0
$0
1
$394,500
0
$0
0
$0
0
$0
APPLICATIONS DENIED
0
$0
2
$187,335
4
$391,772
1
$15,860
1
$47,080
1
$54,020
APPLICATIONS WITHDRAWN
0
$0
2
$493,370
3
$298,680
0
$0
0
$0
0
$0
FILES CLOSED FOR INCOMPLETENESS
0
$0
0
$0
2
$183,870
0
$0
0
$0
0
$0
Aggregated Statistics For Year 2007 (Based on 2 partial tracts)
B) Conventional Home Purchase Loans
C) Refinancings
D) Home Improvement Loans
F) Non-occupant Loans on < 5 Family Dwellings (A B C & D)
Number
Average Value
Number
Average Value
Number
Average Value
Number
Average Value
LOANS ORIGINATED
22
$172,897
29
$182,483
3
$135,463
5
$180,200
APPLICATIONS APPROVED, NOT ACCEPTED
3
$396,647
6
$186,263
0
$0
1
$158,100
APPLICATIONS DENIED
3
$117,127
14
$200,859
4
$86,605
2
$114,730
APPLICATIONS WITHDRAWN
3
$254,903
4
$260,315
0
$0
0
$0
FILES CLOSED FOR INCOMPLETENESS
1
$434,640
2
$183,620
1
$153,640
0
$0
Aggregated Statistics For Year 2006 (Based on 2 partial tracts)
B) Conventional Home Purchase Loans
C) Refinancings
D) Home Improvement Loans
F) Non-occupant Loans on < 5 Family Dwellings (A B C & D)
G) Loans On Manufactured Home Dwelling (A B C & D)
Number
Average Value
Number
Average Value
Number
Average Value
Number
Average Value
Number
Average Value
LOANS ORIGINATED
25
$173,143
26
$150,453
2
$27,755
5
$128,162
1
$42,620
APPLICATIONS APPROVED, NOT ACCEPTED
6
$118,118
3
$269,110
0
$0
1
$139,260
0
$0
APPLICATIONS DENIED
9
$144,660
18
$163,493
1
$66,910
2
$51,045
2
$67,155
APPLICATIONS WITHDRAWN
2
$216,330
9
$242,238
0
$0
1
$320,160
0
$0
FILES CLOSED FOR INCOMPLETENESS
2
$138,025
4
$220,790
0
$0
0
$0
0
$0
Aggregated Statistics For Year 2005 (Based on 2 partial tracts)
B) Conventional Home Purchase Loans
C) Refinancings
D) Home Improvement Loans
F) Non-occupant Loans on < 5 Family Dwellings (A B C & D)
G) Loans On Manufactured Home Dwelling (A B C & D)
Number
Average Value
Number
Average Value
Number
Average Value
Number
Average Value
Number
Average Value
LOANS ORIGINATED
28
$196,470
35
$162,982
3
$43,943
6
$121,257
1
$60,960
APPLICATIONS APPROVED, NOT ACCEPTED
2
$223,765
6
$121,175
0
$0
0
$0
0
$0
APPLICATIONS DENIED
10
$89,505
11
$219,461
4
$58,480
2
$143,970
2
$43,860
APPLICATIONS WITHDRAWN
3
$106,060
10
$190,459
0
$0
0
$0
0
$0
FILES CLOSED FOR INCOMPLETENESS
0
$0
2
$119,440
0
$0
0
$0
0
$0
Aggregated Statistics For Year 2004 (Based on 2 partial tracts)
B) Conventional Home Purchase Loans
C) Refinancings
D) Home Improvement Loans
F) Non-occupant Loans on < 5 Family Dwellings (A B C & D)
G) Loans On Manufactured Home Dwelling (A B C & D)
Number
Average Value
Number
Average Value
Number
Average Value
Number
Average Value
Number
Average Value
LOANS ORIGINATED
25
$167,414
35
$163,151
5
$87,820
7
$115,616
0
$0
APPLICATIONS APPROVED, NOT ACCEPTED
2
$162,310
7
$168,716
1
$14,870
0
$0
0
$0
APPLICATIONS DENIED
4
$158,715
11
$128,315
1
$8,430
1
$223,520
2
$46,090
APPLICATIONS WITHDRAWN
1
$121,920
7
$165,601
0
$0
1
$230,450
0
$0
FILES CLOSED FOR INCOMPLETENESS
0
$0
5
$113,196
0
$0
0
$0
0
$0
Aggregated Statistics For Year 2003 (Based on 2 partial tracts)
A) FHA, FSA/RHS & VA Home Purchase Loans
B) Conventional Home Purchase Loans
C) Refinancings
D) Home Improvement Loans
F) Non-occupant Loans on < 5 Family Dwellings (A B C & D)
Number
Average Value
Number
Average Value
Number
Average Value
Number
Average Value
Number
Average Value
LOANS ORIGINATED
0
$0
21
$141,317
60
$159,451
3
$31,720
6
$74,588
APPLICATIONS APPROVED, NOT ACCEPTED
0
$0
1
$209,640
2
$137,280
1
$34,690
0
$0
APPLICATIONS DENIED
1
$90,200
2
$85,245
7
$112,289
2
$27,505
1
$44,600
APPLICATIONS WITHDRAWN
0
$0
2
$173,955
8
$196,505
1
$43,120
0
$0
FILES CLOSED FOR INCOMPLETENESS
0
$0
0
$0
1
$130,840
0
$0
0
$0
Aggregated Statistics For Year 1999 (Based on 1 partial tract)
B) Conventional Home Purchase Loans
C) Refinancings
D) Home Improvement Loans
F) Non-occupant Loans on < 5 Family Dwellings (A B C & D)
Detailed PMIC statistics for the following Tracts:0204.00
2002 - 2018 National Fire Incident Reporting System (NFIRS) incidents
According to the data from the years 2002 - 2018 the average number of fires per year is 10. The highest number of reported fires - 30 took place in 2007, and the least - 3 in 2005. The data has a growing trend.
When looking into fire subcategories, the most reports belonged to: Outside Fires (46.6%), and Structure Fires (38.7%).
Fire incident types reported to NFIRS in Zip Code 30750


 Nearest zip codes: 30725, 30757, 37350, 37409, 37410, 37419.
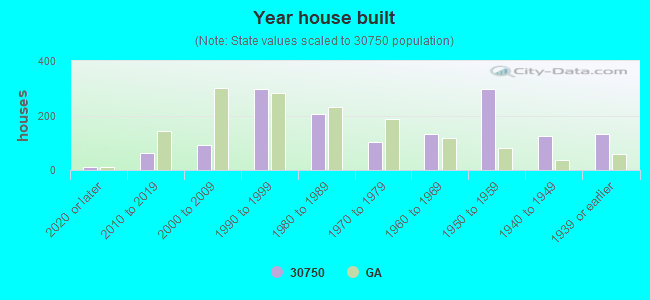


 According to the data from the years 2002 - 2018 the average number of fires per year is 10. The highest number of reported fires - 30 took place in 2007, and the least - 3 in 2005. The data has a growing trend.
 When looking into fire subcategories, the most reports belonged to: Outside Fires (46.6%), and Structure Fires (38.7%).