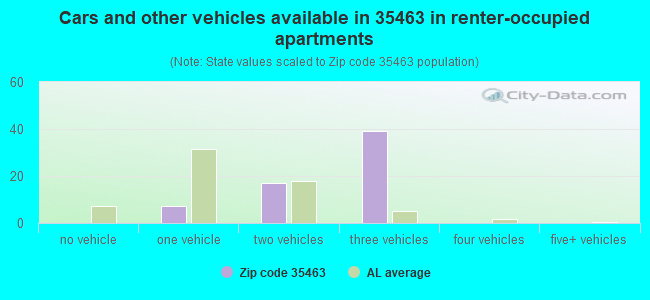
Estimated zip code population in 2022: 2,149 Zip code population in 2010: 1,749 Zip code population in 2000: 1,372
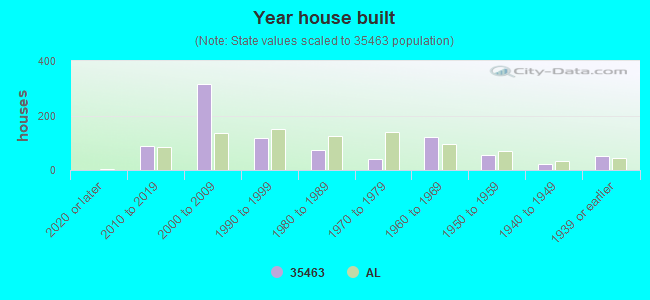
Houses and condos: 894 Renter-occupied apartments: 63
% of renters here:
9%
State:
30%
March 2022 cost of living index in zip code 35463: 78.9 (low, U.S. average is 100)
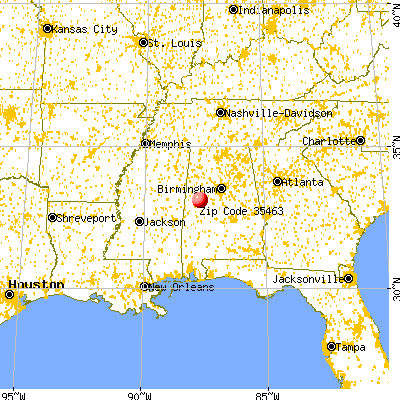
Land area: 61.3 sq. mi. Water area: 2.2 sq. mi.
Population density: 35 people per square mile
(very low).
OSM Map
General Map
Google Map
MSN Map
OSM Map
General Map
Google Map
MSN Map
OSM Map
General Map
Google Map
MSN Map
OSM Map
General Map
Google Map
MSN Map
Please wait while loading the map...
Real estate property taxes paid for housing units in 2022:
This zip code:
0.2% ($500)
Alabama:
0.4% ($718)
Median real estate property taxes paid for housing units with mortgages in 2022: $464 (0.2%) Median real estate property taxes paid for housing units with no mortgage in 2022: $520 (0.2%)
Business Search- 14 Million verified businesses
Males: 1,009
(46.9%)
Females: 1,140
(53.1%)
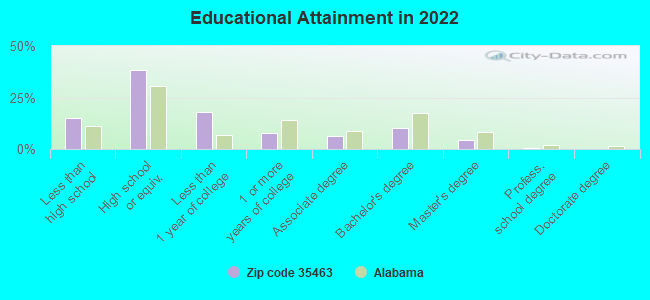
For population 25 years and over in 35463:
High school or higher: 85.0%
Bachelor's degree or higher: 15.3%
Graduate or professional degree: 5.1%
Unemployed: 8.5%
Mean travel time to work (commute): 30.3 minutes
For population 15 years and over in 35463:
Never married: 42.3%
Now married: 41.7%
Separated: 0.0%
Widowed: 3.9%
Divorced: 12.1%
Zip code 35463 compared to state average:
Unemployed percentage above state average.
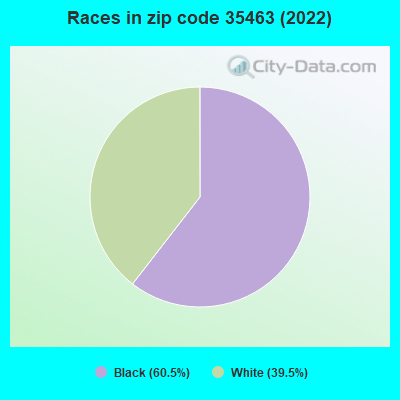
Black race population percentage above state average.
Hispanic race population percentage significantly below state average.
Median age significantly below state average.
Foreign-born population percentage significantly below state average.
Renting percentage significantly below state average.
Length of stay since moving in significantly above state average.
Percentage of population with a bachelor's degree or higher below state average.
Averages for the 2020 tax year for zip code 35463, filed in 2021:
Average Adjusted Gross Income (AGI) in 2020: $52,313 (Individual Income Tax Returns)
Here:
$52,313
State:
$63,984
Salary/wage: $47,550 (reported on 85.7% of returns)
Here:
$47,550
State:
$52,834
(% of AGI for various income ranges: 1147.7% for AGIs below $25k, 3828.0% for AGIs $25k-50k, 7156.2% for AGIs $50k-75k, 10322.5% for AGIs $75k-100k, 20287.1% for AGIs $100k-200k)
Taxable interest for individuals: $557 (reported on 25.0% of returns)
This zip code:
$557
Alabama:
$1,615
(% of AGI for various income ranges: 6.4% for AGIs below $25k, 11.0% for AGIs $25k-50k, 7.5% for AGIs $50k-75k, 52.5% for AGIs $75k-100k, 77.1% for AGIs $100k-200k)
Ordinary dividends: $3,267 (reported on 7.1% of returns)
Here:
$3,267
State:
$7,660
(% of AGI for various income ranges: 62.5% for AGIs $25k-50k, 101.4% for AGIs $100k-200k)
Net capital gain/loss in AGI: +$3,180 (reported on 6.0% of returns)
Here:
+$3,180
State:
+$23,528
(% of AGI for various income ranges: 45.5% for AGIs below $25k, 147.5% for AGIs $75k-100k)
Profit/loss from business: +$6,015 (reported on 15.5% of returns)
Here:
+$6,015
State:
+$9,534
(% of AGI for various income ranges: 10.9% for AGIs below $25k, 162.0% for AGIs $25k-50k, 200.0% for AGIs $50k-75k, 391.4% for AGIs $100k-200k)
Taxable individual retirement arrangement distribution: $10,380 (reported on 6.0% of returns)
35463:
$10,380
Alabama:
$19,004
(% of AGI for various income ranges: 75.5% for AGIs below $25k, 441.2% for AGIs $50k-75k)
Total itemized deductions: $26,900 (reported on 6.0% of returns)
Here:
$26,900
State:
$37,338
(% of AGI for various income ranges: 787.5% for AGIs $50k-75k, 1021.4% for AGIs $100k-200k)
Charity contributions: $13,575 (reported on 4.8% of returns)
Here:
$13,575
State:
$18,005
(% of AGI for various income ranges: 94.5% for AGIs $25k-50k, 505.7% for AGIs $100k-200k)
Taxes paid: $5,320 (reported on 6.0% of returns)
35463:
$5,320
State:
$6,484
(% of AGI for various income ranges: 120.0% for AGIs $50k-75k, 242.9% for AGIs $100k-200k)
Earned income credit: $2,419 (reported on 25.0% of returns)
Here:
$2,419
State:
$2,628
(% of AGI for various income ranges: 151.8% for AGIs below $25k, 87.0% for AGIs $25k-50k)
Percentage of individuals using paid preparers for their 2020 taxes: 90.5%
Here:
90%
State:
93%
(% for various income ranges: 92.6% for AGIs below $25k, 88.5% for AGIs $25k-50k, 90.9% for AGIs $50k-75k, 85.7% for AGIs $75k-100k, 92.3% for AGIs $100k-200k)
Averages for the 2012 tax year for zip code 35463, filed in 2013:
Average Adjusted Gross Income (AGI) in 2012: $42,654 (Individual Income Tax Returns)
Here:
$42,654
State:
$52,001
Salary/wage: $39,637 (reported on 87.2% of returns)
Here:
$39,637
State:
$43,822
(% of AGI for various income ranges: 78.5% for AGIs below $25k, 84.0% for AGIs $25k-50k, 85.1% for AGIs $50k-75k, 78.7% for AGIs $75k-100k, 78.8% for AGIs $100k-200k)
Taxable interest for individuals: $450 (reported on 28.2% of returns)
This zip code:
$450
Alabama:
$1,592
(% of AGI for various income ranges: 0.4% for AGIs below $25k, 0.5% for AGIs $25k-50k, 0.3% for AGIs $75k-100k, 0.3% for AGIs $100k-200k)
Ordinary dividends: $1,557 (reported on 9.0% of returns)
Here:
$1,557
State:
$5,697
Net capital gain/loss in AGI: +$1,925 (reported on 5.1% of returns)
Here:
+$1,925
State:
+$13,286
Profit/loss from business: +$3,683 (reported on 15.4% of returns)
Here:
+$3,683
State:
+$9,151
(% of AGI for various income ranges: 3.8% for AGIs below $25k, 4.3% for AGIs $25k-50k)
Taxable individual retirement arrangement distribution: $9,000 (reported on 6.4% of returns)
35463:
$9,000
Alabama:
$14,992
Total itemized deductions: $17,523 (25% of AGI, reported on 28.2% of returns)
Here:
$17,523
State:
$21,388
Here:
25.4% of AGI
State:
20.1% of AGI
(% of AGI for various income ranges: 7.4% for AGIs below $25k, 14.3% for AGIs $25k-50k, 13.4% for AGIs $50k-75k, 11.1% for AGIs $75k-100k, 10.7% for AGIs $100k-200k)
Charity contributions: $5,119 (reported on 20.5% of returns)
Here:
$5,119
State:
$5,925
(% of AGI for various income ranges: 4.6% for AGIs $25k-50k, 3.0% for AGIs $50k-75k, 2.1% for AGIs $75k-100k, 1.9% for AGIs $100k-200k)
Taxes paid: $3,132 (reported on 28.2% of returns)
35463:
$3,132
State:
$5,272
(% of AGI for various income ranges: 0.7% for AGIs below $25k, 1.5% for AGIs $25k-50k, 2.2% for AGIs $50k-75k, 2.5% for AGIs $75k-100k, 2.9% for AGIs $100k-200k)
Earned income credit: $2,492 (reported on 30.8% of returns)
Here:
$2,492
State:
$2,646
(% of AGI for various income ranges: 10.6% for AGIs below $25k, 1.4% for AGIs $25k-50k)
Percentage of individuals using paid preparers for their 2012 taxes: 57.7%
Here:
58%
State:
60%
(% for various income ranges: 54.3% for AGIs below $25k, 57.9% for AGIs $25k-50k, 60.0% for AGIs $50k-75k, 62.5% for AGIs $75k-100k, 66.7% for AGIs $100k-200k)
Averages for the 2004 tax year for zip code 35463, filed in 2005:
Average Adjusted Gross Income (AGI) in 2004: $33,168 (Individual Income Tax Returns)
Here:
$33,168
State:
$42,302
Salary/wage: $31,981 (reported on 88.9% of returns)
Here:
$31,981
State:
$36,626
(% of AGI for various income ranges: 99.6% for AGIs below $10k, 85.0% for AGIs $10k-25k, 86.4% for AGIs $25k-50k, 87.0% for AGIs $50k-75k, 81.8% for AGIs $75k-100k, 85.2% for AGIs over 100k)
Taxable interest for individuals: $512 (reported on 30.4% of returns)
This zip code:
$512
Alabama:
$1,827
(% of AGI for various income ranges: 3.3% for AGIs below $10k, 0.5% for AGIs $10k-25k, 0.4% for AGIs $25k-50k, 0.6% for AGIs $50k-75k, 0.3% for AGIs $75k-100k, 0.2% for AGIs over 100k)
Taxable dividends: $1,016 (reported on 9.6% of returns)
Here:
$1,016
State:
$4,206
(% of AGI for various income ranges: 1.0% for AGIs below $10k, 0.2% for AGIs $10k-25k, 0.1% for AGIs $25k-50k, 0.8% for AGIs $50k-75k, 0.1% for AGIs $75k-100k)
Net capital gain/loss: +$190 (reported on 6.3% of returns)
Here:
+$190
State:
+$13,031
Profit/loss from business: +$1,145 (reported on 12.4% of returns)
Here:
+$1,145
State:
+$8,302
(% of AGI for various income ranges: 6.5% for AGIs below $10k, 1.2% for AGIs $10k-25k, 0.1% for AGIs $25k-50k, -0.3% for AGIs $50k-75k, 0.7% for AGIs $75k-100k)
Total itemized deductions: $13,652 (23% of AGI, reported on 23.7% of returns)
Here:
$13,652
State:
$17,623
Here:
23.3% of AGI
State:
20.8% of AGI
(% of AGI for various income ranges: 5.8% for AGIs $10k-25k, 9.4% for AGIs $25k-50k, 11.8% for AGIs $50k-75k, 11.4% for AGIs $75k-100k, 11.8% for AGIs over 100k)
Charity contributions deductions: $3,236 (5% of AGI, reported on 21.0% of returns)
Here:
$3,236
State:
$4,768
Here:
5.4% of AGI
State:
5.4% of AGI
(% of AGI for various income ranges: 1.2% for AGIs $10k-25k, 1.6% for AGIs $25k-50k, 2.9% for AGIs $50k-75k, 2.5% for AGIs $75k-100k, 2.3% for AGIs over 100k)
Total tax: $3,769 (reported on 66.3% of returns)
35463:
$3,769
State:
$6,905
(% of AGI for various income ranges: 2.5% for AGIs below $10k, 2.4% for AGIs $10k-25k, 5.7% for AGIs $25k-50k, 8.3% for AGIs $50k-75k, 10.4% for AGIs $75k-100k, 14.6% for AGIs over 100k)
Earned income credit: $2,077 (reported on 29.1% of returns)
Here:
$2,077
State:
$2,048
Percentage of individuals using paid preparers for their 2004 taxes: 62.2%
Here:
62%
State:
65%
(% for various income ranges: 57.6% for AGIs below $10k, 66.1% for AGIs $10k-25k, 63.5% for AGIs $25k-50k, 58.9% for AGIs $50k-75k, 58.5% for AGIs $75k-100k, 57.1% for AGIs over 100k)
Household received Food Stamps/SNAP in the past 12 months: 86 Household did not receive Food Stamps/SNAP in the past 12 months: 641
Women who had a birth in the past 12 months: 38 (43 now married, 0 unmarried) Women who did not have a birth in the past 12 months: 588 (123 now married, 465 unmarried)
Housing units in zip code 35463 with a mortgage: 304 (10 second mortgage, 10 both second mortgage and home equity loan) Median monthly owner costs for units with a mortgage: $1,529 Median monthly owner costs for units without a mortgage: $325
Residents with income below the poverty level in 2022:
This zip code:
18.4%
Whole state:
16.2%
Residents with income below 50% of the poverty level in 2022:
This zip code:
14.1%
Whole state:
8.6%
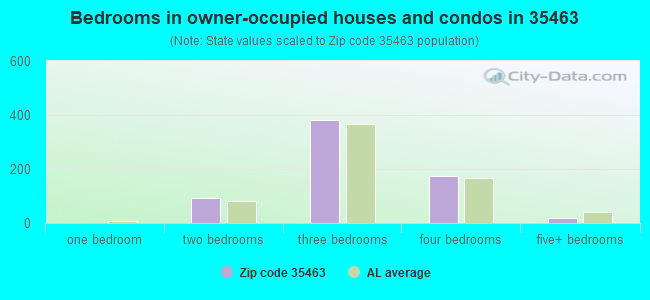
Median number of rooms in houses and condos:
Here:
6.2
State:
6.5
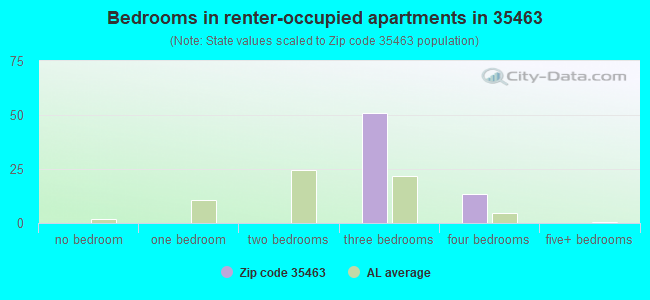
Median number of rooms in apartments:
Here:
5.3
State:
4.7
Notable locations in this zip code not listed on our city pages
Notable locations in zip code 35463: Willifords Landing (A), R H Fosters Landing (B), Manleys Landing (C), Hiphill Landing (D), Burroughs Landing (E), Foster Landing (F), Fosters - Ralph Volunteer Fire Department Fosters Station (G). Display/hide their locations on the map
Churches in zip code 35463 include: Mount Zion African Methodist Episcopal Zion Church (A), Little Mission Baptist Church (B), Dry Creek Church (C), Victorious Life Church (D), Mount Zion Baptist Church (E), Grants Creek Baptist Church (F), Sylvan United Methodist Church (G). Display/hide their locations on the map
Cemeteries: Parham Ridge Cemetery (1), Mount Zion Cemetery (2), Jones-Townsend Cemetery (3), Grants Creek Cemetery (4), Foster Cemetery (5), Beale Cemetery (6), Zion Hill Cemetery (7). Display/hide their locations on the map
Size of family households: 97 2-persons, 244 3-persons, 171 4-persons, 33 5-persons, 6 6-persons, 17 7-or-more-persons
Size of nonfamily households: 161 1-person
228 married couples with children.
174 single-parent households (139 men, 35 women).
98.9% of residents of 35463 zip code speak English at home.
0.5% of residents speak Spanish at home (100% very well).
Foreign born population: 0 (0.0%)
:
0.0%
Whole state:
3.8%
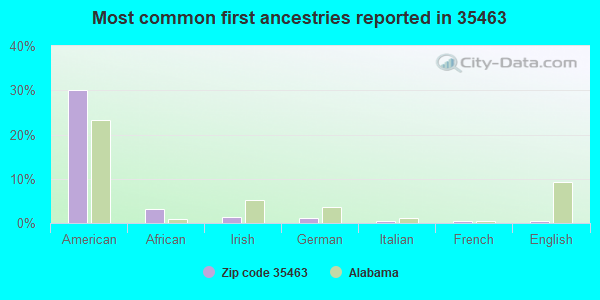
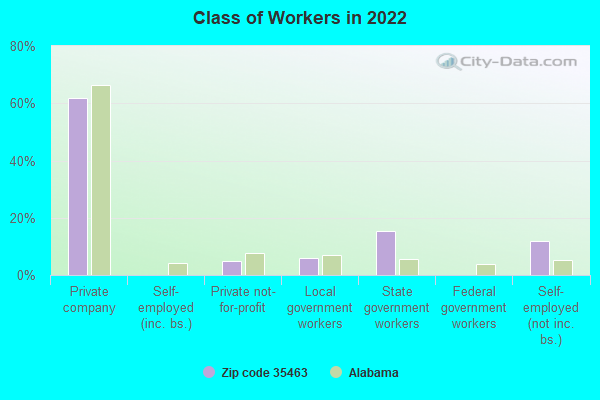
30%American
3%African
1%Irish
1%German
1%Italian
0%French
0%English
Facilities with environmental interests located in this zip code:
MYRTLEWOOD ELEMENTARY SCHOOL (14701 GAINSVILLE RD in FOSTERS, AL)
(Geographic Names Information System) (National Center for Education Statistics) - STATE ID-0140 Organizations: TUSCALOOSA COUNTY (SCHOOL DISTRICT)
CHARLIE PATTON PROPERTY (PROPERTY UNDERNEATH BRIDGE ON in FOSTERS, AL)
(Resource Conservation and Recovery Act (tracking hazardous waste))
REED CREEK ROAD (TUSCALOOSA COUNTY PUBLIC WORKS in FOSTERS, AL)
National Pollutant Discharge Elimination System NON-MAJOR (Tracking pollutant discharge elimination systems) - permit Business SIC classification: HIGHWAY AND STREET CONSTRUCTION, EXCEPT ELEVATED HIGHWAYS Alternative names: TUSCALOOSA REED CREEK ROAD
Housing units lacking complete plumbing facilities: 2.1%
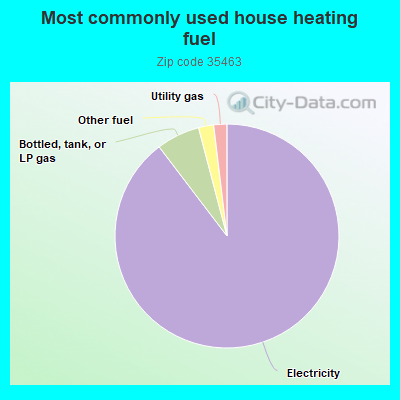
90.0%Electricity
6.3%Bottled, tank, or LP gas
2.2%Other fuel
1.9%Utility gas
Population in 1990: 2,100.
Place of birth for U.S.-born residents:
This state: 1,874
Northeast: 8
Midwest: 30
South: 217
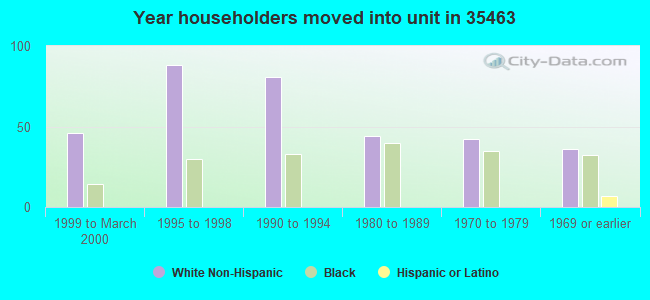
69% of the 35463 zip code residents lived in the same house 5 years ago. Out of people who lived in different houses, 73% lived in this county. Out of people who lived in different counties, 50% lived in Alabama.
91% of the 35463 zip code residents lived in the same house 1 year ago. Out of people who lived in different houses, 91% moved from this county.
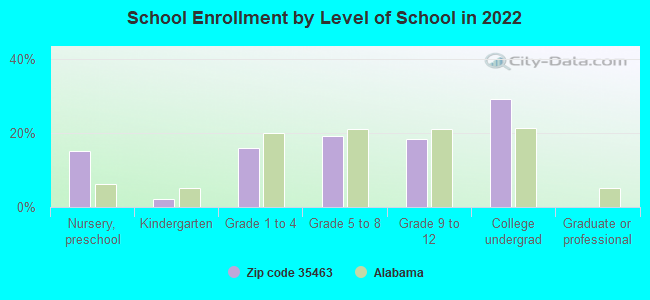
Private vs. public school enrollment:
Students in private schools in grades 1 to 8 (elementary and middle school):
Here:
0.0%
Alabama:
14.7%
Students in private schools in grades 9 to 12 (high school):
Here:
0.0%
Alabama:
16.3%
Students in private undergraduate colleges:
Here:
0.0%
Alabama:
14.6%
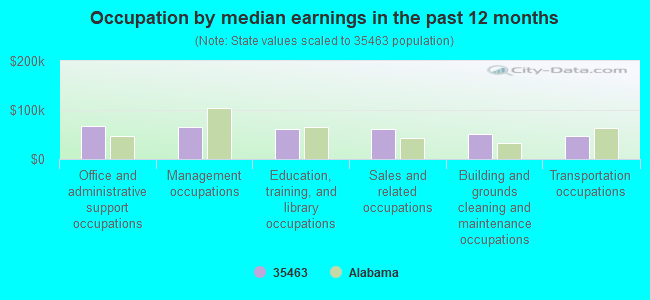
Occupation by median earnings in the past 12 months ($)
68,222Office and administrative support occupations
64,368Management occupations
61,171Education, training, and library occupations
60,245Sales and related occupations
50,722Building and grounds cleaning and maintenance occupations
47,109Transportation occupations
Top industries in this zip code by the number of employees in 2005:
Other Services (except Public Administration): Religious Organizations (10-19 employees: 1 establishment, 5-9 employees: 1 establishment, 1-4 employees: 2 establishments)
Other Services (except Public Administration): Commercial and Industrial Machinery and Equipment (except Automotive and Electronic) Repair and Maintenance (5-9: 1)
Construction: Flooring Contractors (1-4: 1)
Administrative and Support and Waste Management and Remediation Services: Exterminating and Pest Control Services (1-4: 1)
Construction: Painting and Wall Covering Contractors (1-4: 1)
Professional, Scientific, and Technical Services: Other Scientific and Technical Consulting Services (1-4: 1)
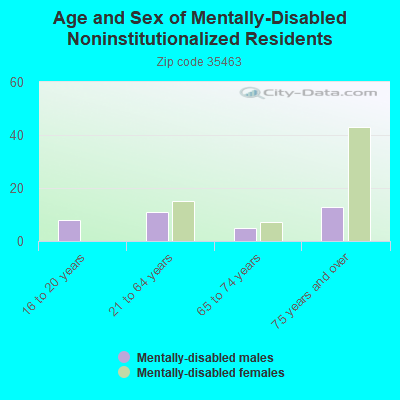
People in group quarters in 2010:
11 people in residential treatment centers for adults
Fatal accident statistics in 2014:
Fatal accident count: 3
Vehicles involved in fatal accidents: 3
Fatal accidents caused by drunken drivers: 1
Fatalities: 3
Persons involved in fatal accidents: 5
Pedestrians involved in fatal accidents: 1
Fatal accident statistics in 2012:
Fatal accident count: 1
Vehicles involved in fatal accidents: 2
Fatal accidents caused by drunken drivers: 0
Fatalities: 1
Persons involved in fatal accidents: 2
Pedestrians involved in fatal accidents: 0
Home Mortgage Disclosure Act Aggregated Statistics For Year 2009 (Based on 1 partial tract)
A) FHA, FSA/RHS & VA Home Purchase Loans
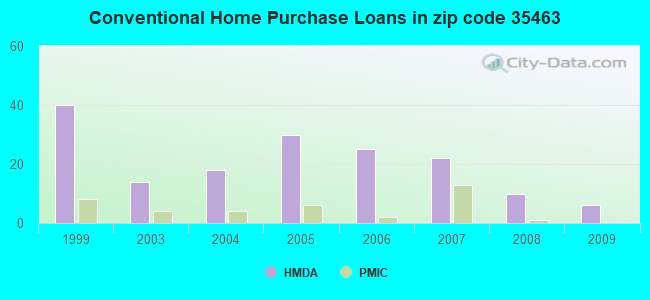
B) Conventional Home Purchase Loans
C) Refinancings
D) Home Improvement Loans
F) Non-occupant Loans on < 5 Family Dwellings (A B C & D)
G) Loans On Manufactured Home Dwelling (A B C & D)
Number
Average Value
Number
Average Value
Number
Average Value
Number
Average Value
Number
Average Value
Number
Average Value
LOANS ORIGINATED
8
$137,985
6
$135,268
38
$176,535
1
$127,060
7
$106,559
3
$73,753
APPLICATIONS APPROVED, NOT ACCEPTED
0
$0
1
$171,980
3
$126,573
0
$0
0
$0
1
$171,980
APPLICATIONS DENIED
1
$185,030
1
$52,170
11
$123,630
1
$4,350
0
$0
2
$54,350
APPLICATIONS WITHDRAWN
1
$88,890
1
$125,610
12
$154,793
0
$0
1
$218,360
1
$125,610
FILES CLOSED FOR INCOMPLETENESS
0
$0
0
$0
2
$173,190
0
$0
0
$0
0
$0
Aggregated Statistics For Year 2008 (Based on 1 partial tract)
A) FHA, FSA/RHS & VA Home Purchase Loans
B) Conventional Home Purchase Loans
C) Refinancings
D) Home Improvement Loans
F) Non-occupant Loans on < 5 Family Dwellings (A B C & D)
G) Loans On Manufactured Home Dwelling (A B C & D)
Number
Average Value
Number
Average Value
Number
Average Value
Number
Average Value
Number
Average Value
Number
Average Value
LOANS ORIGINATED
6
$145,655
10
$106,089
23
$148,900
2
$20,775
5
$107,344
5
$46,474
APPLICATIONS APPROVED, NOT ACCEPTED
0
$0
1
$140,100
4
$164,375
0
$0
0
$0
0
$0
APPLICATIONS DENIED
3
$106,927
3
$61,193
13
$142,217
2
$44,930
0
$0
2
$64,250
APPLICATIONS WITHDRAWN
0
$0
1
$72,470
6
$161,918
0
$0
0
$0
0
$0
FILES CLOSED FOR INCOMPLETENESS
0
$0
1
$104,350
0
$0
0
$0
0
$0
0
$0
Aggregated Statistics For Year 2007 (Based on 1 partial tract)
A) FHA, FSA/RHS & VA Home Purchase Loans
B) Conventional Home Purchase Loans
C) Refinancings
D) Home Improvement Loans
F) Non-occupant Loans on < 5 Family Dwellings (A B C & D)
G) Loans On Manufactured Home Dwelling (A B C & D)
Number
Average Value
Number
Average Value
Number
Average Value
Number
Average Value
Number
Average Value
Number
Average Value
LOANS ORIGINATED
8
$114,072
22
$140,275
15
$135,783
3
$80,033
5
$105,316
2
$52,175
APPLICATIONS APPROVED, NOT ACCEPTED
0
$0
2
$116,185
2
$153,625
2
$39,375
1
$128,500
2
$55,315
APPLICATIONS DENIED
2
$112,805
5
$73,722
14
$153,454
5
$39,710
0
$0
5
$63,866
APPLICATIONS WITHDRAWN
0
$0
5
$164,738
6
$155,075
0
$0
0
$0
0
$0
FILES CLOSED FOR INCOMPLETENESS
0
$0
0
$0
3
$142,030
0
$0
0
$0
0
$0
Aggregated Statistics For Year 2006 (Based on 1 partial tract)
A) FHA, FSA/RHS & VA Home Purchase Loans
B) Conventional Home Purchase Loans
C) Refinancings
D) Home Improvement Loans
F) Non-occupant Loans on < 5 Family Dwellings (A B C & D)
G) Loans On Manufactured Home Dwelling (A B C & D)
Number
Average Value
Number
Average Value
Number
Average Value
Number
Average Value
Number
Average Value
Number
Average Value
LOANS ORIGINATED
5
$141,066
25
$95,422
22
$117,832
1
$20,290
2
$155,315
4
$47,585
APPLICATIONS APPROVED, NOT ACCEPTED
0
$0
2
$63,285
2
$114,735
1
$45,890
0
$0
2
$56,040
APPLICATIONS DENIED
0
$0
9
$69,191
17
$121,429
6
$44,043
0
$0
9
$55,557
APPLICATIONS WITHDRAWN
0
$0
2
$155,075
4
$191,428
1
$62,800
0
$0
0
$0
FILES CLOSED FOR INCOMPLETENESS
1
$135,750
0
$0
3
$141,227
0
$0
0
$0
0
$0
Aggregated Statistics For Year 2005 (Based on 1 partial tract)
A) FHA, FSA/RHS & VA Home Purchase Loans
B) Conventional Home Purchase Loans
C) Refinancings
D) Home Improvement Loans
F) Non-occupant Loans on < 5 Family Dwellings (A B C & D)
G) Loans On Manufactured Home Dwelling (A B C & D)
Number
Average Value
Number
Average Value
Number
Average Value
Number
Average Value
Number
Average Value
Number
Average Value
LOANS ORIGINATED
7
$158,940
30
$95,332
25
$93,490
3
$58,777
4
$76,210
5
$45,604
APPLICATIONS APPROVED, NOT ACCEPTED
0
$0
5
$55,556
4
$138,045
1
$113,530
1
$83,090
5
$51,306
APPLICATIONS DENIED
0
$0
8
$54,409
22
$89,615
7
$34,093
0
$0
12
$53,584
APPLICATIONS WITHDRAWN
0
$0
1
$48,310
10
$142,611
2
$79,470
1
$23,670
2
$54,105
FILES CLOSED FOR INCOMPLETENESS
0
$0
0
$0
11
$133,028
0
$0
0
$0
1
$80,680
Aggregated Statistics For Year 2004 (Based on 1 partial tract)
A) FHA, FSA/RHS & VA Home Purchase Loans
B) Conventional Home Purchase Loans
C) Refinancings
D) Home Improvement Loans
F) Non-occupant Loans on < 5 Family Dwellings (A B C & D)
G) Loans On Manufactured Home Dwelling (A B C & D)
Number
Average Value
Number
Average Value
Number
Average Value
Number
Average Value
Number
Average Value
Number
Average Value
LOANS ORIGINATED
7
$129,677
18
$95,412
27
$106,550
2
$30,195
4
$85,148
7
$42,859
APPLICATIONS APPROVED, NOT ACCEPTED
0
$0
4
$90,822
9
$136,234
0
$0
0
$0
1
$82,130
APPLICATIONS DENIED
0
$0
11
$62,276
20
$112,466
4
$62,802
0
$0
8
$38,890
APPLICATIONS WITHDRAWN
0
$0
5
$83,190
9
$134,678
0
$0
0
$0
0
$0
FILES CLOSED FOR INCOMPLETENESS
0
$0
1
$76,810
6
$135,428
0
$0
0
$0
0
$0
Aggregated Statistics For Year 2003 (Based on 1 partial tract)
A) FHA, FSA/RHS & VA Home Purchase Loans
B) Conventional Home Purchase Loans
C) Refinancings
D) Home Improvement Loans
F) Non-occupant Loans on < 5 Family Dwellings (A B C & D)
Number
Average Value
Number
Average Value
Number
Average Value
Number
Average Value
Number
Average Value
LOANS ORIGINATED
1
$197,590
14
$80,643
36
$103,934
1
$109,180
4
$86,595
APPLICATIONS APPROVED, NOT ACCEPTED
0
$0
2
$69,325
5
$117,974
0
$0
0
$0
APPLICATIONS DENIED
0
$0
10
$51,982
21
$89,328
3
$105,153
0
$0
APPLICATIONS WITHDRAWN
0
$0
4
$83,092
10
$100,050
0
$0
0
$0
FILES CLOSED FOR INCOMPLETENESS
0
$0
0
$0
3
$90,983
0
$0
0
$0
Aggregated Statistics For Year 1999 (Based on 1 partial tract)
A) FHA, FSA/RHS & VA Home Purchase Loans
B) Conventional Home Purchase Loans
C) Refinancings
D) Home Improvement Loans
F) Non-occupant Loans on < 5 Family Dwellings (A B C & D)


 Nearest zip codes: 35401, 35469, 35480, 35405, 35474, 35446.