Estimated zip code population in 2022: 1,844 Zip code population in 2010: 1,343 Zip code population in 2000: 1,098
Houses and condos: 594 Renter-occupied apartments: 18
% of renters here:
4%
State:
30%
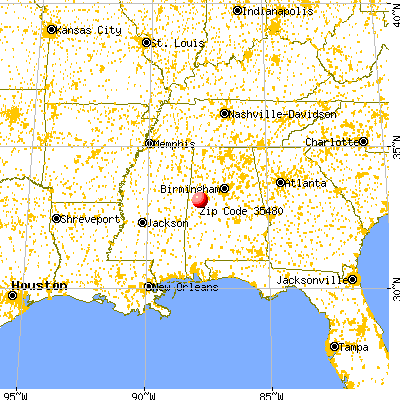
March 2022 cost of living index in zip code 35480: 78.5 (low, U.S. average is 100)
Land area: 68.3 sq. mi. Water area: 0.1 sq. mi.
Population density: 27 people per square mile
(very low).
OSM Map
General Map
Google Map
MSN Map
OSM Map
General Map
Google Map
MSN Map
OSM Map
General Map
Google Map
MSN Map
OSM Map
General Map
Google Map
MSN Map
Please wait while loading the map...
Real estate property taxes paid for housing units in 2022:
This zip code:
0.2% ($574)
Alabama:
0.4% ($718)
Median real estate property taxes paid for housing units with mortgages in 2022: $599 (0.2%) Median real estate property taxes paid for housing units with no mortgage in 2022: $510 (0.2%)
Business Search- 14 Million verified businesses
Males: 895
(48.5%)
Females: 949
(51.5%)
For population 25 years and over in 35480:
High school or higher: 90.6%
Bachelor's degree or higher: 20.1%
Graduate or professional degree: 2.5%
Unemployed: 3.4%
Mean travel time to work (commute): 27.9 minutes
For population 15 years and over in 35480:
Never married: 40.3%
Now married: 48.6%
Separated: 0.0%
Widowed: 1.6%
Divorced: 9.6%
Zip code 35480 compared to state average:
Median household income above state average.
Black race population percentage above state average.
Median age significantly below state average.
Foreign-born population percentage below state average.
Renting percentage significantly below state average.
Number of rooms per house above state average.
House age below state average.
Percentage of population with a bachelor's degree or higher below state average.
Averages for the 2020 tax year for zip code 35480, filed in 2021:
Average Adjusted Gross Income (AGI) in 2020: $57,765 (Individual Income Tax Returns)
Here:
$57,765
State:
$63,984
Salary/wage: $53,724 (reported on 86.1% of returns)
Here:
$53,724
State:
$52,834
(% of AGI for various income ranges: 1214.2% for AGIs below $25k, 4005.6% for AGIs $25k-50k, 6981.1% for AGIs $50k-75k, 11658.0% for AGIs $75k-100k, 22434.3% for AGIs $100k-200k)
Taxable interest for individuals: $438 (reported on 26.6% of returns)
This zip code:
$438
Alabama:
$1,615
(% of AGI for various income ranges: 3.2% for AGIs below $25k, 11.9% for AGIs $25k-50k, 35.6% for AGIs $50k-75k, 20.0% for AGIs $75k-100k, 35.7% for AGIs $100k-200k)
Ordinary dividends: $1,686 (reported on 8.9% of returns)
Here:
$1,686
State:
$7,660
(% of AGI for various income ranges: 16.8% for AGIs below $25k, 50.0% for AGIs $50k-75k, 58.6% for AGIs $100k-200k)
Net capital gain/loss in AGI: +$1,960 (reported on 6.3% of returns)
Here:
+$1,960
State:
+$23,528
(% of AGI for various income ranges: 44.4% for AGIs $25k-50k, 38.6% for AGIs $100k-200k)
Profit/loss from business: +$4,350 (reported on 17.7% of returns)
Here:
+$4,350
State:
+$9,534
(% of AGI for various income ranges: 8.8% for AGIs $25k-50k, 411.1% for AGIs $50k-75k, 364.3% for AGIs $100k-200k)
Taxable individual retirement arrangement distribution: $11,320 (reported on 6.3% of returns)
35480:
$11,320
Alabama:
$19,004
(% of AGI for various income ranges: 102.6% for AGIs below $25k, 412.2% for AGIs $50k-75k)
Total itemized deductions: $29,943 (reported on 8.9% of returns)
Here:
$29,943
State:
$37,338
(% of AGI for various income ranges: 1160.0% for AGIs $50k-75k, 1502.9% for AGIs $100k-200k)
Charity contributions: $13,260 (reported on 6.3% of returns)
Here:
$13,260
State:
$18,005
(% of AGI for various income ranges: 336.7% for AGIs $50k-75k, 514.3% for AGIs $100k-200k)
Taxes paid: $4,900 (reported on 8.9% of returns)
35480:
$4,900
State:
$6,484
(% of AGI for various income ranges: 23.2% for AGIs below $25k, 112.2% for AGIs $50k-75k, 282.9% for AGIs $100k-200k)
Earned income credit: $2,760 (reported on 19.0% of returns)
Here:
$2,760
State:
$2,628
(% of AGI for various income ranges: 148.4% for AGIs below $25k, 82.5% for AGIs $25k-50k)
Percentage of individuals using paid preparers for their 2020 taxes: 91.1%
Here:
91%
State:
93%
(% for various income ranges: 95.8% for AGIs below $25k, 90.5% for AGIs $25k-50k, 84.6% for AGIs $50k-75k, 87.5% for AGIs $75k-100k, 92.3% for AGIs $100k-200k)
Averages for the 2012 tax year for zip code 35480, filed in 2013:
Average Adjusted Gross Income (AGI) in 2012: $49,083 (Individual Income Tax Returns)
Here:
$49,083
State:
$52,001
Salary/wage: $45,247 (reported on 87.3% of returns)
Here:
$45,247
State:
$43,822
(% of AGI for various income ranges: 71.8% for AGIs below $25k, 84.9% for AGIs $25k-50k, 86.3% for AGIs $50k-75k, 86.1% for AGIs $75k-100k, 74.3% for AGIs $100k-200k)
Taxable interest for individuals: $476 (reported on 27.0% of returns)
This zip code:
$476
Alabama:
$1,592
(% of AGI for various income ranges: 1.1% for AGIs below $25k, 0.3% for AGIs $25k-50k, 0.1% for AGIs $50k-75k, 0.1% for AGIs $75k-100k, 0.1% for AGIs $100k-200k)
Ordinary dividends: $1,600 (reported on 9.5% of returns)
Here:
$1,600
State:
$5,697
(% of AGI for various income ranges: 0.5% for AGIs below $25k, 0.9% for AGIs $50k-75k, 0.3% for AGIs $100k-200k)
Net capital gain/loss in AGI: +$1,275 (reported on 6.3% of returns)
Here:
+$1,275
State:
+$13,286
Profit/loss from business: +$2,892 (reported on 19.0% of returns)
Here:
+$2,892
State:
+$9,151
(% of AGI for various income ranges: 8.7% for AGIs below $25k, 2.2% for AGIs $25k-50k)
Taxable individual retirement arrangement distribution: $9,925 (reported on 6.3% of returns)
35480:
$9,925
Alabama:
$14,992
Total itemized deductions: $18,327 (22% of AGI, reported on 34.9% of returns)
Here:
$18,327
State:
$21,388
Here:
22.0% of AGI
State:
20.1% of AGI
(% of AGI for various income ranges: 16.2% for AGIs $25k-50k, 14.8% for AGIs $50k-75k, 14.7% for AGIs $75k-100k, 13.1% for AGIs $100k-200k)
Charity contributions: $4,947 (reported on 30.2% of returns)
Here:
$4,947
State:
$5,925
(% of AGI for various income ranges: 2.8% for AGIs $25k-50k, 3.9% for AGIs $50k-75k, 3.5% for AGIs $75k-100k, 3.4% for AGIs $100k-200k)
Taxes paid: $3,818 (reported on 34.9% of returns)
35480:
$3,818
State:
$5,272
(% of AGI for various income ranges: 1.9% for AGIs $25k-50k, 2.6% for AGIs $50k-75k, 3.0% for AGIs $75k-100k, 3.9% for AGIs $100k-200k)
Earned income credit: $2,561 (reported on 28.6% of returns)
Here:
$2,561
State:
$2,646
(% of AGI for various income ranges: 11.9% for AGIs below $25k, 1.7% for AGIs $25k-50k)
Percentage of individuals using paid preparers for their 2012 taxes: 58.7%
Here:
59%
State:
60%
(% for various income ranges: 54.2% for AGIs below $25k, 58.8% for AGIs $25k-50k, 62.5% for AGIs $50k-75k, 57.1% for AGIs $75k-100k, 71.4% for AGIs $100k-200k)
Averages for the 2004 tax year for zip code 35480, filed in 2005:
Average Adjusted Gross Income (AGI) in 2004: $36,904 (Individual Income Tax Returns)
Here:
$36,904
State:
$42,302
Salary/wage: $35,763 (reported on 89.5% of returns)
Here:
$35,763
State:
$36,626
(% of AGI for various income ranges: 108.0% for AGIs below $10k, 86.3% for AGIs $10k-25k, 84.8% for AGIs $25k-50k, 92.0% for AGIs $50k-75k, 91.2% for AGIs $75k-100k, 72.1% for AGIs over 100k)
Taxable interest for individuals: $760 (reported on 35.7% of returns)
This zip code:
$760
Alabama:
$1,827
(% of AGI for various income ranges: 5.9% for AGIs below $10k, 1.9% for AGIs $10k-25k, 0.7% for AGIs $25k-50k, 0.1% for AGIs $50k-75k, 0.4% for AGIs $75k-100k, 0.4% for AGIs over 100k)
Taxable dividends: $762 (reported on 11.2% of returns)
Here:
$762
State:
$4,206
(% of AGI for various income ranges: 0.1% for AGIs $10k-25k, 0.1% for AGIs $25k-50k, 0.0% for AGIs $50k-75k, 0.2% for AGIs $75k-100k, 1.0% for AGIs over 100k)
Net capital gain/loss: +$778 (reported on 6.4% of returns)
Here:
+$778
State:
+$13,031
(% of AGI for various income ranges: 0.3% for AGIs $10k-25k, 0.2% for AGIs $50k-75k, 0.2% for AGIs $75k-100k)
Total itemized deductions: $15,966 (25% of AGI, reported on 31.6% of returns)
Here:
$15,966
State:
$17,623
Here:
25.2% of AGI
State:
20.8% of AGI
(% of AGI for various income ranges: 14.5% for AGIs $10k-25k, 14.8% for AGIs $25k-50k, 12.0% for AGIs $50k-75k, 14.9% for AGIs $75k-100k, 13.6% for AGIs over 100k)
Charity contributions deductions: $3,422 (5% of AGI, reported on 27.5% of returns)
Here:
$3,422
State:
$4,768
Here:
5.3% of AGI
State:
5.4% of AGI
(% of AGI for various income ranges: 1.5% for AGIs $10k-25k, 2.7% for AGIs $25k-50k, 2.6% for AGIs $50k-75k, 2.7% for AGIs $75k-100k, 3.4% for AGIs over 100k)
Total tax: $4,379 (reported on 66.8% of returns)
35480:
$4,379
State:
$6,905
(% of AGI for various income ranges: 2.3% for AGIs below $10k, 2.8% for AGIs $10k-25k, 5.5% for AGIs $25k-50k, 7.5% for AGIs $50k-75k, 10.1% for AGIs $75k-100k, 15.0% for AGIs over 100k)
Earned income credit: $2,132 (reported on 28.3% of returns)
Here:
$2,132
State:
$2,048
Percentage of individuals using paid preparers for their 2004 taxes: 66.8%
Here:
67%
State:
65%
(% for various income ranges: 58.9% for AGIs below $10k, 70.2% for AGIs $10k-25k, 62.4% for AGIs $25k-50k, 69.1% for AGIs $50k-75k, 69.8% for AGIs $75k-100k, 79.2% for AGIs over 100k)
Household received Food Stamps/SNAP in the past 12 months: 26 Household did not receive Food Stamps/SNAP in the past 12 months: 481
Women who had a birth in the past 12 months: 12 (14 now married, 0 unmarried) Women who did not have a birth in the past 12 months: 527 (205 now married, 322 unmarried)
Housing units in zip code 35480 with a mortgage: 280 (22 second mortgage, 11 home equity loan, 11 both second mortgage and home equity loan) Median monthly owner costs for units with a mortgage: $1,355 Median monthly owner costs for units without a mortgage: $380
Residents with income below the poverty level in 2022:
This zip code:
24.6%
Whole state:
16.2%
Residents with income below 50% of the poverty level in 2022:
This zip code:
1.0%
Whole state:
8.6%
Median number of rooms in houses and condos:
Here:
6.9
State:
6.5
Notable locations in this zip code not listed on our city pages
Notable locations in zip code 35480: Gilliam Farms (A), Sipsey River Hunting Club (B), Fosters - Ralph Volunteer Fire Department Ralph Station (C). Display/hide their locations on the map
Churches in zip code 35480 include: Mount Herman Church (A), Pleasant Grove Methodist Church (B), New Hope Baptist Church (C), Bethel Baptist Church (D), Saint Pauls Church (E), Zion Hill Baptist Church (F), Wesley Chapel United Methodist Church (G), Mount Carmel Methodist Church (H), Washington Temple Church of God in Christ (I). Display/hide their locations on the map
Cemeteries: Old Shiloh Cemetery (1), Old Bethel Cemetery (2), Mount Herman Cemetery (3), Zion Hill Cemetery (4), Mount Moriah Cemetery (5), Wesley Chapel Cemetery (6), New Hope Cemetery (7). Display/hide their locations on the map
Creeks: Thornton Creek (A), Taylor Creek (B), McCracken Creek (C), Dry Creek (D), Middle Creek (E), Arthur Creek (F), Turkey Creek (G). Display/hide their locations on the map
In group quarters: 7 (-1 institutionalized population)
Size of family households: 157 2-persons, 114 3-persons, 82 4-persons, 33 5-persons, 26 7-or-more-persons
Size of nonfamily households: 73 1-person, 25 2-persons
213 married couples with children.
242 single-parent households (242 women).
98.0% of residents of 35480 zip code speak English at home.
0.6% of residents speak Spanish at home (100% very well).
0.7% of residents speak other Indo-European language at home (100% very well).
Foreign born population: 34 (1.9%) (84.2% of them are naturalized citizens)
This zip code:
1.9%
Whole state:
3.8%
44%Bolivia
41%France
12%Sweden
17%English
17%American
4%African
4%German
2%Irish
1%Brazilian
1%Scottish
Year of entry for the foreign-born population
462010 or later
02000 to 2009
01990 to 1999
0Before 1990
Facilities with environmental interests located in this zip code:
WESLEY CHAPEL PIT (TUSCALOOSA COUNTY PUBLIC WORKS in RALPH, AL)
National Pollutant Discharge Elimination System NON-MAJOR (Tracking pollutant discharge elimination systems) - permit Business SIC classification: CONSTRUCTION SAND AND GRAVEL Alternative names: TUSCALOOSA CO WESLEY CHAPEL PT
Housing units lacking complete plumbing facilities: 7.9% Housing units lacking complete kitchen facilities: 4.0%
91.4%Electricity
5.1%Bottled, tank, or LP gas
2.9%Utility gas
0.8%Wood
Population in 1990: 927. Population change in the 1990s: +171 (+18.4%).
Place of birth for U.S.-born residents:
This state: 1,615
Midwest: 56
South: 111
West: 5
59% of the 35480 zip code residents lived in the same house 5 years ago. Out of people who lived in different houses, 79% lived in this county. Out of people who lived in different counties, 50% lived in Alabama.
98% of the 35480 zip code residents lived in the same house 1 year ago. Out of people who lived in different houses, 35% moved from this county. Out of people who lived in different houses, 75% moved from different county within same state.
Private vs. public school enrollment:
Students in private schools in grades 1 to 8 (elementary and middle school): 32
Here:
17.1%
Alabama:
14.7%
Students in private schools in grades 9 to 12 (high school): 18
Here:
6.6%
Alabama:
16.3%
Students in private undergraduate colleges: 50
Here:
30.0%
Alabama:
14.6%
Occupation by median earnings in the past 12 months ($)
94,235Management occupations
58,977Health technologists and technicians
55,446Construction and extraction occupations
49,610Office and administrative support occupations
49,579Health diagnosing and treating practitioners and other technical occupations
46,743Production occupations
Top industries in this zip code by the number of employees in 2005:
Other Services (except Public Administration): Religious Organizations (5-9 employees: 1 establishment)
Administrative and Support and Waste Management and Remediation Services: Landscaping Services (1-4: 2)
Construction: Plumbing, Heating, and Air-Conditioning Contractors (1-4: 1)
Other Services (except Public Administration): Pet Care (except Veterinary) Services (1-4: 1)
Educational Services: Sports and Recreation Instruction (1-4: 1)
Construction: Electrical Contractors (1-4: 1)
Construction: Site Preparation Contractors (1-4: 1)
Fatal accident statistics in 2013:
Fatal accident count: 1
Vehicles involved in fatal accidents: 1
Fatal accidents caused by drunken drivers: 1
Fatalities: 1
Persons involved in fatal accidents: 1
Pedestrians involved in fatal accidents: 0
Fatal accident statistics in 2012:
Fatal accident count: 1
Vehicles involved in fatal accidents: 2
Fatal accidents caused by drunken drivers: 0
Fatalities: 1
Persons involved in fatal accidents: 7
Pedestrians involved in fatal accidents: 0
Home Mortgage Disclosure Act Aggregated Statistics For Year 2009 (Based on 1 partial tract)
A) FHA, FSA/RHS & VA Home Purchase Loans
B) Conventional Home Purchase Loans
C) Refinancings
D) Home Improvement Loans
F) Non-occupant Loans on < 5 Family Dwellings (A B C & D)
G) Loans On Manufactured Home Dwelling (A B C & D)
Number
Average Value
Number
Average Value
Number
Average Value
Number
Average Value
Number
Average Value
Number
Average Value
LOANS ORIGINATED
7
$139,679
6
$119,812
33
$180,055
1
$112,540
6
$110,113
3
$65,327
APPLICATIONS APPROVED, NOT ACCEPTED
0
$0
1
$152,330
3
$112,110
0
$0
0
$0
1
$152,330
APPLICATIONS DENIED
1
$163,890
1
$46,210
10
$120,454
1
$3,850
0
$0
2
$48,140
APPLICATIONS WITHDRAWN
1
$78,730
1
$111,250
10
$164,528
0
$0
1
$193,410
1
$111,250
FILES CLOSED FOR INCOMPLETENESS
0
$0
0
$0
2
$153,400
0
$0
0
$0
0
$0
Aggregated Statistics For Year 2008 (Based on 1 partial tract)
A) FHA, FSA/RHS & VA Home Purchase Loans
B) Conventional Home Purchase Loans
C) Refinancings
D) Home Improvement Loans
F) Non-occupant Loans on < 5 Family Dwellings (A B C & D)
G) Loans On Manufactured Home Dwelling (A B C & D)
Number
Average Value
Number
Average Value
Number
Average Value
Number
Average Value
Number
Average Value
Number
Average Value
LOANS ORIGINATED
5
$154,814
9
$104,408
21
$144,447
2
$18,400
5
$95,080
5
$41,164
APPLICATIONS APPROVED, NOT ACCEPTED
0
$0
1
$124,090
3
$194,123
0
$0
0
$0
0
$0
APPLICATIONS DENIED
3
$94,710
3
$54,200
11
$148,870
2
$39,795
0
$0
2
$56,910
APPLICATIONS WITHDRAWN
0
$0
1
$64,190
6
$143,418
0
$0
0
$0
0
$0
FILES CLOSED FOR INCOMPLETENESS
0
$0
1
$92,430
0
$0
0
$0
0
$0
0
$0
Aggregated Statistics For Year 2007 (Based on 1 partial tract)
A) FHA, FSA/RHS & VA Home Purchase Loans
B) Conventional Home Purchase Loans
C) Refinancings
D) Home Improvement Loans
F) Non-occupant Loans on < 5 Family Dwellings (A B C & D)
G) Loans On Manufactured Home Dwelling (A B C & D)
Number
Average Value
Number
Average Value
Number
Average Value
Number
Average Value
Number
Average Value
Number
Average Value
LOANS ORIGINATED
7
$115,471
20
$136,672
14
$128,859
3
$70,890
5
$93,282
2
$46,215
APPLICATIONS APPROVED, NOT ACCEPTED
0
$0
2
$102,910
2
$136,070
2
$34,875
1
$113,820
2
$48,995
APPLICATIONS DENIED
2
$99,915
5
$65,298
12
$158,572
5
$35,174
0
$0
5
$56,568
APPLICATIONS WITHDRAWN
0
$0
5
$145,914
6
$137,357
0
$0
0
$0
0
$0
FILES CLOSED FOR INCOMPLETENESS
0
$0
0
$0
3
$125,803
0
$0
0
$0
0
$0
Aggregated Statistics For Year 2006 (Based on 1 partial tract)
A) FHA, FSA/RHS & VA Home Purchase Loans
B) Conventional Home Purchase Loans
C) Refinancings
D) Home Improvement Loans
F) Non-occupant Loans on < 5 Family Dwellings (A B C & D)
G) Loans On Manufactured Home Dwelling (A B C & D)
Number
Average Value
Number
Average Value
Number
Average Value
Number
Average Value
Number
Average Value
Number
Average Value
LOANS ORIGINATED
4
$156,182
22
$96,044
20
$114,806
1
$17,970
2
$137,570
4
$42,148
APPLICATIONS APPROVED, NOT ACCEPTED
0
$0
2
$56,055
2
$101,625
1
$40,650
0
$0
2
$49,635
APPLICATIONS DENIED
0
$0
8
$68,945
15
$121,895
6
$39,010
0
$0
8
$55,360
APPLICATIONS WITHDRAWN
0
$0
2
$137,355
4
$169,555
1
$55,630
0
$0
0
$0
FILES CLOSED FOR INCOMPLETENESS
1
$120,240
0
$0
3
$125,090
0
$0
0
$0
0
$0
Aggregated Statistics For Year 2005 (Based on 1 partial tract)
A) FHA, FSA/RHS & VA Home Purchase Loans
B) Conventional Home Purchase Loans
C) Refinancings
D) Home Improvement Loans
F) Non-occupant Loans on < 5 Family Dwellings (A B C & D)
G) Loans On Manufactured Home Dwelling (A B C & D)
Number
Average Value
Number
Average Value
Number
Average Value
Number
Average Value
Number
Average Value
Number
Average Value
LOANS ORIGINATED
6
$164,242
27
$93,821
22
$94,099
3
$52,060
4
$67,500
5
$40,394
APPLICATIONS APPROVED, NOT ACCEPTED
0
$0
5
$49,208
4
$122,272
1
$100,560
1
$73,600
5
$45,442
APPLICATIONS DENIED
0
$0
7
$55,077
20
$87,313
6
$35,230
0
$0
10
$56,953
APPLICATIONS WITHDRAWN
0
$0
1
$42,790
9
$140,351
2
$70,390
1
$20,970
2
$47,925
FILES CLOSED FOR INCOMPLETENESS
0
$0
0
$0
10
$129,611
0
$0
0
$0
1
$71,460
Aggregated Statistics For Year 2004 (Based on 1 partial tract)
A) FHA, FSA/RHS & VA Home Purchase Loans
B) Conventional Home Purchase Loans
C) Refinancings
D) Home Improvement Loans
F) Non-occupant Loans on < 5 Family Dwellings (A B C & D)
G) Loans On Manufactured Home Dwelling (A B C & D)
Number
Average Value
Number
Average Value
Number
Average Value
Number
Average Value
Number
Average Value
Number
Average Value
LOANS ORIGINATED
6
$134,003
16
$95,074
24
$106,172
2
$26,745
4
$75,418
6
$44,288
APPLICATIONS APPROVED, NOT ACCEPTED
0
$0
3
$107,260
8
$135,751
0
$0
0
$0
1
$72,740
APPLICATIONS DENIED
0
$0
9
$67,418
18
$110,683
4
$55,628
0
$0
7
$39,367
APPLICATIONS WITHDRAWN
0
$0
4
$92,105
8
$134,200
0
$0
0
$0
0
$0
FILES CLOSED FOR INCOMPLETENESS
0
$0
1
$68,040
6
$119,955
0
$0
0
$0
0
$0
Aggregated Statistics For Year 2003 (Based on 1 partial tract)
A) FHA, FSA/RHS & VA Home Purchase Loans
B) Conventional Home Purchase Loans
C) Refinancings
D) Home Improvement Loans
F) Non-occupant Loans on < 5 Family Dwellings (A B C & D)
Number
Average Value
Number
Average Value
Number
Average Value
Number
Average Value
Number
Average Value
LOANS ORIGINATED
1
$175,010
13
$76,923
32
$103,565
1
$96,710
4
$76,700
APPLICATIONS APPROVED, NOT ACCEPTED
0
$0
2
$61,405
5
$104,494
0
$0
0
$0
APPLICATIONS DENIED
0
$0
9
$51,158
18
$92,308
3
$93,140
0
$0
APPLICATIONS WITHDRAWN
0
$0
3
$98,133
9
$98,464
0
$0
0
$0
FILES CLOSED FOR INCOMPLETENESS
0
$0
0
$0
3
$80,587
0
$0
0
$0
Aggregated Statistics For Year 1999 (Based on 1 partial tract)
A) FHA, FSA/RHS & VA Home Purchase Loans
B) Conventional Home Purchase Loans
C) Refinancings
D) Home Improvement Loans
F) Non-occupant Loans on < 5 Family Dwellings (A B C & D)


 Nearest zip codes: 35469, 35463, 35446, 35466, 35462, 35401.


