Estimated zip code population in 2022: 9,319 Zip code population in 2010: 8,345 Zip code population in 2000: 6,861
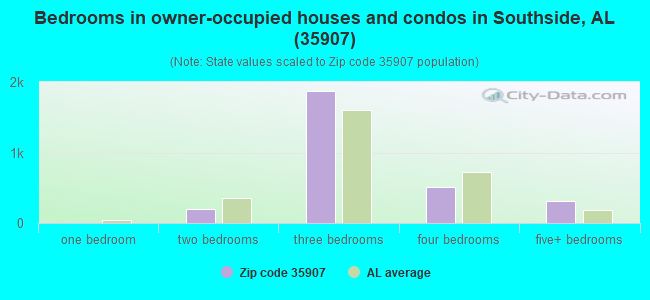
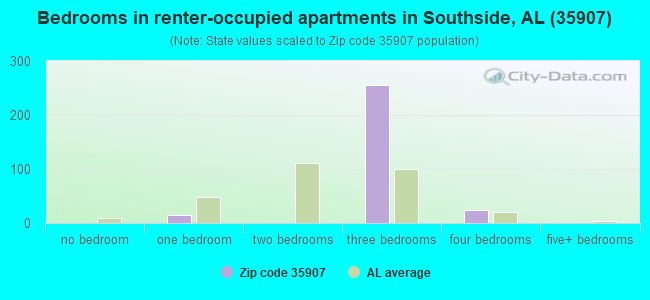
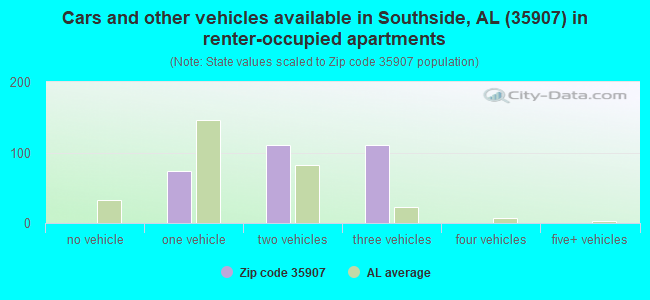
Houses and condos: 3,429 Renter-occupied apartments: 294
% of renters here:
9%
State:
30%
March 2022 cost of living index in zip code 35907: 82.5 (low, U.S. average is 100)
Land area: 22.3 sq. mi. Water area: 2.8 sq. mi.
Population density: 418 people per square mile
(low).
OSM Map
General Map
Google Map
MSN Map
OSM Map
General Map
Google Map
MSN Map
OSM Map
General Map
Google Map
MSN Map
OSM Map
General Map
Google Map
MSN Map
Please wait while loading the map...
Real estate property taxes paid for housing units in 2022:
This zip code:
0.4% ($847)
Alabama:
0.4% ($718)
Median real estate property taxes paid for housing units with mortgages in 2022: $934 (0.4%) Median real estate property taxes paid for housing units with no mortgage in 2022: $784 (0.4%)
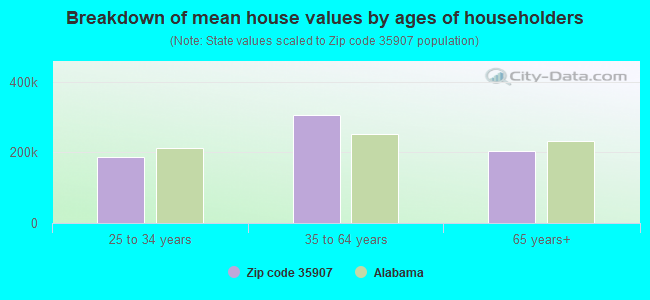
Estimated median house/condo value in 2022: $210,083
35907:
$210,083
Alabama:
$200,900
According to our research of Alabama and other state lists, there were 4 registered sex offenders living in 35907 zip code as of May 22, 2024. The ratio of all residents to sex offenders in zip code 35907 is 2,115 to 1. The ratio of registered sex offenders to all residents in this zip code is much lower than the state average.
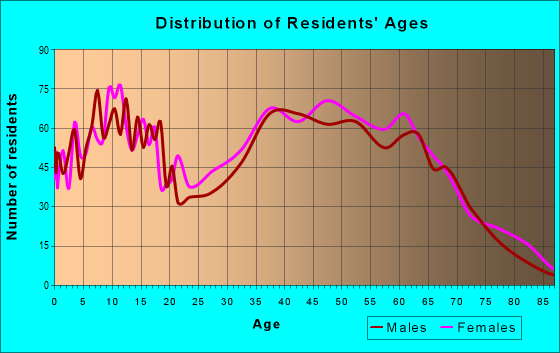
Median resident age:
This zip code:
41.5 years
Alabama median age:
39.6 years
Average household size:
This zip code:
2.9 people
Alabama:
2.5 people
Averages for the 2020 tax year for zip code 35907, filed in 2021:
Average Adjusted Gross Income (AGI) in 2020: $68,819 (Individual Income Tax Returns)
Here:
$68,819
State:
$63,984
Salary/wage: $60,829 (reported on 79.7% of returns)
Here:
$60,829
State:
$52,834
(% of AGI for various income ranges: 1047.5% for AGIs below $25k, 3285.7% for AGIs $25k-50k, 6205.5% for AGIs $50k-75k, 9003.2% for AGIs $75k-100k, 16859.3% for AGIs $100k-200k, 77807.5% for AGIs over 200k)
Taxable interest for individuals: $1,590 (reported on 34.3% of returns)
This zip code:
$1,590
Alabama:
$1,615
(% of AGI for various income ranges: 22.3% for AGIs below $25k, 43.3% for AGIs $25k-50k, 89.6% for AGIs $50k-75k, 53.2% for AGIs $75k-100k, 73.9% for AGIs $100k-200k, 2037.5% for AGIs over 200k)
Ordinary dividends: $4,294 (reported on 15.2% of returns)
Here:
$4,294
State:
$7,660
(% of AGI for various income ranges: 16.5% for AGIs below $25k, 33.1% for AGIs $25k-50k, 56.9% for AGIs $50k-75k, 67.6% for AGIs $75k-100k, 131.8% for AGIs $100k-200k, 3070.0% for AGIs over 200k)
Net capital gain/loss in AGI: +$10,011 (reported on 13.8% of returns)
Here:
+$10,011
State:
+$23,528
(% of AGI for various income ranges: 45.7% for AGIs $25k-50k, 76.5% for AGIs $50k-75k, 83.4% for AGIs $75k-100k, 320.9% for AGIs $100k-200k, 8300.0% for AGIs over 200k)
Profit/loss from business: +$11,058 (reported on 17.6% of returns)
Here:
+$11,058
State:
+$9,534
(% of AGI for various income ranges: 156.2% for AGIs below $25k, 91.8% for AGIs $25k-50k, 127.6% for AGIs $50k-75k, 274.5% for AGIs $75k-100k, 485.7% for AGIs $100k-200k, 5850.0% for AGIs over 200k)
Taxable individual retirement arrangement distribution: $14,998 (reported on 10.9% of returns)
35907:
$14,998
Alabama:
$19,004
(% of AGI for various income ranges: 92.9% for AGIs below $25k, 128.1% for AGIs $25k-50k, 236.7% for AGIs $50k-75k, 307.6% for AGIs $75k-100k, 632.3% for AGIs $100k-200k)
Total itemized deductions: $28,956 (reported on 7.7% of returns)
Here:
$28,956
State:
$37,338
(% of AGI for various income ranges: 191.0% for AGIs $25k-50k, 213.7% for AGIs $50k-75k, 336.3% for AGIs $75k-100k, 701.4% for AGIs $100k-200k, 6437.5% for AGIs over 200k)
Charity contributions: $11,867 (reported on 6.5% of returns)
Here:
$11,867
State:
$18,005
(% of AGI for various income ranges: 34.8% for AGIs $25k-50k, 56.7% for AGIs $50k-75k, 83.4% for AGIs $75k-100k, 228.9% for AGIs $100k-200k, 3422.5% for AGIs over 200k)
Taxes paid: $6,226 (reported on 7.5% of returns)
35907:
$6,226
State:
$6,484
(% of AGI for various income ranges: 19.9% for AGIs $25k-50k, 39.8% for AGIs $50k-75k, 68.2% for AGIs $75k-100k, 176.6% for AGIs $100k-200k, 1415.0% for AGIs over 200k)
Earned income credit: $2,090 (reported on 11.6% of returns)
Here:
$2,090
State:
$2,628
(% of AGI for various income ranges: 71.9% for AGIs below $25k, 59.6% for AGIs $25k-50k)
Percentage of individuals using paid preparers for their 2020 taxes: 95.7%
Here:
96%
State:
93%
(% for various income ranges: 94.9% for AGIs below $25k, 95.4% for AGIs $25k-50k, 95.5% for AGIs $50k-75k, 96.3% for AGIs $75k-100k, 95.9% for AGIs $100k-200k, 100.0% for AGIs over 200k)
Averages for the 2012 tax year for zip code 35907, filed in 2013:
Average Adjusted Gross Income (AGI) in 2012: $57,896 (Individual Income Tax Returns)
Here:
$57,896
State:
$52,001
Salary/wage: $52,444 (reported on 83.4% of returns)
Here:
$52,444
State:
$43,822
(% of AGI for various income ranges: 68.0% for AGIs below $25k, 73.8% for AGIs $25k-50k, 77.4% for AGIs $50k-75k, 80.9% for AGIs $75k-100k, 80.2% for AGIs $100k-200k, 55.8% for AGIs over 200k)
Taxable interest for individuals: $1,236 (reported on 36.8% of returns)
This zip code:
$1,236
Alabama:
$1,592
(% of AGI for various income ranges: 2.0% for AGIs below $25k, 0.9% for AGIs $25k-50k, 0.4% for AGIs $50k-75k, 0.6% for AGIs $75k-100k, 0.5% for AGIs $100k-200k, 1.8% for AGIs over 200k)
Ordinary dividends: $2,894 (reported on 14.7% of returns)
Here:
$2,894
State:
$5,697
(% of AGI for various income ranges: 1.0% for AGIs below $25k, 0.9% for AGIs $25k-50k, 0.7% for AGIs $50k-75k, 0.3% for AGIs $75k-100k, 0.6% for AGIs $100k-200k, 1.5% for AGIs over 200k)
Net capital gain/loss in AGI: +$3,054 (reported on 10.6% of returns)
Here:
+$3,054
State:
+$13,286
(% of AGI for various income ranges: 0.3% for AGIs $50k-75k, 0.2% for AGIs $75k-100k, 1.0% for AGIs $100k-200k, 1.6% for AGIs over 200k)
Profit/loss from business: +$12,641 (reported on 18.0% of returns)
Here:
+$12,641
State:
+$9,151
(% of AGI for various income ranges: 6.1% for AGIs below $25k, 3.7% for AGIs $25k-50k, 3.0% for AGIs $50k-75k, 1.6% for AGIs $75k-100k, 2.9% for AGIs $100k-200k, 11.8% for AGIs over 200k)
Taxable individual retirement arrangement distribution: $13,286 (reported on 9.8% of returns)
35907:
$13,286
Alabama:
$14,992
(% of AGI for various income ranges: 4.0% for AGIs below $25k, 2.6% for AGIs $25k-50k, 2.0% for AGIs $50k-75k, 2.1% for AGIs $75k-100k, 2.7% for AGIs $100k-200k)
Total itemized deductions: $19,219 (22% of AGI, reported on 40.9% of returns)
Here:
$19,219
State:
$21,388
Here:
21.7% of AGI
State:
20.1% of AGI
(% of AGI for various income ranges: 12.6% for AGIs below $25k, 13.5% for AGIs $25k-50k, 12.1% for AGIs $50k-75k, 14.9% for AGIs $75k-100k, 14.6% for AGIs $100k-200k, 11.4% for AGIs over 200k)
Charity contributions: $4,298 (reported on 36.0% of returns)
Here:
$4,298
State:
$5,925
(% of AGI for various income ranges: 1.5% for AGIs below $25k, 2.1% for AGIs $25k-50k, 2.2% for AGIs $50k-75k, 3.1% for AGIs $75k-100k, 3.2% for AGIs $100k-200k, 2.8% for AGIs over 200k)
Taxes paid: $5,325 (reported on 40.6% of returns)
35907:
$5,325
State:
$5,272
(% of AGI for various income ranges: 1.3% for AGIs below $25k, 2.3% for AGIs $25k-50k, 2.8% for AGIs $50k-75k, 4.9% for AGIs $75k-100k, 4.6% for AGIs $100k-200k, 4.3% for AGIs over 200k)
Earned income credit: $2,143 (reported on 15.3% of returns)
Here:
$2,143
State:
$2,646
(% of AGI for various income ranges: 6.0% for AGIs below $25k, 1.2% for AGIs $25k-50k)
Percentage of individuals using paid preparers for their 2012 taxes: 65.9%
Here:
66%
State:
60%
(% for various income ranges: 58.8% for AGIs below $25k, 67.9% for AGIs $25k-50k, 67.7% for AGIs $50k-75k, 71.4% for AGIs $75k-100k, 69.4% for AGIs $100k-200k, 83.3% for AGIs over 200k)
Averages for the 2004 tax year for zip code 35907, filed in 2005:
Average Adjusted Gross Income (AGI) in 2004: $46,002 (Individual Income Tax Returns)
Here:
$46,002
State:
$42,302
Salary/wage: $43,998 (reported on 84.2% of returns)
Here:
$43,998
State:
$36,626
(% of AGI for various income ranges: 110.7% for AGIs below $10k, 69.3% for AGIs $10k-25k, 78.0% for AGIs $25k-50k, 84.9% for AGIs $50k-75k, 87.0% for AGIs $75k-100k, 73.9% for AGIs over 100k)
Taxable interest for individuals: $1,164 (reported on 48.5% of returns)
This zip code:
$1,164
Alabama:
$1,827
(% of AGI for various income ranges: 6.0% for AGIs below $10k, 3.6% for AGIs $10k-25k, 1.3% for AGIs $25k-50k, 0.8% for AGIs $50k-75k, 0.7% for AGIs $75k-100k, 1.0% for AGIs over 100k)
Taxable dividends: $1,947 (reported on 17.6% of returns)
Here:
$1,947
State:
$4,206
(% of AGI for various income ranges: 2.5% for AGIs below $10k, 0.9% for AGIs $10k-25k, 0.7% for AGIs $25k-50k, 0.4% for AGIs $50k-75k, 0.4% for AGIs $75k-100k, 1.3% for AGIs over 100k)
Net capital gain/loss: +$4,559 (reported on 13.1% of returns)
Here:
+$4,559
State:
+$13,031
(% of AGI for various income ranges: 0.9% for AGIs below $10k, -0.6% for AGIs $10k-25k, 0.9% for AGIs $25k-50k, 0.6% for AGIs $50k-75k, 0.8% for AGIs $75k-100k, 3.4% for AGIs over 100k)
Profit/loss from business: +$9,674 (reported on 18.4% of returns)
Here:
+$9,674
State:
+$8,302
(% of AGI for various income ranges: 8.5% for AGIs below $10k, 5.0% for AGIs $10k-25k, 2.3% for AGIs $25k-50k, 2.0% for AGIs $50k-75k, 2.0% for AGIs $75k-100k, 8.2% for AGIs over 100k)
IRA payment deduction: $2,812 (reported on 2.1% of returns)
35907:
$2,812
Alabama:
$3,006
Self-employed pension: $17,133 (reported on 0.5% of returns)
Here:
$17,133
Alabama:
$17,165
Total itemized deductions: $16,467 (23% of AGI, reported on 41.5% of returns)
Here:
$16,467
State:
$17,623
Here:
23.0% of AGI
State:
20.8% of AGI
(% of AGI for various income ranges: 19.3% for AGIs below $10k, 10.7% for AGIs $10k-25k, 14.8% for AGIs $25k-50k, 14.3% for AGIs $50k-75k, 16.9% for AGIs $75k-100k, 14.6% for AGIs over 100k)
Charity contributions deductions: $3,600 (5% of AGI, reported on 38.1% of returns)
Here:
$3,600
State:
$4,768
Here:
4.9% of AGI
State:
5.4% of AGI
(% of AGI for various income ranges: 2.0% for AGIs below $10k, 1.6% for AGIs $10k-25k, 2.5% for AGIs $25k-50k, 2.8% for AGIs $50k-75k, 3.6% for AGIs $75k-100k, 3.5% for AGIs over 100k)
Total tax: $5,606 (reported on 79.4% of returns)
35907:
$5,606
State:
$6,905
(% of AGI for various income ranges: 3.7% for AGIs below $10k, 4.0% for AGIs $10k-25k, 6.1% for AGIs $25k-50k, 7.9% for AGIs $50k-75k, 9.9% for AGIs $75k-100k, 16.5% for AGIs over 100k)
Earned income credit: $1,712 (reported on 12.1% of returns)
Here:
$1,712
State:
$2,048
Percentage of individuals using paid preparers for their 2004 taxes: 70.9%
Here:
71%
State:
65%
(% for various income ranges: 63.6% for AGIs below $10k, 71.6% for AGIs $10k-25k, 73.6% for AGIs $25k-50k, 71.6% for AGIs $50k-75k, 70.6% for AGIs $75k-100k, 74.9% for AGIs over 100k)
Likely homosexual households (counted as self-reported same-sex unmarried-partner households)
Lesbian couples: 0.0% of all households
Gay men: 0.3% of all households
Household received Food Stamps/SNAP in the past 12 months: 28 Household did not receive Food Stamps/SNAP in the past 12 months: 3,136
Women who had a birth in the past 12 months: 85 (97 now married, 0 unmarried) Women who did not have a birth in the past 12 months: 1,652 (906 now married, 743 unmarried)
Housing units in zip code 35907 with a mortgage: 1,647 (47 second mortgage, 24 both second mortgage and home equity loan) Houses without a mortgage: 44
Median monthly owner costs for units with a mortgage: $1,182 Median monthly owner costs for units without a mortgage: $424
Residents with income below the poverty level in 2022:
This zip code:
6.6%
Whole state:
16.2%
Residents with income below 50% of the poverty level in 2022:
This zip code:
3.1%
Whole state:
8.6%
Median number of rooms in houses and condos:
Here:
6.4
State:
6.5
Median number of rooms in apartments:
Here:
6.4
State:
4.7
Notable locations in this zip code not listed on our city pages
Notable locations in zip code 35907: Brown's Farms (A), Southside Fire Department Station 1 (B), Southside Fire Department Station 2 (C). Display/hide their locations on the map
Churches in zip code 35907 include: Pilgrims Rest Missionary Baptist Church (A), Southside United Methodist Church (B), Southside First Baptist Church (C), Southside Baptist Church (D), Green Valley Baptist Church (E), Brannon Springs Missionary Baptist Church (F). Display/hide their locations on the map
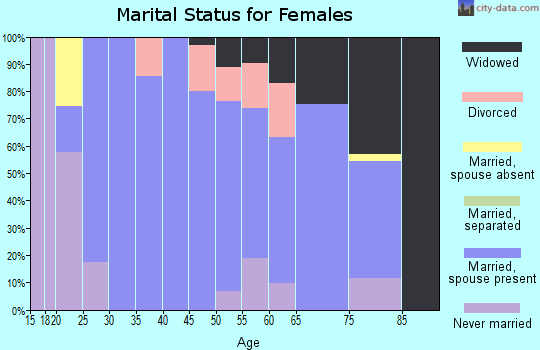
1,381 married couples with children.
334 single-parent households (35 men, 299 women).
97.5% of residents of 35907 zip code speak English at home.
1.8% of residents speak Spanish at home (89% very well, 11% not well).
0.9% of residents speak other language at home (100% very well).
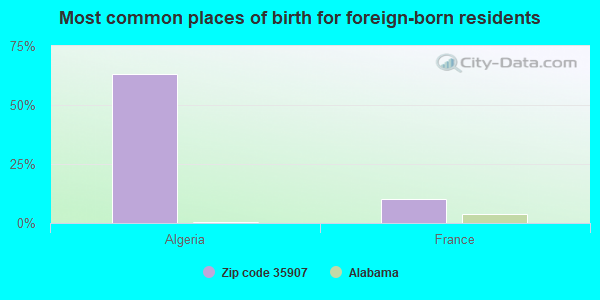
Foreign born population: 92 (1.0%) (74.2% of them are naturalized citizens)
This zip code:
1.0%
Whole state:
3.8%
63%Algeria
10%France
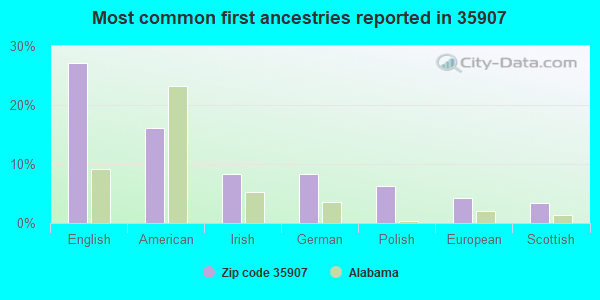
27%English
16%American
8%Irish
8%German
6%Polish
4%European
3%Scottish
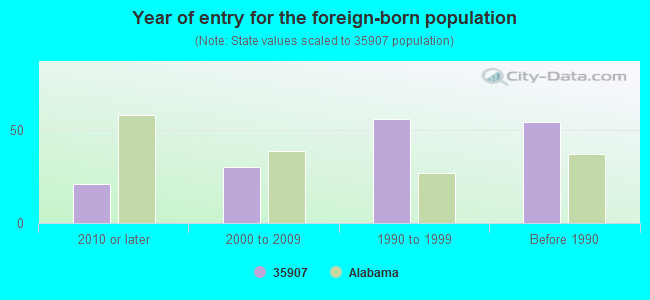
Year of entry for the foreign-born population
212010 or later
302000 to 2009
561990 to 1999
54Before 1990
Facilities with environmental interests located in this zip code:
LOT 17 MOUNTAIN SHADOWS (COBBLESTAR LLC in SOUTHSIDE, AL)
National Pollutant Discharge Elimination System NON-MAJOR (Tracking pollutant discharge elimination systems) - permit Business SIC classification: CONSTRUCTION SAND AND GRAVEL
MEADOWS THE (DAVID RICHARDSON in SOUTHSIDE, AL)
National Pollutant Discharge Elimination System NON-MAJOR (Tracking pollutant discharge elimination systems) - permit Business SIC classification: GENERAL CONTRACTORS-SINGLE-FAMILY HOUSES Alternative names: D RICHARDSON MEADOWS THE
NEW BUCKS ISLAND MARINA (KAANTOMA LLC in SOUTHSIDE, AL)
National Pollutant Discharge Elimination System NON-MAJOR (Tracking pollutant discharge elimination systems) - permit Business SIC classification: HEAVY CONSTRUCTION Alternative names: KAANTOMA LLC NEW BUCKS ISL MAR
Housing units lacking complete plumbing facilities: 0.3% Housing units lacking complete kitchen facilities: 0.6%
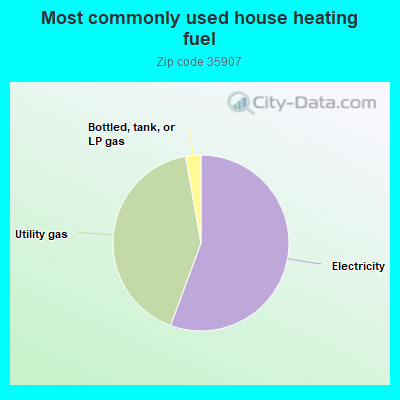
55.7%Electricity
41.6%Utility gas
2.8%Bottled, tank, or LP gas
Place of birth for U.S.-born residents:
This state: 6,212
Northeast: 245
Midwest: 514
South: 1,972
West: 201
67% of the 35907 zip code residents lived in the same house 5 years ago. Out of people who lived in different houses, 70% lived in this county. Out of people who lived in different counties, 50% lived in Alabama.
95% of the 35907 zip code residents lived in the same house 1 year ago. Out of people who lived in different houses, 68% moved from this county. Out of people who lived in different houses, 21% moved from different county within same state. Out of people who lived in different houses, 10% moved from different state.
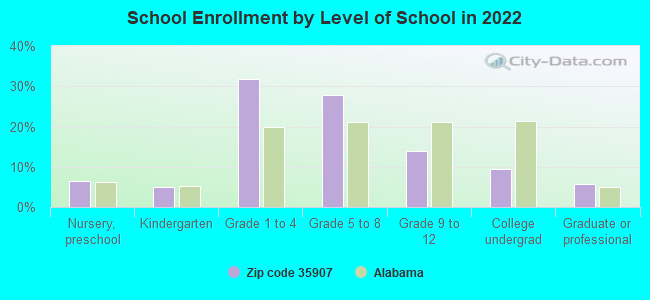
Private vs. public school enrollment:
Students in private schools in grades 1 to 8 (elementary and middle school): 106
Here:
10.2%
Alabama:
14.7%
Students in private schools in grades 9 to 12 (high school): 50
Here:
20.6%
Alabama:
16.3%
Students in private undergraduate colleges:
Here:
0.0%
Alabama:
14.6%
Occupation by median earnings in the past 12 months ($)
71,313Health diagnosing and treating practitioners and other technical occupations
63,070Architecture and engineering occupations
58,227Law enforcement workers including supervisors
55,121Education, training, and library occupations
51,706Production occupations
50,094Installation, maintenance, and repair occupations
Companies with federal contracts located in this zip code:
MARINEONE CORPORATION (4500 HWY 77 in SOUTHSIDE, AL) : $24,352 in 2 contractsin 2005
$12,176 with U.S. Army Corps of Engineers - civil program financing only for Miscellaneous Vessels. Signed on 2005-05-31. Completion date: 2005-09-30.
$12,176 with Army for Miscellaneous Vessels. Signed on 2005-05-31. Completion date: 2005-09-30.
GADSDEN POWER EQUIPMENT (2491 HWY 77 in GADSDEN, AL; small business) : $16,778 in 2 contractsin 2005
$39,778 with Army for Gardening Implements and Tools. Signed on 2005-02-15. Completion date: 2005-03-01.
-$23,000, same as above.Signed on 2005-06-14. Completion date: 2005-03-01.
Top industries in this zip code by the number of employees in 2005:
Accommodation and Food Services: Limited-Service Restaurants (20-49 employees: 2 establishments)
Other Services (except Public Administration): Religious Organizations (10-19: 1, 5-9: 3, 1-4: 2)
Construction: Drywall and Insulation Contractors (20-49: 1, 1-4: 1)
Administrative and Support and Waste Management and Remediation Services: Security Guards and Patrol Services (20-49: 1)
Construction: New Single-Family Housing Construction (except Operative Builders) (10-19: 2, 1-4: 1)
Accommodation and Food Services: Full-Service Restaurants (10-19: 2, 1-4: 1)
Health Care and Social Assistance: Child Day Care Services (10-19: 1, 5-9: 1)
People in group quarters in 2010:
11 people in nursing facilities/skilled-nursing facilities
People in group quarters in 2000:
16 people in other noninstitutional group quarters
Fatal accident statistics in 2014:
Fatal accident count: 1
Vehicles involved in fatal accidents: 1
Fatal accidents caused by drunken drivers: 0
Fatalities: 1
Persons involved in fatal accidents: 1
Pedestrians involved in fatal accidents: 0
Fatal accident statistics in 2013:
Fatal accident count: 1
Vehicles involved in fatal accidents: 1
Fatal accidents caused by drunken drivers: 0
Fatalities: 1
Persons involved in fatal accidents: 1
Pedestrians involved in fatal accidents: 0
Home Mortgage Disclosure Act Aggregated Statistics For Year 2009 (Based on 1 partial tract)
A) FHA, FSA/RHS & VA Home Purchase Loans
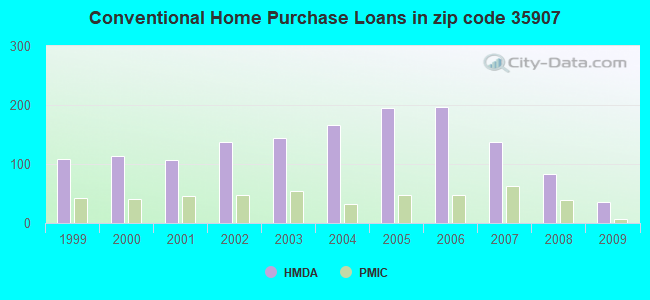
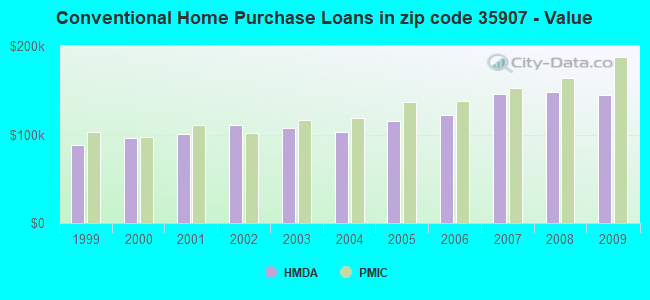
B) Conventional Home Purchase Loans
C) Refinancings
D) Home Improvement Loans
F) Non-occupant Loans on < 5 Family Dwellings (A B C & D)
G) Loans On Manufactured Home Dwelling (A B C & D)
Number
Average Value
Number
Average Value
Number
Average Value
Number
Average Value
Number
Average Value
Number
Average Value
LOANS ORIGINATED
55
$136,188
35
$144,762
197
$143,126
15
$56,394
11
$106,656
4
$34,660
APPLICATIONS APPROVED, NOT ACCEPTED
1
$128,990
3
$205,627
13
$160,920
1
$7,020
0
$0
2
$50,455
APPLICATIONS DENIED
4
$138,865
11
$106,337
71
$144,812
9
$63,764
4
$134,478
7
$45,504
APPLICATIONS WITHDRAWN
2
$100,475
4
$181,202
34
$150,001
1
$120,220
1
$26,320
0
$0
FILES CLOSED FOR INCOMPLETENESS
0
$0
2
$131,625
15
$142,272
1
$70,200
0
$0
0
$0
Aggregated Statistics For Year 2008 (Based on 1 partial tract)
A) FHA, FSA/RHS & VA Home Purchase Loans
B) Conventional Home Purchase Loans
C) Refinancings
D) Home Improvement Loans
F) Non-occupant Loans on < 5 Family Dwellings (A B C & D)
G) Loans On Manufactured Home Dwelling (A B C & D)
Number
Average Value
Number
Average Value
Number
Average Value
Number
Average Value
Number
Average Value
Number
Average Value
LOANS ORIGINATED
45
$118,872
83
$148,266
144
$151,637
25
$46,718
25
$119,164
2
$40,365
APPLICATIONS APPROVED, NOT ACCEPTED
0
$0
4
$89,725
11
$125,004
4
$26,762
1
$64,060
3
$68,443
APPLICATIONS DENIED
6
$119,487
12
$103,398
82
$160,176
12
$44,168
4
$116,488
9
$47,678
APPLICATIONS WITHDRAWN
2
$142,595
8
$165,299
31
$155,685
2
$89,065
1
$76,340
0
$0
FILES CLOSED FOR INCOMPLETENESS
1
$102,670
2
$146,980
6
$130,747
2
$24,130
2
$146,980
0
$0
Aggregated Statistics For Year 2007 (Based on 1 partial tract)
A) FHA, FSA/RHS & VA Home Purchase Loans
B) Conventional Home Purchase Loans
C) Refinancings
D) Home Improvement Loans
F) Non-occupant Loans on < 5 Family Dwellings (A B C & D)
G) Loans On Manufactured Home Dwelling (A B C & D)
Number
Average Value
Number
Average Value
Number
Average Value
Number
Average Value
Number
Average Value
Number
Average Value
LOANS ORIGINATED
24
$77,000
137
$145,671
158
$129,065
24
$47,568
18
$131,186
5
$37,382
APPLICATIONS APPROVED, NOT ACCEPTED
3
$58,500
11
$115,272
25
$117,374
2
$22,815
1
$198,320
3
$40,950
APPLICATIONS DENIED
6
$143,325
24
$108,371
73
$133,380
17
$49,346
3
$105,883
4
$67,788
APPLICATIONS WITHDRAWN
1
$103,540
5
$144,086
33
$158,428
3
$64,933
1
$92,140
0
$0
FILES CLOSED FOR INCOMPLETENESS
1
$2,630
8
$124,605
8
$129,211
0
$0
1
$238,680
0
$0
Aggregated Statistics For Year 2006 (Based on 1 partial tract)
A) FHA, FSA/RHS & VA Home Purchase Loans
B) Conventional Home Purchase Loans
C) Refinancings
D) Home Improvement Loans
F) Non-occupant Loans on < 5 Family Dwellings (A B C & D)
G) Loans On Manufactured Home Dwelling (A B C & D)
Number
Average Value
Number
Average Value
Number
Average Value
Number
Average Value
Number
Average Value
Number
Average Value
LOANS ORIGINATED
15
$132,269
197
$122,044
186
$116,005
25
$39,452
30
$108,108
5
$54,580
APPLICATIONS APPROVED, NOT ACCEPTED
0
$0
8
$106,835
24
$93,235
4
$42,340
3
$71,953
2
$26,325
APPLICATIONS DENIED
1
$121,100
22
$100,952
75
$119,983
23
$57,953
1
$26,320
5
$73,534
APPLICATIONS WITHDRAWN
0
$0
13
$118,530
57
$120,033
4
$87,092
3
$122,850
0
$0
FILES CLOSED FOR INCOMPLETENESS
1
$84,240
7
$151,180
26
$132,975
1
$23,690
0
$0
0
$0
Aggregated Statistics For Year 2005 (Based on 1 partial tract)
A) FHA, FSA/RHS & VA Home Purchase Loans
B) Conventional Home Purchase Loans
C) Refinancings
D) Home Improvement Loans
F) Non-occupant Loans on < 5 Family Dwellings (A B C & D)
G) Loans On Manufactured Home Dwelling (A B C & D)
Number
Average Value
Number
Average Value
Number
Average Value
Number
Average Value
Number
Average Value
Number
Average Value
LOANS ORIGINATED
6
$117,438
195
$115,281
171
$111,278
23
$43,112
32
$108,700
5
$45,980
APPLICATIONS APPROVED, NOT ACCEPTED
1
$94,770
9
$98,864
26
$92,644
4
$19,962
0
$0
1
$53,530
APPLICATIONS DENIED
1
$57,910
25
$97,087
92
$118,300
18
$43,339
3
$61,133
3
$66,690
APPLICATIONS WITHDRAWN
0
$0
13
$117,248
68
$122,372
8
$92,796
3
$49,723
2
$70,640
FILES CLOSED FOR INCOMPLETENESS
0
$0
6
$122,850
20
$109,775
0
$0
1
$109,690
0
$0
Aggregated Statistics For Year 2004 (Based on 1 partial tract)
A) FHA, FSA/RHS & VA Home Purchase Loans
B) Conventional Home Purchase Loans
C) Refinancings
D) Home Improvement Loans
F) Non-occupant Loans on < 5 Family Dwellings (A B C & D)
G) Loans On Manufactured Home Dwelling (A B C & D)
Number
Average Value
Number
Average Value
Number
Average Value
Number
Average Value
Number
Average Value
Number
Average Value
LOANS ORIGINATED
8
$114,404
166
$102,805
194
$111,533
14
$34,661
18
$96,330
8
$45,410
APPLICATIONS APPROVED, NOT ACCEPTED
0
$0
8
$109,359
31
$109,574
2
$43,875
2
$44,315
3
$47,387
APPLICATIONS DENIED
0
$0
17
$71,232
77
$104,821
15
$47,502
5
$52,124
5
$53,352
APPLICATIONS WITHDRAWN
0
$0
6
$121,095
36
$110,004
6
$68,592
4
$77,878
0
$0
FILES CLOSED FOR INCOMPLETENESS
0
$0
2
$101,350
42
$138,750
3
$64,933
1
$107,050
2
$62,300
Aggregated Statistics For Year 2003 (Based on 1 partial tract)
A) FHA, FSA/RHS & VA Home Purchase Loans
B) Conventional Home Purchase Loans
C) Refinancings
D) Home Improvement Loans
F) Non-occupant Loans on < 5 Family Dwellings (A B C & D)
Number
Average Value
Number
Average Value
Number
Average Value
Number
Average Value
Number
Average Value
LOANS ORIGINATED
10
$113,812
144
$107,628
347
$109,260
16
$28,848
27
$66,560
APPLICATIONS APPROVED, NOT ACCEPTED
0
$0
9
$117,390
34
$114,952
2
$7,895
2
$69,320
APPLICATIONS DENIED
0
$0
7
$60,673
95
$96,931
7
$39,613
1
$125,480
APPLICATIONS WITHDRAWN
0
$0
6
$138,352
36
$98,036
1
$119,340
3
$62,303
FILES CLOSED FOR INCOMPLETENESS
0
$0
0
$0
15
$118,755
0
$0
3
$57,330
Aggregated Statistics For Year 2002 (Based on 1 partial tract)
A) FHA, FSA/RHS & VA Home Purchase Loans
B) Conventional Home Purchase Loans
C) Refinancings
D) Home Improvement Loans
F) Non-occupant Loans on < 5 Family Dwellings (A B C & D)
Number
Average Value
Number
Average Value
Number
Average Value
Number
Average Value
Number
Average Value
LOANS ORIGINATED
12
$101,424
138
$110,692
248
$101,896
16
$29,506
14
$63,869
APPLICATIONS APPROVED, NOT ACCEPTED
0
$0
4
$61,205
27
$97,597
1
$13,160
5
$83,538
APPLICATIONS DENIED
2
$70,200
16
$75,959
62
$81,565
7
$13,539
3
$52,650
APPLICATIONS WITHDRAWN
1
$126,360
3
$100,033
19
$88,812
2
$83,360
0
$0
FILES CLOSED FOR INCOMPLETENESS
0
$0
4
$111,002
21
$128,073
0
$0
1
$55,280
Aggregated Statistics For Year 2001 (Based on 1 partial tract)
A) FHA, FSA/RHS & VA Home Purchase Loans
B) Conventional Home Purchase Loans
C) Refinancings
D) Home Improvement Loans
F) Non-occupant Loans on < 5 Family Dwellings (A B C & D)
Number
Average Value
Number
Average Value
Number
Average Value
Number
Average Value
Number
Average Value
LOANS ORIGINATED
7
$117,710
107
$100,461
253
$92,921
32
$25,256
11
$68,125
APPLICATIONS APPROVED, NOT ACCEPTED
0
$0
16
$82,540
28
$68,570
2
$10,090
3
$26,033
APPLICATIONS DENIED
0
$0
14
$68,696
56
$86,465
4
$15,138
1
$168,480
APPLICATIONS WITHDRAWN
0
$0
4
$113,418
27
$74,230
0
$0
1
$67,570
FILES CLOSED FOR INCOMPLETENESS
1
$117,580
0
$0
13
$94,432
0
$0
0
$0
Aggregated Statistics For Year 2000 (Based on 1 partial tract)
A) FHA, FSA/RHS & VA Home Purchase Loans
B) Conventional Home Purchase Loans
C) Refinancings
D) Home Improvement Loans
F) Non-occupant Loans on < 5 Family Dwellings (A B C & D)
Number
Average Value
Number
Average Value
Number
Average Value
Number
Average Value
Number
Average Value
LOANS ORIGINATED
16
$97,074
114
$95,878
72
$77,330
22
$14,598
11
$45,710
APPLICATIONS APPROVED, NOT ACCEPTED
0
$0
13
$53,865
9
$57,622
3
$31,297
1
$80,730
APPLICATIONS DENIED
4
$55,502
40
$122,104
32
$71,736
9
$8,678
1
$51,770
APPLICATIONS WITHDRAWN
1
$76,340
3
$54,990
14
$62,741
1
$17,550
0
$0
FILES CLOSED FOR INCOMPLETENESS
0
$0
5
$63,882
9
$57,038
0
$0
0
$0
Aggregated Statistics For Year 1999 (Based on 1 partial tract)
A) FHA, FSA/RHS & VA Home Purchase Loans
B) Conventional Home Purchase Loans
C) Refinancings
D) Home Improvement Loans
F) Non-occupant Loans on < 5 Family Dwellings (A B C & D)
Detailed PMIC statistics for the following Tracts:0105.01
2004 - 2018 National Fire Incident Reporting System (NFIRS) incidents
Based on the data from the years 2004 - 2018 the average number of fires per year is 9. The highest number of reported fires - 35 took place in 2017, and the least - 0 in 2005. The data has a growing trend.
When looking into fire subcategories, the most reports belonged to: Outside Fires (52.2%), and Structure Fires (29.9%).
Fire incident types reported to NFIRS in Zip Code 35907
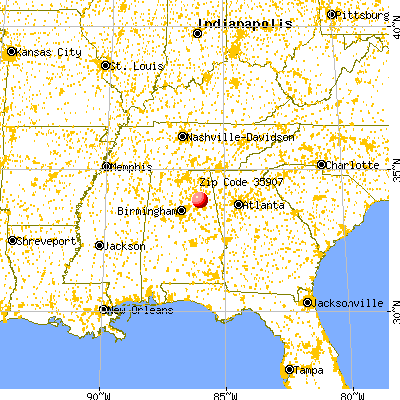


 Nearest zip codes: 35906, 36271, 35905, 36279, 36250, 35901.


 Based on the data from the years 2004 - 2018 the average number of fires per year is 9. The highest number of reported fires - 35 took place in 2017, and the least - 0 in 2005. The data has a growing trend.
 When looking into fire subcategories, the most reports belonged to: Outside Fires (52.2%), and Structure Fires (29.9%).