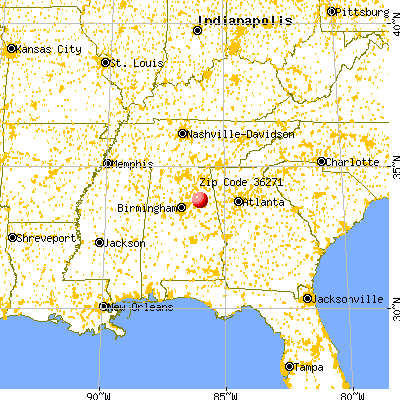
Estimated zip code population in 2022: 6,162 Zip code population in 2010: 6,023 Zip code population in 2000: 5,645
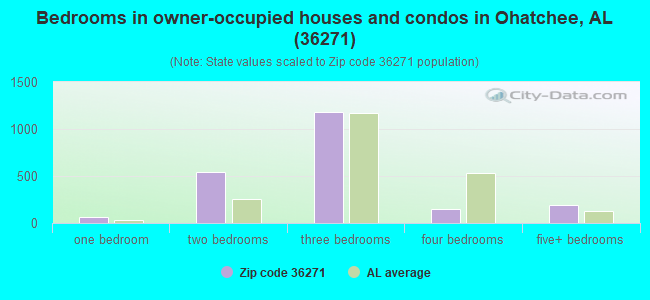
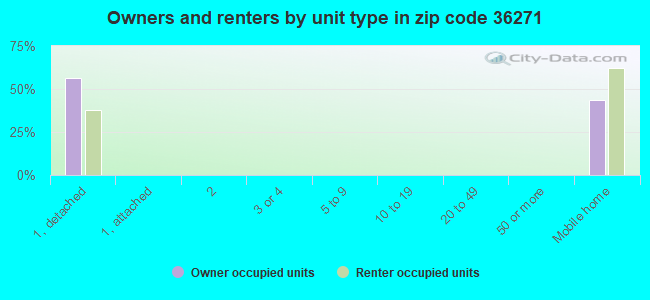
Houses and condos: 2,767 Renter-occupied apartments: 204
% of renters here:
9%
State:
30%
March 2022 cost of living index in zip code 36271: 80.9 (low, U.S. average is 100)
Land area: 82.0 sq. mi. Water area: 3.1 sq. mi.
Population density: 75 people per square mile
(very low).
OSM Map
General Map
Google Map
MSN Map
OSM Map
General Map
Google Map
MSN Map
OSM Map
General Map
Google Map
MSN Map
OSM Map
General Map
Google Map
MSN Map
Please wait while loading the map...
Real estate property taxes paid for housing units in 2022:
This zip code:
0.2% ($393)
Alabama:
0.4% ($718)
Median real estate property taxes paid for housing units with mortgages in 2022: $408 (0.2%) Median real estate property taxes paid for housing units with no mortgage in 2022: $355 (0.3%)
Business Search- 14 Million verified businesses
Males: 2,896
(47.0%)
Females: 3,265
(53.0%)
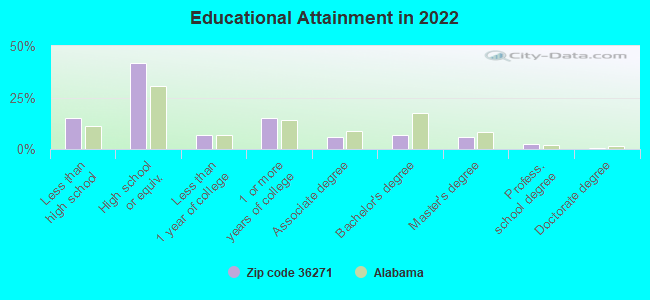
For population 25 years and over in 36271:
High school or higher: 83.6%
Bachelor's degree or higher: 15.1%
Graduate or professional degree: 8.6%
Unemployed: 9.5%
Mean travel time to work (commute): 32.4 minutes
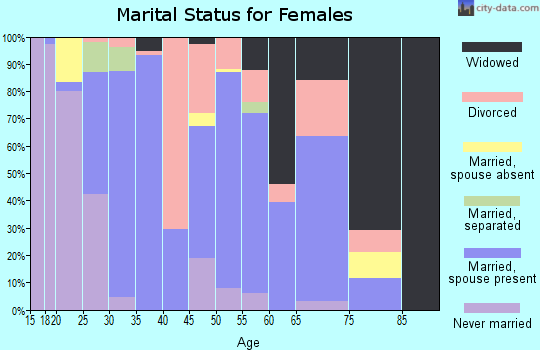
For population 15 years and over in 36271:
Never married: 21.0%
Now married: 55.9%
Separated: 1.8%
Widowed: 5.6%
Divorced: 15.7%
Zip code 36271 compared to state average:
Unemployed percentage above state average.
Black race population percentage significantly below state average.
Median age above state average.
Foreign-born population percentage significantly below state average.
Renting percentage significantly below state average.
Length of stay since moving in significantly above state average.
Number of college students significantly below state average.
Percentage of population with a bachelor's degree or higher below state average.
Averages for the 2020 tax year for zip code 36271, filed in 2021:
Average Adjusted Gross Income (AGI) in 2020: $52,014 (Individual Income Tax Returns)
Here:
$52,014
State:
$63,984
Salary/wage: $45,953 (reported on 81.0% of returns)
Here:
$45,953
State:
$52,834
(% of AGI for various income ranges: 1099.2% for AGIs below $25k, 3571.3% for AGIs $25k-50k, 6247.0% for AGIs $50k-75k, 9378.0% for AGIs $75k-100k, 14540.0% for AGIs $100k-200k)
Taxable interest for individuals: $810 (reported on 26.5% of returns)
This zip code:
$810
Alabama:
$1,615
(% of AGI for various income ranges: 5.8% for AGIs below $25k, 15.9% for AGIs $25k-50k, 24.2% for AGIs $50k-75k, 33.5% for AGIs $75k-100k, 95.6% for AGIs $100k-200k)
Ordinary dividends: $7,762 (reported on 9.7% of returns)
Here:
$7,762
State:
$7,660
(% of AGI for various income ranges: 5.2% for AGIs below $25k, 14.3% for AGIs $25k-50k, 21.8% for AGIs $50k-75k, 121.5% for AGIs $75k-100k, 882.8% for AGIs $100k-200k)
Net capital gain/loss in AGI: +$8,548 (reported on 7.8% of returns)
Here:
+$8,548
State:
+$23,528
(% of AGI for various income ranges: 24.6% for AGIs $25k-50k, 25.8% for AGIs $50k-75k, 55.0% for AGIs $75k-100k, 815.0% for AGIs $100k-200k)
Profit/loss from business: +$7,278 (reported on 15.3% of returns)
Here:
+$7,278
State:
+$9,534
(% of AGI for various income ranges: 159.0% for AGIs below $25k, 118.1% for AGIs $25k-50k, 77.3% for AGIs $50k-75k, 155.5% for AGIs $75k-100k, 361.7% for AGIs $100k-200k)
Taxable individual retirement arrangement distribution: $12,228 (reported on 6.7% of returns)
36271:
$12,228
Alabama:
$19,004
(% of AGI for various income ranges: 36.3% for AGIs below $25k, 83.7% for AGIs $25k-50k, 117.0% for AGIs $50k-75k, 216.5% for AGIs $75k-100k, 373.3% for AGIs $100k-200k)
Total itemized deductions: $26,345 (reported on 4.1% of returns)
Here:
$26,345
State:
$37,338
(% of AGI for various income ranges: 183.0% for AGIs $25k-50k, 192.1% for AGIs $50k-75k, 708.9% for AGIs $100k-200k)
Charity contributions: $12,545 (reported on 4.1% of returns)
Here:
$12,545
State:
$18,005
(% of AGI for various income ranges: 106.3% for AGIs $25k-50k, 71.8% for AGIs $50k-75k, 316.1% for AGIs $100k-200k)
Taxes paid: $5,625 (reported on 3.0% of returns)
36271:
$5,625
State:
$6,484
(% of AGI for various income ranges: 41.2% for AGIs $50k-75k, 174.4% for AGIs $100k-200k)
Earned income credit: $2,469 (reported on 20.1% of returns)
Here:
$2,469
State:
$2,628
(% of AGI for various income ranges: 126.2% for AGIs below $25k, 80.9% for AGIs $25k-50k)
Percentage of individuals using paid preparers for their 2020 taxes: 92.9%
Here:
93%
State:
93%
(% for various income ranges: 93.5% for AGIs below $25k, 90.0% for AGIs $25k-50k, 93.2% for AGIs $50k-75k, 93.1% for AGIs $75k-100k, 96.4% for AGIs $100k-200k, 100.0% for AGIs over 200k)
Averages for the 2012 tax year for zip code 36271, filed in 2013:
Average Adjusted Gross Income (AGI) in 2012: $44,522 (Individual Income Tax Returns)
Here:
$44,522
State:
$52,001
Salary/wage: $40,790 (reported on 81.7% of returns)
Here:
$40,790
State:
$43,822
(% of AGI for various income ranges: 70.5% for AGIs below $25k, 78.7% for AGIs $25k-50k, 79.5% for AGIs $50k-75k, 82.1% for AGIs $75k-100k, 64.0% for AGIs $100k-200k)
Taxable interest for individuals: $667 (reported on 28.1% of returns)
This zip code:
$667
Alabama:
$1,592
(% of AGI for various income ranges: 0.8% for AGIs below $25k, 0.4% for AGIs $25k-50k, 0.2% for AGIs $50k-75k, 0.3% for AGIs $75k-100k, 0.6% for AGIs $100k-200k)
Ordinary dividends: $6,526 (reported on 9.8% of returns)
Here:
$6,526
State:
$5,697
(% of AGI for various income ranges: 0.5% for AGIs below $25k, 0.2% for AGIs $25k-50k, 0.3% for AGIs $50k-75k, 0.3% for AGIs $75k-100k, 4.8% for AGIs $100k-200k)
Net capital gain/loss in AGI: +$1,821 (reported on 6.0% of returns)
Here:
+$1,821
State:
+$13,286
(% of AGI for various income ranges: 0.1% for AGIs $50k-75k, 1.0% for AGIs $100k-200k)
Profit/loss from business: +$5,935 (reported on 15.7% of returns)
Here:
+$5,935
State:
+$9,151
(% of AGI for various income ranges: 9.4% for AGIs below $25k, 2.0% for AGIs $25k-50k, 1.1% for AGIs $50k-75k, 1.6% for AGIs $75k-100k, 0.1% for AGIs $100k-200k)
Taxable individual retirement arrangement distribution: $10,388 (reported on 6.8% of returns)
36271:
$10,388
Alabama:
$14,992
(% of AGI for various income ranges: 2.0% for AGIs below $25k, 1.2% for AGIs $25k-50k, 2.8% for AGIs $50k-75k, 1.6% for AGIs $100k-200k)
Total itemized deductions: $17,698 (23% of AGI, reported on 22.6% of returns)
Here:
$17,698
State:
$21,388
Here:
22.7% of AGI
State:
20.1% of AGI
(% of AGI for various income ranges: 8.1% for AGIs below $25k, 7.1% for AGIs $25k-50k, 9.3% for AGIs $50k-75k, 8.6% for AGIs $75k-100k, 10.9% for AGIs $100k-200k)
Charity contributions: $4,061 (reported on 18.7% of returns)
Here:
$4,061
State:
$5,925
(% of AGI for various income ranges: 1.0% for AGIs below $25k, 1.1% for AGIs $25k-50k, 1.5% for AGIs $50k-75k, 2.1% for AGIs $75k-100k, 2.5% for AGIs $100k-200k)
Taxes paid: $3,583 (reported on 22.6% of returns)
36271:
$3,583
State:
$5,272
(% of AGI for various income ranges: 0.7% for AGIs below $25k, 0.9% for AGIs $25k-50k, 1.8% for AGIs $50k-75k, 1.9% for AGIs $75k-100k, 3.1% for AGIs $100k-200k)
Earned income credit: $2,397 (reported on 25.1% of returns)
Here:
$2,397
State:
$2,646
(% of AGI for various income ranges: 9.0% for AGIs below $25k, 1.5% for AGIs $25k-50k)
Percentage of individuals using paid preparers for their 2012 taxes: 67.7%
Here:
68%
State:
60%
(% for various income ranges: 62.0% for AGIs below $25k, 68.3% for AGIs $25k-50k, 73.2% for AGIs $50k-75k, 76.2% for AGIs $75k-100k, 72.2% for AGIs $100k-200k)
Averages for the 2004 tax year for zip code 36271, filed in 2005:
Average Adjusted Gross Income (AGI) in 2004: $35,759 (Individual Income Tax Returns)
Here:
$35,759
State:
$42,302
Salary/wage: $34,278 (reported on 86.9% of returns)
Here:
$34,278
State:
$36,626
(% of AGI for various income ranges: 88.0% for AGIs below $10k, 76.1% for AGIs $10k-25k, 84.9% for AGIs $25k-50k, 89.1% for AGIs $50k-75k, 85.0% for AGIs $75k-100k, 71.5% for AGIs over 100k)
Taxable interest for individuals: $1,221 (reported on 33.4% of returns)
This zip code:
$1,221
Alabama:
$1,827
(% of AGI for various income ranges: 4.4% for AGIs below $10k, 1.4% for AGIs $10k-25k, 0.8% for AGIs $25k-50k, 0.8% for AGIs $50k-75k, 0.8% for AGIs $75k-100k, 2.4% for AGIs over 100k)
Taxable dividends: $1,147 (reported on 9.8% of returns)
Here:
$1,147
State:
$4,206
(% of AGI for various income ranges: 0.7% for AGIs below $10k, 0.3% for AGIs $10k-25k, 0.3% for AGIs $25k-50k, 0.2% for AGIs $50k-75k, 0.2% for AGIs $75k-100k, 0.9% for AGIs over 100k)
Net capital gain/loss: +$3,506 (reported on 6.8% of returns)
Here:
+$3,506
State:
+$13,031
(% of AGI for various income ranges: -1.3% for AGIs below $10k, -0.2% for AGIs $10k-25k, 0.4% for AGIs $25k-50k, 0.0% for AGIs $50k-75k, 1.4% for AGIs $75k-100k, 3.1% for AGIs over 100k)
Profit/loss from business: +$3,683 (reported on 16.7% of returns)
Here:
+$3,683
State:
+$8,302
(% of AGI for various income ranges: 8.6% for AGIs below $10k, 6.5% for AGIs $10k-25k, 1.9% for AGIs $25k-50k, 0.5% for AGIs $50k-75k, 0.4% for AGIs $75k-100k, -0.8% for AGIs over 100k)
IRA payment deduction: $2,750 (reported on 1.2% of returns)
36271:
$2,750
Alabama:
$3,006
Total itemized deductions: $14,234 (23% of AGI, reported on 22.9% of returns)
Here:
$14,234
State:
$17,623
Here:
23.0% of AGI
State:
20.8% of AGI
(% of AGI for various income ranges: 7.0% for AGIs $10k-25k, 9.5% for AGIs $25k-50k, 9.0% for AGIs $50k-75k, 11.0% for AGIs $75k-100k, 10.2% for AGIs over 100k)
Charity contributions deductions: $3,281 (5% of AGI, reported on 20.0% of returns)
Here:
$3,281
State:
$4,768
Here:
5.0% of AGI
State:
5.4% of AGI
(% of AGI for various income ranges: 0.9% for AGIs $10k-25k, 1.3% for AGIs $25k-50k, 1.7% for AGIs $50k-75k, 2.6% for AGIs $75k-100k, 3.6% for AGIs over 100k)
Total tax: $4,212 (reported on 72.5% of returns)
36271:
$4,212
State:
$6,905
(% of AGI for various income ranges: 3.0% for AGIs below $10k, 3.5% for AGIs $10k-25k, 5.9% for AGIs $25k-50k, 8.6% for AGIs $50k-75k, 10.6% for AGIs $75k-100k, 18.3% for AGIs over 100k)
Earned income credit: $1,942 (reported on 22.7% of returns)
Here:
$1,942
State:
$2,048
Percentage of individuals using paid preparers for their 2004 taxes: 74.4%
Here:
74%
State:
65%
(% for various income ranges: 67.6% for AGIs below $10k, 72.8% for AGIs $10k-25k, 78.2% for AGIs $25k-50k, 75.3% for AGIs $50k-75k, 80.3% for AGIs $75k-100k, 78.8% for AGIs over 100k)
Household received Food Stamps/SNAP in the past 12 months: 478 Household did not receive Food Stamps/SNAP in the past 12 months: 1,855
Women who had a birth in the past 12 months: 105 (120 now married, 0 unmarried) Women who did not have a birth in the past 12 months: 1,150 (562 now married, 586 unmarried)
Housing units in zip code 36271 with a mortgage: 1,112 (106 second mortgage, 112 both second mortgage and home equity loan) Houses without a mortgage: 7
Median monthly owner costs for units with a mortgage: $1,208 Median monthly owner costs for units without a mortgage: $422
Residents with income below the poverty level in 2022:
This zip code:
14.8%
Whole state:
16.2%
Residents with income below 50% of the poverty level in 2022:
This zip code:
3.1%
Whole state:
8.6%
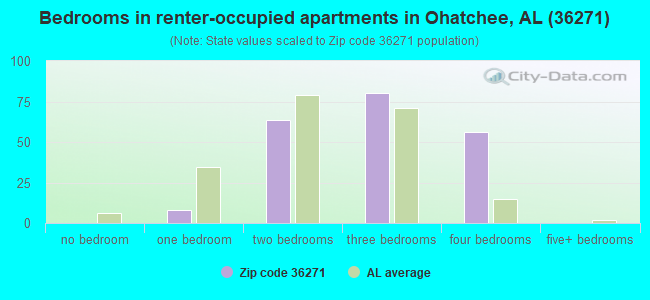
Median number of rooms in houses and condos:
Here:
6.0
State:
6.5
Median number of rooms in apartments:
Here:
5.7
State:
4.7
Notable locations in this zip code not listed on our city pages
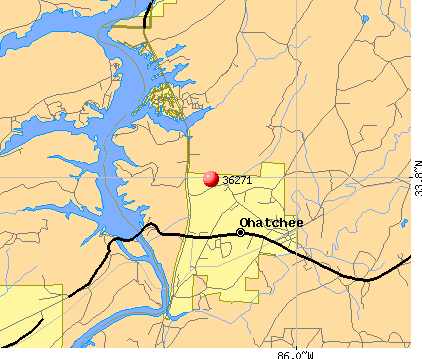
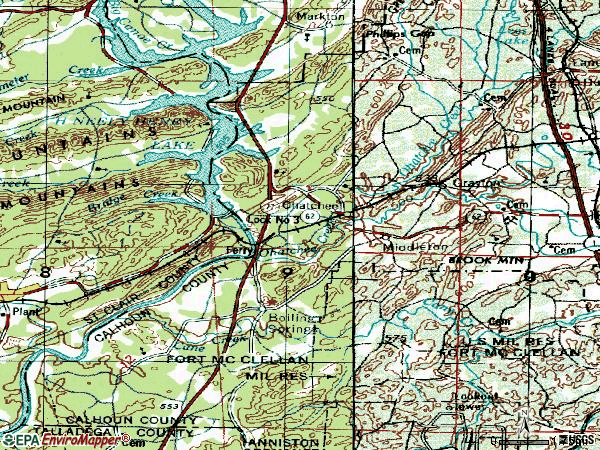
Notable locations in zip code 36271: Francis Mill (A), Ohatchee Farms (B), Big Oak Community Volunteer Fire Department (C), Mount Olive Volunteer Fire Department (D), Ohatchee Volunteer Fire Department (E). Display/hide their locations on the map
Churches in zip code 36271 include: Mount Olive Baptist Church (A), Peeks Hill United Methodist Church (B), Ohatchee Missionary Baptist Church (C), Ragan Chapel United Methodist Church (D), Ten Island Baptist Church (E), Bethel Methodist Church (F), Ohatchee United Methodist Church (G), Faith Assembly Lighthouse Church (H), Hebron Baptist Church (I). Display/hide their locations on the map
Cemeteries: Crooks Cemetery (1), Ten Island Cemetery (2), Ohatchee Cemetery (3), Middleton Cemetery (4), Hebron Cemetery (5), Ragan Chapel Cemetery (6), Green Cemetery (7). Display/hide their locations on the map
Reservoirs: Donner Lake (A), Welikee Lake (B), Thrasher Lake (C), Yarbroughs Lake (D), Samplers Lake (E), McGouirk Lake (F), Lyles Lake (G), McCullars Lake Number Two (H). Display/hide their locations on the map
Streams, rivers, and creeks: Ottery Creek (A), Ohatchee Creek (B), Bruner Creek (C), Acker Creek (D), Cane Creek (E), Alexandria Creek (F), Havers Creek (G), Lick Branch (H), Virgil Creek (I). Display/hide their locations on the map
1,005 married couples with children.
206 single-parent households (113 men, 93 women).
99.3% of residents of 36271 zip code speak English at home.
0.4% of residents speak Spanish at home (100% very well).
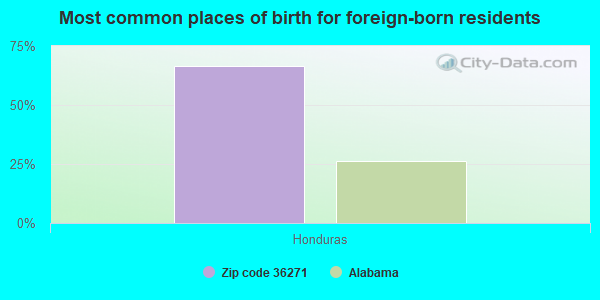
Foreign born population: 3 (0.1%) (0.0% of them are naturalized citizens)
:
0.1%
Whole state:
3.8%
67%Honduras
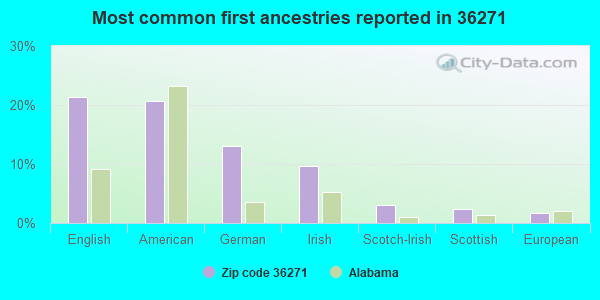
21%English
21%American
13%German
10%Irish
3%Scotch-Irish
2%Scottish
2%European
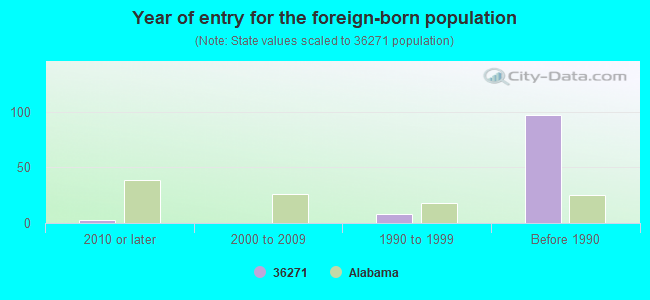
Year of entry for the foreign-born population
32010 or later
02000 to 2009
81990 to 1999
97Before 1990
Facilities with environmental interests located in this zip code:
ALABAMA POWER CO (1021 HWY 144W in OHATCHEE, AL)
National Pollutant Discharge Elimination System NON-MAJOR (Tracking pollutant discharge elimination systems) - permit (Resource Conservation and Recovery Act (tracking hazardous waste)) Business SIC classification: ELECTRIC SERVICES Organizations: OPERNAME (CONTACT/OPERATOR)
, ALABAMA POWER COMPANY (CONTACT/OWNER)
Alternative names: ALABAMA POWER CO HENRY HYDRO, ALABAMA POWER CO NEELY HENRY, ALABAMA POWER-NEELY HENRY DAM
APAC-ALABAMA INC (586 MCCULLARS LANE in OHATCHEE, AL)
AIR MINOR (AIRS/AFS) AIR SYNTHETIC MINOR (AIRS/AFS) CRITERIA AND HAZARDOUS AIR POLLUTANT INVENTORY (Inventory of air pollution sources) National Pollutant Discharge Elimination System NON-MAJOR (Tracking pollutant discharge elimination systems) - permit Business SIC classification: HIGHWAY AND STREET CONSTRUCTION, EXCEPT ELEVATED HIGHWAYS; ASPHALT PAVING MIXTURES AND BLOCKS Business NAICS classification: ASPHALT PAVING MIXTURE AND BLOCK MANUFACTURING. Organizations: APAC ALABAMA INC (CONTACT/OWNER)
Alternative names: APAC AL INC OHATCHEE
OHATCHEE HIGH SCHOOL (100 CHEROKEE TRL in OHATCHEE, AL)
(Geographic Names Information System) (National Center for Education Statistics) - STATE ID-0130 Organizations: CALHOUN COUNTY (SCHOOL DISTRICT)
OHATCHEE ELEMENTARY SCHOOL (365 J STREET in OHATCHEE, AL)
(National Center for Education Statistics) - STATE ID-0125 Organizations: CALHOUN COUNTY (SCHOOL DISTRICT)
National Pollutant Discharge Elimination System NON-MAJOR (Tracking pollutant discharge elimination systems) - permit Business SIC classification: NONCLASSIFIABLE ESTABLISHMENTS Alternative names: OHATCHEE FARMS LLC
OHATCHEE SCHOOL WWTP (CALHOUN COUNTY BD EDUCATION in OHATCHEE, AL)
National Pollutant Discharge Elimination System NON-MAJOR (Tracking pollutant discharge elimination systems) - permit Business SIC classification: ELEMENTARY AND SECONDARY SCHOOLS Alternative names: CALHOUN CO BOE OHATCHEE SCHOOL, CALHOUN COUNTY BD EDUCATION
Housing units lacking complete plumbing facilities: 3.0% Housing units lacking complete kitchen facilities: 2.9%
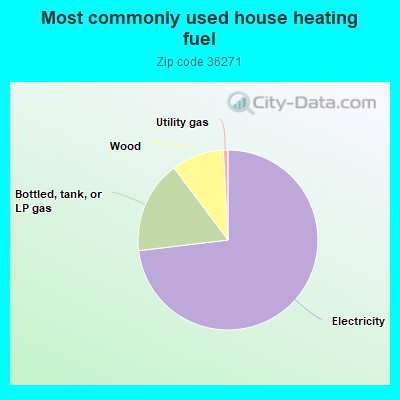
72.9%Electricity
16.6%Bottled, tank, or LP gas
9.4%Wood
0.8%Utility gas
Population in 1990: 3,369. Population change in the 1990s: +2,276 (+67.6%).
Place of birth for U.S.-born residents:
This state: 4,505
Northeast: 248
Midwest: 353
South: 728
West: 173
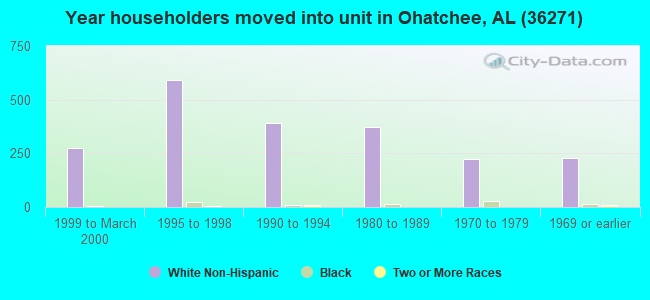
61% of the 36271 zip code residents lived in the same house 5 years ago. Out of people who lived in different houses, 62% lived in this county. Out of people who lived in different counties, 50% lived in Alabama.
94% of the 36271 zip code residents lived in the same house 1 year ago. Out of people who lived in different houses, 64% moved from this county. Out of people who lived in different houses, 19% moved from different county within same state. Out of people who lived in different houses, 18% moved from different state.
Private vs. public school enrollment:
Students in private schools in grades 1 to 8 (elementary and middle school): 18
Here:
3.1%
Alabama:
14.7%
Students in private schools in grades 9 to 12 (high school): 52
Here:
12.3%
Alabama:
16.3%
Students in private undergraduate colleges:
Here:
0.0%
Alabama:
14.6%
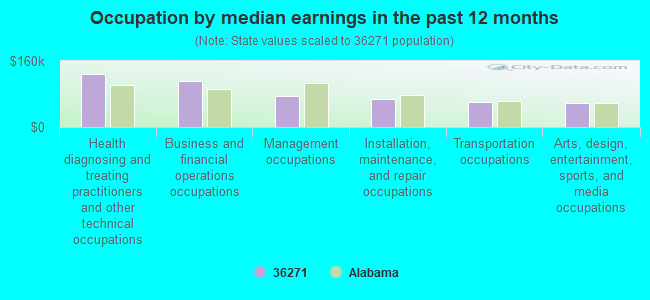
Occupation by median earnings in the past 12 months ($)
127,754Health diagnosing and treating practitioners and other technical occupations
111,316Business and financial operations occupations
74,419Management occupations
68,175Installation, maintenance, and repair occupations
60,003Transportation occupations
58,614Arts, design, entertainment, sports, and media occupations
Companies with federal contracts located in this zip code:
FAULK, ROSITA DEMETRIA (3877 NUNNALLY LAKE ROAD in OHATCHEE, AL; small business) : $79,238 in 8 contractsin 2006
Contracts for Other Housekeeping Services, Custodial Janitorial Services by Army Signed by year:2000: $0; 2001: $0; 2002: $0; 2003: $0; 2004: $0; 2005: $0; 2006: $79,238.
Biggest contracts:
$35,000 with Army for Other Housekeeping Services. Taking place in MD. Signed on 2006-01-25. Completion date: 2006-09-30.
$25,000, same as above.Signed on 2006-01-25. Completion date: 2006-09-30.
$7,678 with Army for Custodial Janitorial Services. Taking place in MS. Signed on 2006-04-11. Completion date: 2007-03-31.
$5,200, same as above.Signed on 2006-01-23. Completion date: 2006-03-20.
BOYD CONSULTING (5244 AL HWY 144 in OHATCHEE, AL; small business) : $28,005 in 3 contractsfrom 2003 to 2005
$28,080 with Army for Other Social Services. Signed on 2003-09-24. Completion date: 2004-09-30.
$0, same as above.Signed on 2003-09-24. Completion date: 2004-09-30.
-$75, same as above.Signed on 2005-09-13. Completion date: 2004-09-30.
Top industries in this zip code by the number of employees in 2005:
Accommodation and Food Services: Limited-Service Restaurants (20-49: 1)
Construction: Poured Concrete Foundation and Structure Contractors (20-49: 1)
Other Services (except Public Administration): Commercial and Industrial Machinery and Equipment (except Automotive and Electronic) Repair and Maintenance (20-49: 1)
Real Estate and Rental and Leasing: Nonresidential Property Managers (10-19: 1)
Utilities: Hydroelectric Power Generation (10-19: 1)
Mining: Crushed and Broken Limestone Mining and Quarrying (10-19: 1)
People in group quarters in 2000:
68 people in other noninstitutional group quarters
Fatal accident statistics in 2014:
Fatal accident count: 1
Vehicles involved in fatal accidents: 2
Fatal accidents caused by drunken drivers: 0
Fatalities: 1
Persons involved in fatal accidents: 2
Pedestrians involved in fatal accidents: 0
Fatal accident statistics in 2013:
Fatal accident count: 1
Vehicles involved in fatal accidents: 2
Fatal accidents caused by drunken drivers: 0
Fatalities: 1
Persons involved in fatal accidents: 2
Pedestrians involved in fatal accidents: 0
Home Mortgage Disclosure Act Aggregated Statistics For Year 2009 (Based on 3 partial tracts)
A) FHA, FSA/RHS & VA Home Purchase Loans
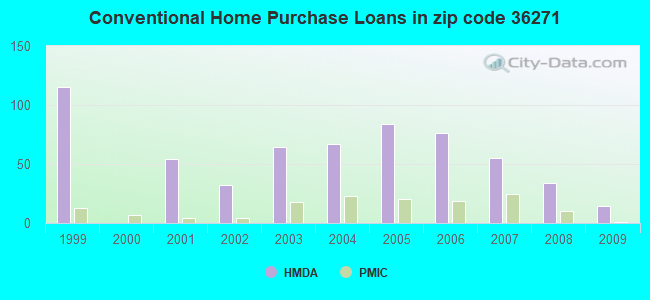
B) Conventional Home Purchase Loans
C) Refinancings
D) Home Improvement Loans
F) Non-occupant Loans on < 5 Family Dwellings (A B C & D)
G) Loans On Manufactured Home Dwelling (A B C & D)
Number
Average Value
Number
Average Value
Number
Average Value
Number
Average Value
Number
Average Value
Number
Average Value
LOANS ORIGINATED
10
$115,319
14
$110,825
118
$132,688
12
$34,963
15
$107,811
14
$38,403
APPLICATIONS APPROVED, NOT ACCEPTED
1
$111,610
6
$89,130
11
$146,725
0
$0
2
$151,230
5
$67,112
APPLICATIONS DENIED
5
$96,192
16
$61,329
49
$127,121
11
$39,347
6
$71,277
18
$55,422
APPLICATIONS WITHDRAWN
3
$89,813
6
$68,757
29
$162,536
0
$0
1
$230,640
5
$61,164
FILES CLOSED FOR INCOMPLETENESS
0
$0
1
$66,110
9
$179,966
1
$112,800
0
$0
2
$31,825
Aggregated Statistics For Year 2008 (Based on 3 partial tracts)
A) FHA, FSA/RHS & VA Home Purchase Loans
B) Conventional Home Purchase Loans
C) Refinancings
D) Home Improvement Loans
F) Non-occupant Loans on < 5 Family Dwellings (A B C & D)
G) Loans On Manufactured Home Dwelling (A B C & D)
Number
Average Value
Number
Average Value
Number
Average Value
Number
Average Value
Number
Average Value
Number
Average Value
LOANS ORIGINATED
13
$121,528
34
$113,102
103
$127,120
23
$41,560
8
$89,332
22
$49,830
APPLICATIONS APPROVED, NOT ACCEPTED
0
$0
12
$77,052
13
$79,385
3
$44,357
1
$42,170
11
$71,204
APPLICATIONS DENIED
1
$108,600
21
$74,646
53
$124,373
16
$66,526
1
$146,250
28
$63,591
APPLICATIONS WITHDRAWN
2
$224,115
5
$93,376
26
$133,342
3
$67,170
0
$0
4
$78,580
FILES CLOSED FOR INCOMPLETENESS
3
$86,707
2
$87,460
13
$142,552
0
$0
0
$0
2
$103,280
Aggregated Statistics For Year 2007 (Based on 3 partial tracts)
A) FHA, FSA/RHS & VA Home Purchase Loans
B) Conventional Home Purchase Loans
C) Refinancings
D) Home Improvement Loans
F) Non-occupant Loans on < 5 Family Dwellings (A B C & D)
G) Loans On Manufactured Home Dwelling (A B C & D)
Number
Average Value
Number
Average Value
Number
Average Value
Number
Average Value
Number
Average Value
Number
Average Value
LOANS ORIGINATED
8
$97,581
55
$107,694
91
$114,981
25
$28,990
13
$129,662
27
$48,810
APPLICATIONS APPROVED, NOT ACCEPTED
0
$0
8
$127,840
21
$109,044
5
$30,934
0
$0
7
$64,176
APPLICATIONS DENIED
1
$109,420
37
$74,538
55
$94,133
22
$30,800
6
$69,868
31
$51,792
APPLICATIONS WITHDRAWN
0
$0
7
$115,456
26
$111,902
3
$28,877
1
$45,700
4
$39,595
FILES CLOSED FOR INCOMPLETENESS
0
$0
1
$137,420
8
$164,532
2
$149,925
1
$74,250
2
$92,235
Aggregated Statistics For Year 2006 (Based on 3 partial tracts)
A) FHA, FSA/RHS & VA Home Purchase Loans
B) Conventional Home Purchase Loans
C) Refinancings
D) Home Improvement Loans
F) Non-occupant Loans on < 5 Family Dwellings (A B C & D)
G) Loans On Manufactured Home Dwelling (A B C & D)
Number
Average Value
Number
Average Value
Number
Average Value
Number
Average Value
Number
Average Value
Number
Average Value
LOANS ORIGINATED
8
$131,056
76
$87,100
105
$104,388
26
$25,061
16
$93,449
34
$54,862
APPLICATIONS APPROVED, NOT ACCEPTED
0
$0
19
$57,557
20
$118,944
6
$57,282
2
$37,625
17
$58,192
APPLICATIONS DENIED
2
$119,480
31
$75,000
67
$100,373
14
$79,572
9
$75,321
31
$67,115
APPLICATIONS WITHDRAWN
1
$83,700
7
$130,927
41
$113,947
2
$59,120
1
$116,020
3
$75,197
FILES CLOSED FOR INCOMPLETENESS
0
$0
2
$91,290
13
$102,012
1
$75,180
0
$0
1
$88,660
Aggregated Statistics For Year 2005 (Based on 3 partial tracts)
A) FHA, FSA/RHS & VA Home Purchase Loans
B) Conventional Home Purchase Loans
C) Refinancings
D) Home Improvement Loans
F) Non-occupant Loans on < 5 Family Dwellings (A B C & D)
G) Loans On Manufactured Home Dwelling (A B C & D)
Number
Average Value
Number
Average Value
Number
Average Value
Number
Average Value
Number
Average Value
Number
Average Value
LOANS ORIGINATED
9
$104,326
84
$95,534
95
$99,574
26
$38,879
15
$66,759
40
$57,177
APPLICATIONS APPROVED, NOT ACCEPTED
0
$0
29
$72,068
23
$95,547
2
$40,835
1
$177,130
23
$58,607
APPLICATIONS DENIED
0
$0
51
$80,413
78
$85,718
30
$50,029
4
$85,528
44
$57,753
APPLICATIONS WITHDRAWN
1
$92,680
12
$217,855
73
$108,104
5
$115,730
1
$1,214,720
10
$71,302
FILES CLOSED FOR INCOMPLETENESS
1
$64,860
8
$159,599
14
$94,166
2
$13,630
0
$0
2
$68,200
Aggregated Statistics For Year 2004 (Based on 3 partial tracts)
A) FHA, FSA/RHS & VA Home Purchase Loans
B) Conventional Home Purchase Loans
C) Refinancings
D) Home Improvement Loans
F) Non-occupant Loans on < 5 Family Dwellings (A B C & D)
G) Loans On Manufactured Home Dwelling (A B C & D)
Number
Average Value
Number
Average Value
Number
Average Value
Number
Average Value
Number
Average Value
Number
Average Value
LOANS ORIGINATED
10
$101,564
67
$97,863
108
$93,441
21
$38,774
11
$67,982
35
$60,778
APPLICATIONS APPROVED, NOT ACCEPTED
1
$73,970
24
$66,042
32
$78,672
2
$54,960
2
$56,125
17
$57,758
APPLICATIONS DENIED
1
$177,080
48
$62,855
81
$81,657
23
$40,587
4
$111,892
48
$58,889
APPLICATIONS WITHDRAWN
1
$72,220
5
$59,280
24
$80,053
6
$52,803
1
$85,270
5
$63,376
FILES CLOSED FOR INCOMPLETENESS
0
$0
5
$75,840
54
$86,243
1
$41,020
1
$32,300
5
$54,628
Aggregated Statistics For Year 2003 (Based on 3 partial tracts)
A) FHA, FSA/RHS & VA Home Purchase Loans
B) Conventional Home Purchase Loans
C) Refinancings
D) Home Improvement Loans
F) Non-occupant Loans on < 5 Family Dwellings (A B C & D)
Number
Average Value
Number
Average Value
Number
Average Value
Number
Average Value
Number
Average Value
LOANS ORIGINATED
12
$97,062
64
$63,496
173
$85,142
16
$15,082
12
$64,492
APPLICATIONS APPROVED, NOT ACCEPTED
1
$114,540
8
$69,805
27
$80,386
0
$0
1
$38,800
APPLICATIONS DENIED
4
$84,500
37
$51,321
107
$74,599
15
$22,348
4
$38,990
APPLICATIONS WITHDRAWN
3
$79,847
6
$63,205
39
$73,662
1
$87,620
2
$77,835
FILES CLOSED FOR INCOMPLETENESS
0
$0
2
$86,310
12
$92,479
2
$59,415
0
$0
Aggregated Statistics For Year 2002 (Based on 1 partial tract)
A) FHA, FSA/RHS & VA Home Purchase Loans
B) Conventional Home Purchase Loans
C) Refinancings
D) Home Improvement Loans
F) Non-occupant Loans on < 5 Family Dwellings (A B C & D)
Number
Average Value
Number
Average Value
Number
Average Value
Number
Average Value
Number
Average Value
LOANS ORIGINATED
5
$85,400
32
$75,234
94
$87,025
9
$19,040
8
$56,652
APPLICATIONS APPROVED, NOT ACCEPTED
0
$0
17
$48,528
17
$58,773
0
$0
0
$0
APPLICATIONS DENIED
1
$82,400
37
$51,882
56
$79,744
14
$28,359
5
$25,470
APPLICATIONS WITHDRAWN
0
$0
3
$64,923
15
$75,536
1
$63,680
0
$0
FILES CLOSED FOR INCOMPLETENESS
0
$0
1
$52,440
3
$48,380
1
$64,610
0
$0
Aggregated Statistics For Year 2001 (Based on 1 partial tract)
A) FHA, FSA/RHS & VA Home Purchase Loans
B) Conventional Home Purchase Loans
C) Refinancings
D) Home Improvement Loans
F) Non-occupant Loans on < 5 Family Dwellings (A B C & D)
Number
Average Value
Number
Average Value
Number
Average Value
Number
Average Value
Number
Average Value
LOANS ORIGINATED
3
$94,263
54
$58,317
66
$80,899
16
$8,486
7
$47,356
APPLICATIONS APPROVED, NOT ACCEPTED
0
$0
34
$51,392
15
$104,627
0
$0
0
$0
APPLICATIONS DENIED
1
$53,370
65
$45,279
41
$66,142
3
$29,030
7
$42,540
APPLICATIONS WITHDRAWN
0
$0
5
$59,930
11
$57,461
1
$14,980
1
$86,150
FILES CLOSED FOR INCOMPLETENESS
0
$0
1
$82,400
4
$51,735
0
$0
1
$82,400
Aggregated Statistics For Year 1999 (Based on 2 partial tracts)
A) FHA, FSA/RHS & VA Home Purchase Loans
B) Conventional Home Purchase Loans
C) Refinancings
D) Home Improvement Loans
F) Non-occupant Loans on < 5 Family Dwellings (A B C & D)
2005 - 2014 National Fire Incident Reporting System (NFIRS) incidents
According to the data from the years 2005 - 2014 the average number of fires per year is 15. The highest number of reported fire incidents - 47 took place in 2007, and the least - 0 in 2013. The data has a decreasing trend.
When looking into fire subcategories, the most incidents belonged to: Outside Fires (56.2%), and Structure Fires (38.4%).
Fire incident types reported to NFIRS in Zip Code 36271


 Nearest zip codes: 35907, 36250, 36279, 35906, 35096, 35131.


 According to the data from the years 2005 - 2014 the average number of fires per year is 15. The highest number of reported fire incidents - 47 took place in 2007, and the least - 0 in 2013. The data has a decreasing trend.
 When looking into fire subcategories, the most incidents belonged to: Outside Fires (56.2%), and Structure Fires (38.4%).