Estimated zip code population in 2022: 3,240 Zip code population in 2010: 3,690 Zip code population in 2000: 4,761
Houses and condos: 1,315 Renter-occupied apartments: 205
% of renters here:
19%
State:
30%
March 2022 cost of living index in zip code 36560: 80.8 (low, U.S. average is 100)
Land area: 70.2 sq. mi. Water area: 2.1 sq. mi.
Population density: 46 people per square mile
(very low).
OSM Map
General Map
Google Map
MSN Map
OSM Map
General Map
Google Map
MSN Map
OSM Map
General Map
Google Map
MSN Map
OSM Map
General Map
Google Map
MSN Map
Please wait while loading the map...
Real estate property taxes paid for housing units in 2022:
This zip code:
0.4% ($371)
Alabama:
0.4% ($718)
Median real estate property taxes paid for housing units with mortgages in 2022: $473 (0.3%) Median real estate property taxes paid for housing units with no mortgage in 2022: $360 (0.4%)
Estimated median house/condo value in 2022: $95,075
36560:
$95,075
Alabama:
$200,900
According to our research of Alabama and other state lists, there were 9 registered sex offenders living in 36560 zip code as of May 28, 2024. The ratio of all residents to sex offenders in zip code 36560 is 364 to 1. The ratio of registered sex offenders to all residents in this zip code is near the state average.
Median resident age:
This zip code:
39.1 years
Alabama median age:
39.6 years
Average household size:
This zip code:
2.9 people
Alabama:
2.5 people
Averages for the 2020 tax year for zip code 36560, filed in 2021:
Average Adjusted Gross Income (AGI) in 2020: $37,237 (Individual Income Tax Returns)
Here:
$37,237
State:
$63,984
Salary/wage: $36,262 (reported on 79.0% of returns)
Here:
$36,262
State:
$52,834
(% of AGI for various income ranges: 1226.5% for AGIs below $25k, 4000.7% for AGIs $25k-50k, 8148.2% for AGIs $50k-75k, 11854.0% for AGIs $75k-100k, 18947.5% for AGIs $100k-200k)
Taxable interest for individuals: $271 (reported on 12.3% of returns)
This zip code:
$271
Alabama:
$1,615
(% of AGI for various income ranges: 1.8% for AGIs below $25k, 7.8% for AGIs $25k-50k, 9.1% for AGIs $50k-75k, 15.0% for AGIs $100k-200k)
Ordinary dividends: $767 (reported on 2.2% of returns)
Here:
$767
State:
$7,660
(% of AGI for various income ranges: 8.5% for AGIs $25k-50k)
Net capital gain/loss in AGI: +$5,033 (reported on 2.2% of returns)
Here:
+$5,033
State:
+$23,528
(% of AGI for various income ranges: 55.9% for AGIs $25k-50k)
Profit/loss from business: +$68 (reported on 24.6% of returns)
Here:
+$68
State:
+$9,534
(% of AGI for various income ranges: 148.4% for AGIs below $25k)
Taxable individual retirement arrangement distribution: $8,067 (reported on 2.2% of returns)
36560:
$8,067
Alabama:
$19,004
(% of AGI for various income ranges: 89.6% for AGIs $25k-50k)
Total itemized deductions: $31,167 (reported on 6.5% of returns)
Here:
$31,167
State:
$37,338
(% of AGI for various income ranges: 236.7% for AGIs $25k-50k, 1016.4% for AGIs $50k-75k, 2620.0% for AGIs $100k-200k)
Charity contributions: $16,900 (reported on 5.1% of returns)
Here:
$16,900
State:
$18,005
(% of AGI for various income ranges: 569.1% for AGIs $50k-75k, 1392.5% for AGIs $100k-200k)
Taxes paid: $5,612 (reported on 5.8% of returns)
36560:
$5,612
State:
$6,484
(% of AGI for various income ranges: 172.7% for AGIs $50k-75k, 647.5% for AGIs $100k-200k)
Earned income credit: $3,039 (reported on 35.5% of returns)
Here:
$3,039
State:
$2,628
(% of AGI for various income ranges: 227.5% for AGIs below $25k, 121.9% for AGIs $25k-50k)
Percentage of individuals using paid preparers for their 2020 taxes: 92.0%
Here:
92%
State:
93%
(% for various income ranges: 92.4% for AGIs below $25k, 94.7% for AGIs $25k-50k, 88.9% for AGIs $50k-75k, 87.5% for AGIs $75k-100k, 87.5% for AGIs $100k-200k)
Averages for the 2012 tax year for zip code 36560, filed in 2013:
Average Adjusted Gross Income (AGI) in 2012: $32,044 (Individual Income Tax Returns)
Here:
$32,044
State:
$52,001
Salary/wage: $31,337 (reported on 83.6% of returns)
Here:
$31,337
State:
$43,822
(% of AGI for various income ranges: 79.6% for AGIs below $25k, 86.2% for AGIs $25k-50k, 80.8% for AGIs $50k-75k, 77.0% for AGIs $75k-100k, 81.8% for AGIs $100k-200k)
Taxable interest for individuals: $460 (reported on 14.3% of returns)
This zip code:
$460
Alabama:
$1,592
(% of AGI for various income ranges: 0.4% for AGIs below $25k, 0.2% for AGIs $25k-50k, 0.2% for AGIs $75k-100k)
Ordinary dividends: $600 (reported on 2.1% of returns)
Here:
$600
State:
$5,697
Taxable individual retirement arrangement distribution: $9,625 (reported on 2.9% of returns)
36560:
$9,625
Alabama:
$14,992
Total itemized deductions: $16,440 (31% of AGI, reported on 21.4% of returns)
Here:
$16,440
State:
$21,388
Here:
30.9% of AGI
State:
20.1% of AGI
(% of AGI for various income ranges: 6.0% for AGIs below $25k, 12.1% for AGIs $25k-50k, 13.7% for AGIs $50k-75k, 14.4% for AGIs $75k-100k, 10.4% for AGIs $100k-200k)
Charity contributions: $4,020 (reported on 17.9% of returns)
Here:
$4,020
State:
$5,925
(% of AGI for various income ranges: 0.9% for AGIs below $25k, 2.1% for AGIs $25k-50k, 3.2% for AGIs $50k-75k, 3.9% for AGIs $75k-100k, 2.1% for AGIs $100k-200k)
Taxes paid: $2,772 (reported on 20.7% of returns)
36560:
$2,772
State:
$5,272
(% of AGI for various income ranges: 0.5% for AGIs below $25k, 1.4% for AGIs $25k-50k, 2.8% for AGIs $50k-75k, 2.8% for AGIs $75k-100k, 2.5% for AGIs $100k-200k)
Earned income credit: $2,948 (reported on 47.1% of returns)
Here:
$2,948
State:
$2,646
(% of AGI for various income ranges: 15.2% for AGIs below $25k, 2.0% for AGIs $25k-50k)
Percentage of individuals using paid preparers for their 2012 taxes: 77.1%
Here:
77%
State:
60%
(% for various income ranges: 76.9% for AGIs below $25k, 76.3% for AGIs $25k-50k, 76.9% for AGIs $50k-75k, 85.7% for AGIs $75k-100k, 75.0% for AGIs $100k-200k)
Averages for the 2004 tax year for zip code 36560, filed in 2005:
Average Adjusted Gross Income (AGI) in 2004: $24,165 (Individual Income Tax Returns)
Here:
$24,165
State:
$42,302
Salary/wage: $23,450 (reported on 85.7% of returns)
Here:
$23,450
State:
$36,626
(% of AGI for various income ranges: 76.8% for AGIs below $10k, 82.1% for AGIs $10k-25k, 84.0% for AGIs $25k-50k, 87.5% for AGIs $50k-75k, 84.4% for AGIs $75k-100k, 76.5% for AGIs over 100k)
Taxable interest for individuals: $715 (reported on 19.0% of returns)
This zip code:
$715
Alabama:
$1,827
(% of AGI for various income ranges: 0.5% for AGIs below $10k, 0.6% for AGIs $10k-25k, 0.7% for AGIs $25k-50k, 0.5% for AGIs $50k-75k, 0.3% for AGIs $75k-100k, 0.2% for AGIs over 100k)
Taxable dividends: $565 (reported on 3.2% of returns)
Here:
$565
State:
$4,206
Profit/loss from business: +$3,473 (reported on 13.0% of returns)
Here:
+$3,473
State:
+$8,302
(% of AGI for various income ranges: 11.3% for AGIs below $10k, 2.7% for AGIs $10k-25k, 1.3% for AGIs $25k-50k, 0.4% for AGIs $50k-75k)
Total itemized deductions: $14,219 (32% of AGI, reported on 22.1% of returns)
Here:
$14,219
State:
$17,623
Here:
31.8% of AGI
State:
20.8% of AGI
(% of AGI for various income ranges: 8.3% for AGIs $10k-25k, 16.0% for AGIs $25k-50k, 15.4% for AGIs $50k-75k, 18.3% for AGIs $75k-100k, 15.6% for AGIs over 100k)
Charity contributions deductions: $3,336 (7% of AGI, reported on 20.0% of returns)
Here:
$3,336
State:
$4,768
Here:
7.3% of AGI
State:
5.4% of AGI
(% of AGI for various income ranges: 1.6% for AGIs $10k-25k, 3.1% for AGIs $25k-50k, 3.4% for AGIs $50k-75k, 5.3% for AGIs $75k-100k, 3.7% for AGIs over 100k)
Total tax: $2,612 (reported on 53.1% of returns)
36560:
$2,612
State:
$6,905
(% of AGI for various income ranges: 2.4% for AGIs below $10k, 2.4% for AGIs $10k-25k, 4.8% for AGIs $25k-50k, 8.2% for AGIs $50k-75k, 10.2% for AGIs $75k-100k, 14.9% for AGIs over 100k)
Earned income credit: $2,150 (reported on 47.1% of returns)
Here:
$2,150
State:
$2,048
Percentage of individuals using paid preparers for their 2004 taxes: 67.7%
Here:
68%
State:
65%
(% for various income ranges: 55.6% for AGIs below $10k, 70.6% for AGIs $10k-25k, 69.0% for AGIs $25k-50k, 82.1% for AGIs $50k-75k, 85.7% for AGIs $75k-100k, 75.0% for AGIs over 100k)
Household received Food Stamps/SNAP in the past 12 months: 273 Household did not receive Food Stamps/SNAP in the past 12 months: 811
Women who had a birth in the past 12 months: 38 (4 now married, 26 unmarried) Women who did not have a birth in the past 12 months: 760 (173 now married, 587 unmarried)
Housing units in zip code 36560 with a mortgage: 219 (21 second mortgage, 9 both second mortgage and home equity loan) Houses without a mortgage: 72
Median monthly owner costs for units with a mortgage: $1,051 Median monthly owner costs for units without a mortgage: $484
Residents with income below the poverty level in 2022:
This zip code:
18.2%
Whole state:
16.2%
Residents with income below 50% of the poverty level in 2022:
This zip code:
11.2%
Whole state:
8.6%
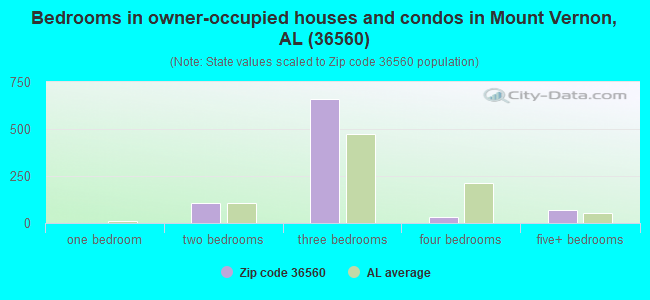
Median number of rooms in houses and condos:
Here:
6.1
State:
6.5
Median number of rooms in apartments:
Here:
5.9
State:
4.7
Notable locations in this zip code not listed on our city pages
Notable locations in zip code 36560: Blue Ford Landing (A), Calvert Landing (B), Cedar Creek Fish Camp (C), Chastang Landing (D), Alabama Department of Mental Health Searcy Hospital Lagoon (E), Florida Gas Transmission Company Facility (F), Calvert Business Park (G), Greers Landing (H), Meahers Landing (I), Seaboard Landing (J), Sheppard Landing (K), Spring Landing (L), Webbs Landing (M), Old Fort Stoddard Mount Vernon Landing (N), Sullivan Store (O), Weaver Community House (P), Mount Vernon - Simison Volunteer Fire Department (Q), Calcedeaver Fire Department (R), Mount Vernon Town Hall (S), Mount Vernon Community Center (T). Display/hide their locations on the map
Churches in zip code 36560 include: Byrd Church (A), Cedar Creek Church (B), Pine Grove Church (C), Mount Olive Primitive Baptist Church (D), Aldergate Church (E), First Church (F), Free Church (G), Church of God Pentecostal (H), Kingdom Hall Church (I). Display/hide their locations on the map
Cemeteries: Byrd Cemetery (1), Roper Cemetery (2), Seymour Bluff Cemetery (3), Mount Vernon Cemetery (4), Morningstar Cemetery (5). Display/hide their locations on the map
Streams, rivers, and creeks: Indian Grave Creek (A), Grady Hall Creek (B), Dabney Creek (C), Conrad Creek (D), Cedar Creek (E), Bull Branch (F), Broad Branch (G), Tombigbee River (H), Borrow Creek (I). Display/hide their locations on the map
148 married couples with children.
228 single-parent households (197 men, 31 women).
98.2% of residents of 36560 zip code speak English at home.
0.5% of residents speak Spanish at home (33% very well, 67% well).
0.8% of residents speak other Indo-European language at home (100% not well).
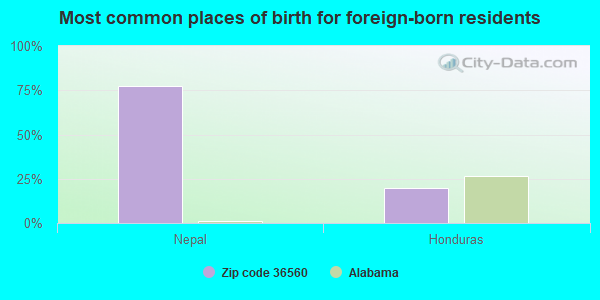
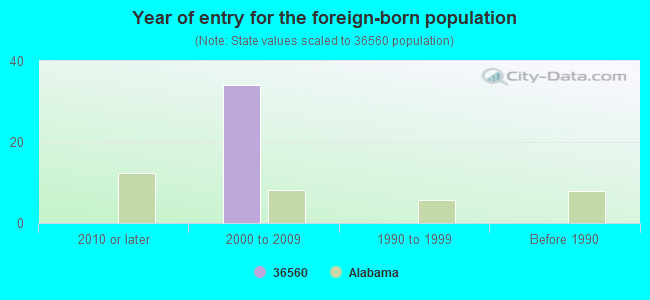
Foreign born population: 37 (1.2%) (76.9% of them are naturalized citizens)
This zip code:
1.2%
Whole state:
3.8%
77%Nepal
20%Honduras
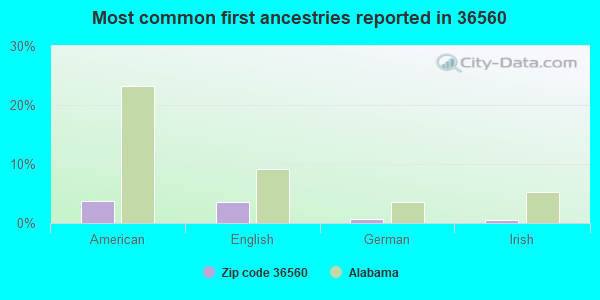
4%American
3%English
1%German
0%Irish
Year of entry for the foreign-born population
02010 or later
342000 to 2009
01990 to 1999
0Before 1990
Facilities with environmental interests located in this zip code:
CALCEDEAVER ELEMENTARY SCHOOL (20185 RICHARD WEAVER RD in MOUNT VERNON, AL)
(Geographic Names Information System) (National Center for Education Statistics) - STATE ID-0150 Organizations: MOBILE COUNTY (SCHOOL DISTRICT)
CITY OF MOBILE (17045 HWY 43 in MOUNT VERNON, AL)
AIR MAJOR (AIRS/AFS) CRITERIA AND HAZARDOUS AIR POLLUTANT INVENTORY (Inventory of air pollution sources) (Resource Conservation and Recovery Act (tracking hazardous waste)) Business SIC classification: REFUSE SYSTEMS Business NAICS classification: SOLID WASTE LANDFILL.; SOLID WASTE LANDFILL. Organizations: BILL COOKSEY DISTRICT MANAGER (CONTACT/OPERATOR)
, LEN NECAISE DISTRICT MANAGER (CONTACT/OPERATOR)
, CITY OF MOBILE ALABAMA (CONTACT/OWNER)
Alternative names: CITY OF MOBILE CHASTANG LANDFILL, TRANSAMERICAN WASTE IND CHASTANG SAN LDF
ET BELSAW - MOUNT VERNON SCHOOL (1650 GARTMAN CIR in MOUNT VERNON, AL)
(National Center for Education Statistics) - STATE ID-0525 Organizations: MOBILE COUNTY (SCHOOL DISTRICT)
PIT NUMBER 3 (JOHN HENDERSON in MOUNT VERNON, AL)
National Pollutant Discharge Elimination System NON-MAJOR (Tracking pollutant discharge elimination systems) - permit Business SIC classification: CONSTRUCTION SAND AND GRAVEL Organizations: HENDERSON JOHN (CONTACT/OPERATOR)
Alternative names: HENDERSON JOHN, HENDERSON JOHN PIT 3
CHASTANG LANDFILL (U S HIGHWAY 43 AT 26 in CHASTANG, AL)
National Pollutant Discharge Elimination System NON-MAJOR (Tracking pollutant discharge elimination systems) - permit Business SIC classification: AIR AND WATER RESOURCE AND SOLID WASTE MANAGEMENT
BYRD PIT (SAMUEL BYRD in MT VERNON, AL)
National Pollutant Discharge Elimination System NON-MAJOR (Tracking pollutant discharge elimination systems) - permit Business SIC classification: MISCELLANEOUS NONMETALLIC MINERALS, EXCEPT FUELS Alternative names: SAMUEL BYRD BYRD PIT
MT VERNON TRACTOR INC (18790 HWY 43 in MT VERNON, AL)
Conditionally Exempt Small Quantity Generators, less than 100 kg/month of hazardous waste (Resource Conservation and Recovery Act (tracking hazardous waste)) - notification Organizations: RALPH PRUITT (CONTACT/OWNER)
CHASTANG SANITARY LANDFILL (17046 43 HWY in MOUNT VERNON, AL)
CRITERIA AND HAZARDOUS AIR POLLUTANT INVENTORY (Inventory of air pollution sources) Business SIC classification: REFUSE SYSTEMS Business NAICS classification: SOLID WASTE LANDFILL.
Housing units lacking complete plumbing facilities: 7.5% Housing units lacking complete kitchen facilities: 5.8%
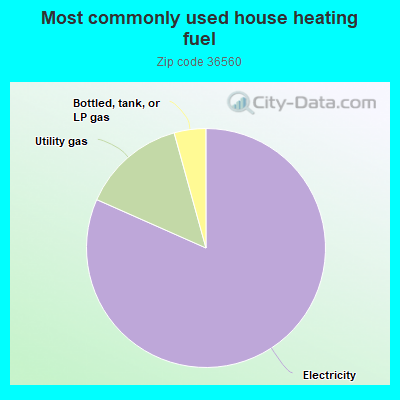
81.8%Electricity
14.1%Utility gas
4.3%Bottled, tank, or LP gas
Population in 1990: 5,053.
Place of birth for U.S.-born residents:
This state: 2,878
Northeast: 2
Midwest: 41
South: 235
West: 16
74% of the 36560 zip code residents lived in the same house 5 years ago. Out of people who lived in different houses, 69% lived in this county. Out of people who lived in different counties, 50% lived in Alabama.
95% of the 36560 zip code residents lived in the same house 1 year ago. Out of people who lived in different houses, 80% moved from this county. Out of people who lived in different houses, 15% moved from different state. Out of people who lived in different houses, 3% moved from abroad.
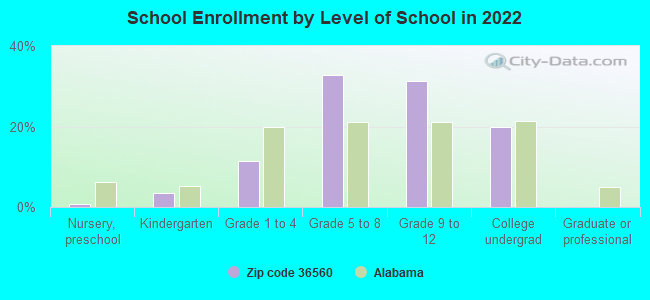
Private vs. public school enrollment:
Students in private schools in grades 1 to 8 (elementary and middle school): 3
Here:
1.5%
Alabama:
14.7%
Students in private schools in grades 9 to 12 (high school):
Here:
0.0%
Alabama:
16.3%
Students in private undergraduate colleges: 23
Here:
18.9%
Alabama:
14.6%
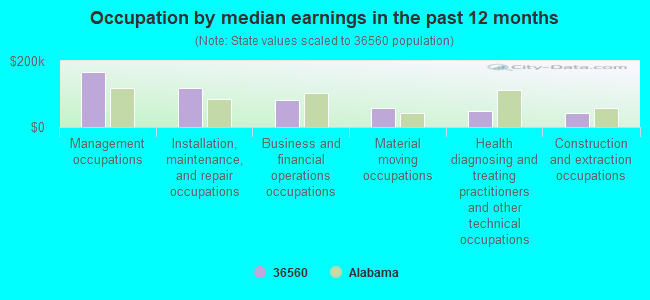
Occupation by median earnings in the past 12 months ($)
167,961Management occupations
119,662Installation, maintenance, and repair occupations
81,093Business and financial operations occupations
56,752Material moving occupations
48,004Health diagnosing and treating practitioners and other technical occupations
42,756Construction and extraction occupations
Top industries in this zip code by the number of employees in 2005:
Health Care and Social Assistance: Psychiatric and Substance Abuse Hospitals (500-999 employees: 1 establishment)
Health Care and Social Assistance: Child Day Care Services (20-49: 1)
Accommodation and Food Services: Food Service Contractors (20-49: 1)
Other Services (except Public Administration): Religious Organizations (10-19: 1, 1-4: 2)
Administrative and Support and Waste Management and Remediation Services: Solid Waste Landfill (10-19: 1)
Finance and Insurance: Commercial Banking (5-9: 1)
People in group quarters in 2010:
41 people in mental (psychiatric) hospitals and psychiatric units in other hospitals
19 people in group homes intended for adults
People in group quarters in 2000:
408 people in mental (psychiatric) hospitals or wards
Fatal accident statistics in 2014:
Fatal accident count: 4
Vehicles involved in fatal accidents: 5
Fatal accidents caused by drunken drivers: 1
Fatalities: 5
Persons involved in fatal accidents: 8
Pedestrians involved in fatal accidents: 2
Fatal accident statistics in 2011:
Fatal accident count: 1
Vehicles involved in fatal accidents: 1
Fatal accidents caused by drunken drivers: 0
Fatalities: 1
Persons involved in fatal accidents: 1
Pedestrians involved in fatal accidents: 1
Home Mortgage Disclosure Act Aggregated Statistics For Year 2009 (Based on 2 partial tracts)
A) FHA, FSA/RHS & VA Home Purchase Loans
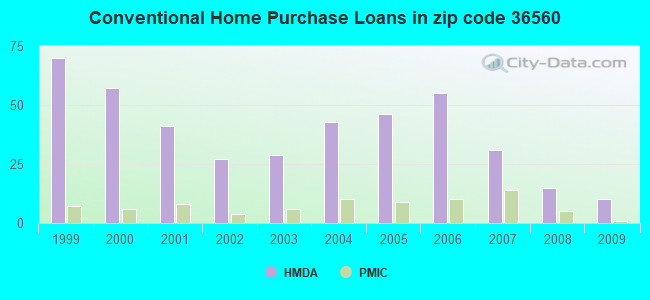
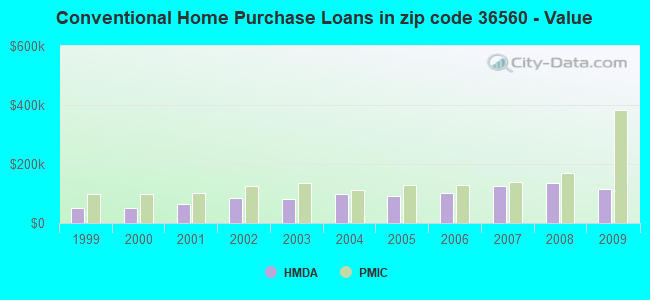
B) Conventional Home Purchase Loans
C) Refinancings
D) Home Improvement Loans
F) Non-occupant Loans on < 5 Family Dwellings (A B C & D)
G) Loans On Manufactured Home Dwelling (A B C & D)
Number
Average Value
Number
Average Value
Number
Average Value
Number
Average Value
Number
Average Value
Number
Average Value
LOANS ORIGINATED
11
$124,549
10
$114,069
67
$137,836
7
$16,444
6
$56,812
4
$35,452
APPLICATIONS APPROVED, NOT ACCEPTED
1
$100,360
3
$98,723
5
$131,582
0
$0
1
$41,430
3
$38,207
APPLICATIONS DENIED
3
$96,650
9
$62,499
35
$136,923
8
$35,839
2
$47,795
12
$32,546
APPLICATIONS WITHDRAWN
2
$149,000
2
$122,055
18
$135,241
0
$0
0
$0
1
$80,790
FILES CLOSED FOR INCOMPLETENESS
1
$86,170
1
$239,360
10
$144,267
0
$0
0
$0
0
$0
Aggregated Statistics For Year 2008 (Based on 2 partial tracts)
A) FHA, FSA/RHS & VA Home Purchase Loans
B) Conventional Home Purchase Loans
C) Refinancings
D) Home Improvement Loans
F) Non-occupant Loans on < 5 Family Dwellings (A B C & D)
G) Loans On Manufactured Home Dwelling (A B C & D)
Number
Average Value
Number
Average Value
Number
Average Value
Number
Average Value
Number
Average Value
Number
Average Value
LOANS ORIGINATED
14
$130,170
15
$134,060
55
$119,081
11
$32,595
4
$82,762
10
$38,316
APPLICATIONS APPROVED, NOT ACCEPTED
0
$0
8
$55,576
6
$117,033
4
$39,115
1
$40,270
7
$55,757
APPLICATIONS DENIED
2
$115,775
22
$71,424
36
$133,297
14
$44,311
2
$56,390
16
$56,663
APPLICATIONS WITHDRAWN
4
$111,915
7
$121,546
18
$131,549
3
$50,643
3
$64,837
2
$67,215
FILES CLOSED FOR INCOMPLETENESS
1
$107,610
1
$136,850
9
$172,051
1
$46,760
0
$0
0
$0
Aggregated Statistics For Year 2007 (Based on 2 partial tracts)
A) FHA, FSA/RHS & VA Home Purchase Loans
B) Conventional Home Purchase Loans
C) Refinancings
D) Home Improvement Loans
F) Non-occupant Loans on < 5 Family Dwellings (A B C & D)
G) Loans On Manufactured Home Dwelling (A B C & D)
Number
Average Value
Number
Average Value
Number
Average Value
Number
Average Value
Number
Average Value
Number
Average Value
LOANS ORIGINATED
3
$108,417
31
$124,686
64
$113,788
10
$45,373
8
$69,855
8
$29,961
APPLICATIONS APPROVED, NOT ACCEPTED
3
$34,063
6
$72,600
14
$88,676
4
$20,335
0
$0
5
$39,354
APPLICATIONS DENIED
2
$75,920
26
$84,113
57
$122,052
13
$61,515
4
$152,578
17
$41,579
APPLICATIONS WITHDRAWN
0
$0
4
$114,675
22
$121,165
2
$90,100
1
$15,190
1
$55,240
FILES CLOSED FOR INCOMPLETENESS
0
$0
1
$163,160
10
$138,109
1
$90,020
1
$49,160
0
$0
Aggregated Statistics For Year 2006 (Based on 2 partial tracts)
A) FHA, FSA/RHS & VA Home Purchase Loans
B) Conventional Home Purchase Loans
C) Refinancings
D) Home Improvement Loans
F) Non-occupant Loans on < 5 Family Dwellings (A B C & D)
G) Loans On Manufactured Home Dwelling (A B C & D)
Number
Average Value
Number
Average Value
Number
Average Value
Number
Average Value
Number
Average Value
Number
Average Value
LOANS ORIGINATED
8
$94,661
55
$100,122
67
$101,416
21
$36,030
7
$87,779
21
$38,465
APPLICATIONS APPROVED, NOT ACCEPTED
2
$100,475
5
$86,298
19
$94,139
2
$52,625
2
$51,620
1
$40,880
APPLICATIONS DENIED
1
$71,990
23
$70,841
53
$99,655
18
$33,859
5
$33,558
15
$50,726
APPLICATIONS WITHDRAWN
0
$0
8
$119,795
25
$105,334
3
$83,280
2
$60,920
0
$0
FILES CLOSED FOR INCOMPLETENESS
0
$0
3
$147,833
7
$113,466
0
$0
1
$53,170
0
$0
Aggregated Statistics For Year 2005 (Based on 2 partial tracts)
A) FHA, FSA/RHS & VA Home Purchase Loans
B) Conventional Home Purchase Loans
C) Refinancings
D) Home Improvement Loans
F) Non-occupant Loans on < 5 Family Dwellings (A B C & D)
G) Loans On Manufactured Home Dwelling (A B C & D)
Number
Average Value
Number
Average Value
Number
Average Value
Number
Average Value
Number
Average Value
Number
Average Value
LOANS ORIGINATED
10
$96,547
46
$90,983
67
$88,722
13
$29,144
6
$45,957
13
$31,393
APPLICATIONS APPROVED, NOT ACCEPTED
1
$120,840
9
$62,450
20
$75,578
2
$25,100
0
$0
4
$47,282
APPLICATIONS DENIED
5
$62,466
33
$60,063
52
$83,915
15
$30,493
2
$59,185
35
$51,749
APPLICATIONS WITHDRAWN
1
$144,570
10
$92,365
40
$107,328
6
$135,690
3
$64,533
3
$64,677
FILES CLOSED FOR INCOMPLETENESS
0
$0
3
$78,327
11
$109,968
1
$75,950
1
$17,260
0
$0
Aggregated Statistics For Year 2004 (Based on 2 partial tracts)
A) FHA, FSA/RHS & VA Home Purchase Loans
B) Conventional Home Purchase Loans
C) Refinancings
D) Home Improvement Loans
F) Non-occupant Loans on < 5 Family Dwellings (A B C & D)
G) Loans On Manufactured Home Dwelling (A B C & D)
Number
Average Value
Number
Average Value
Number
Average Value
Number
Average Value
Number
Average Value
Number
Average Value
LOANS ORIGINATED
6
$81,020
43
$99,095
75
$98,071
11
$36,298
4
$51,035
12
$37,266
APPLICATIONS APPROVED, NOT ACCEPTED
0
$0
9
$58,279
27
$83,021
0
$0
1
$60,300
2
$61,880
APPLICATIONS DENIED
2
$54,860
34
$46,537
61
$89,094
16
$33,992
3
$90,457
33
$39,691
APPLICATIONS WITHDRAWN
1
$55,930
4
$108,208
36
$103,825
3
$42,173
0
$0
0
$0
FILES CLOSED FOR INCOMPLETENESS
0
$0
1
$120,940
10
$109,829
1
$31,370
0
$0
0
$0
Aggregated Statistics For Year 2003 (Based on 2 partial tracts)
A) FHA, FSA/RHS & VA Home Purchase Loans
B) Conventional Home Purchase Loans
C) Refinancings
D) Home Improvement Loans
F) Non-occupant Loans on < 5 Family Dwellings (A B C & D)
Number
Average Value
Number
Average Value
Number
Average Value
Number
Average Value
Number
Average Value
LOANS ORIGINATED
7
$79,906
29
$82,974
134
$85,206
15
$15,431
8
$50,298
APPLICATIONS APPROVED, NOT ACCEPTED
0
$0
5
$118,138
24
$80,695
0
$0
0
$0
APPLICATIONS DENIED
1
$42,810
19
$45,116
62
$87,116
10
$30,091
5
$30,850
APPLICATIONS WITHDRAWN
1
$65,210
5
$95,832
36
$102,969
1
$51,100
2
$72,465
FILES CLOSED FOR INCOMPLETENESS
0
$0
2
$66,410
15
$93,879
0
$0
0
$0
Aggregated Statistics For Year 2002 (Based on 2 partial tracts)
A) FHA, FSA/RHS & VA Home Purchase Loans
B) Conventional Home Purchase Loans
C) Refinancings
D) Home Improvement Loans
F) Non-occupant Loans on < 5 Family Dwellings (A B C & D)
Number
Average Value
Number
Average Value
Number
Average Value
Number
Average Value
Number
Average Value
LOANS ORIGINATED
13
$89,047
27
$85,579
93
$76,458
10
$19,177
9
$59,211
APPLICATIONS APPROVED, NOT ACCEPTED
0
$0
9
$46,156
24
$69,793
0
$0
0
$0
APPLICATIONS DENIED
2
$57,880
25
$34,531
57
$61,946
13
$14,241
2
$41,200
APPLICATIONS WITHDRAWN
0
$0
3
$86,263
18
$91,346
1
$42,480
1
$48,750
FILES CLOSED FOR INCOMPLETENESS
0
$0
1
$73,190
12
$74,180
0
$0
0
$0
Aggregated Statistics For Year 2001 (Based on 2 partial tracts)
A) FHA, FSA/RHS & VA Home Purchase Loans
B) Conventional Home Purchase Loans
C) Refinancings
D) Home Improvement Loans
F) Non-occupant Loans on < 5 Family Dwellings (A B C & D)
Number
Average Value
Number
Average Value
Number
Average Value
Number
Average Value
Number
Average Value
LOANS ORIGINATED
13
$85,438
41
$62,757
91
$78,231
11
$12,906
7
$47,240
APPLICATIONS APPROVED, NOT ACCEPTED
0
$0
12
$32,883
13
$73,062
1
$25,230
0
$0
APPLICATIONS DENIED
2
$71,745
54
$39,580
49
$62,218
10
$20,605
4
$29,815
APPLICATIONS WITHDRAWN
0
$0
3
$61,407
18
$68,440
1
$23,950
1
$81,300
FILES CLOSED FOR INCOMPLETENESS
0
$0
3
$45,950
10
$85,964
0
$0
0
$0
Aggregated Statistics For Year 2000 (Based on 2 partial tracts)
A) FHA, FSA/RHS & VA Home Purchase Loans
B) Conventional Home Purchase Loans
C) Refinancings
D) Home Improvement Loans
F) Non-occupant Loans on < 5 Family Dwellings (A B C & D)
Number
Average Value
Number
Average Value
Number
Average Value
Number
Average Value
Number
Average Value
LOANS ORIGINATED
8
$73,710
57
$51,785
52
$56,026
15
$23,109
9
$37,310
APPLICATIONS APPROVED, NOT ACCEPTED
5
$42,236
19
$43,557
5
$57,662
2
$7,610
1
$76,930
APPLICATIONS DENIED
2
$63,210
82
$36,864
34
$53,016
11
$12,635
3
$57,573
APPLICATIONS WITHDRAWN
3
$66,497
5
$54,144
16
$49,085
0
$0
1
$20,720
FILES CLOSED FOR INCOMPLETENESS
0
$0
1
$66,430
7
$82,679
0
$0
0
$0
Aggregated Statistics For Year 1999 (Based on 2 partial tracts)
A) FHA, FSA/RHS & VA Home Purchase Loans
B) Conventional Home Purchase Loans
C) Refinancings
D) Home Improvement Loans
F) Non-occupant Loans on < 5 Family Dwellings (A B C & D)
Detailed PMIC statistics for the following Tracts:0057.00
, 0058.00
2007 - 2018 National Fire Incident Reporting System (NFIRS) incidents
Based on the data from the years 2007 - 2018 the average number of fire incidents per year is 9. The highest number of fires - 30 took place in 2016, and the least - 0 in 2009. The data has a dropping trend.
When looking into fire subcategories, the most reports belonged to: Outside Fires (72.8%), and Structure Fires (21.4%).
Fire incident types reported to NFIRS in Zip Code 36560


 Nearest zip codes: 36513, 36512, 36556, 36553, 36505, 36521.


 Based on the data from the years 2007 - 2018 the average number of fire incidents per year is 9. The highest number of fires - 30 took place in 2016, and the least - 0 in 2009. The data has a dropping trend.
 When looking into fire subcategories, the most reports belonged to: Outside Fires (72.8%), and Structure Fires (21.4%).