Estimated zip code population in 2022: 6,291 Zip code population in 2010: 6,226 Zip code population in 2000: 5,150
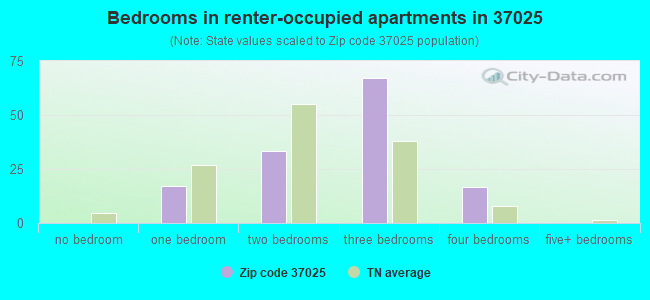
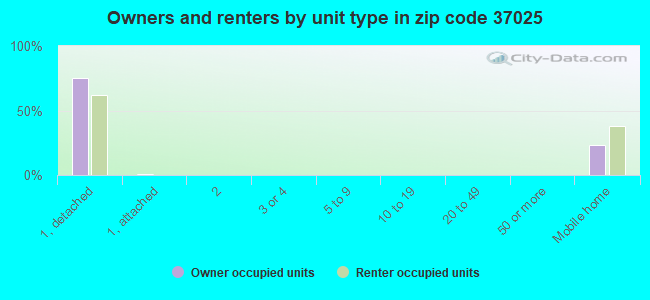
Houses and condos: 2,671 Renter-occupied apartments: 135
% of renters here:
6%
State:
33%
March 2022 cost of living index in zip code 37025: 79.4 (low, U.S. average is 100)
Land area: 60.4 sq. mi. Water area: 0.0 sq. mi.
Population density: 104 people per square mile
(very low).
OSM Map
General Map
Google Map
MSN Map
OSM Map
General Map
Google Map
MSN Map
OSM Map
General Map
Google Map
MSN Map
OSM Map
General Map
Google Map
MSN Map
Please wait while loading the map...
Real estate property taxes paid for housing units in 2022:
This zip code:
0.4% ($1,051)
Tennessee:
0.5% ($1,376)
Median real estate property taxes paid for housing units with mortgages in 2022: $1,221 (0.4%) Median real estate property taxes paid for housing units with no mortgage in 2022: $770 (0.6%)
Business Search- 14 Million verified businesses
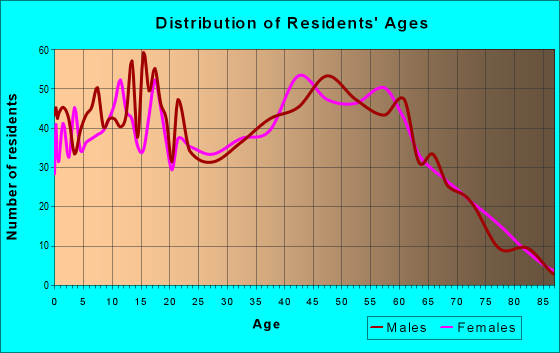
Males: 3,149
(50.1%)
Females: 3,142
(49.9%)
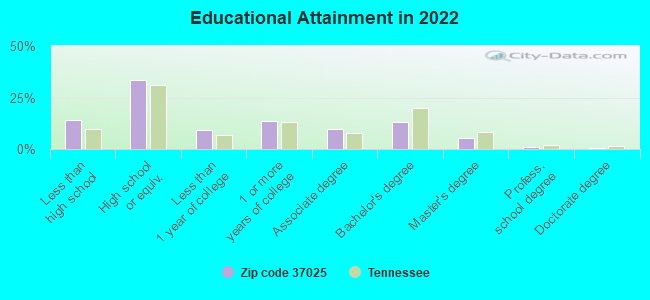
For population 25 years and over in 37025:
High school or higher: 85.3%
Bachelor's degree or higher: 19.9%
Graduate or professional degree: 6.7%
Unemployed: 2.4%
Mean travel time to work (commute): 31.3 minutes
For population 15 years and over in 37025:
Never married: 25.9%
Now married: 52.6%
Separated: 2.1%
Widowed: 8.0%
Divorced: 11.3%
Zip code 37025 compared to state average:
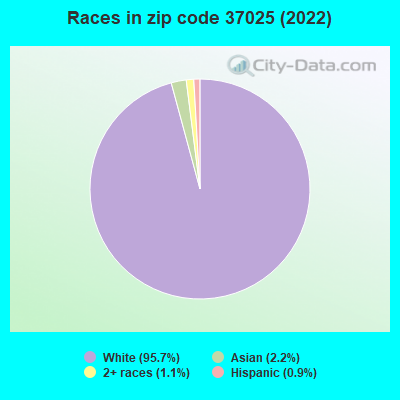
Black race population percentage significantly below state average.
Hispanic race population percentage significantly below state average.
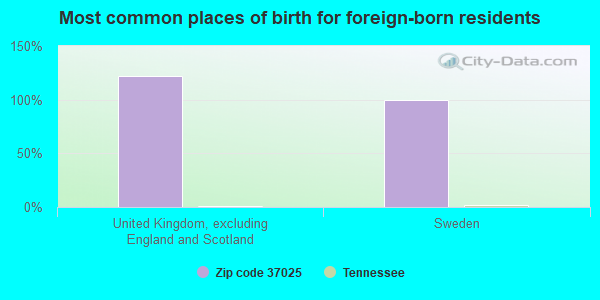
Foreign-born population percentage significantly below state average.
Renting percentage significantly below state average.
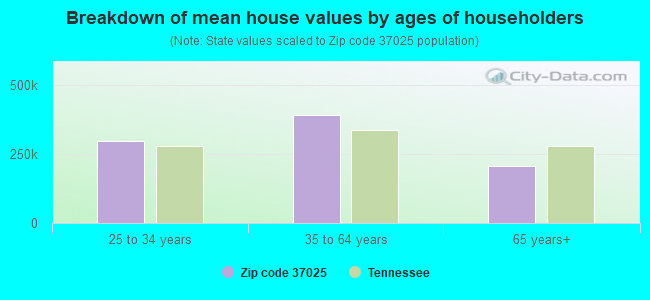
House age below state average.
Percentage of population with a bachelor's degree or higher below state average.
Averages for the 2020 tax year for zip code 37025, filed in 2021:
Average Adjusted Gross Income (AGI) in 2020: $55,051 (Individual Income Tax Returns)
Here:
$55,051
State:
$69,014
Salary/wage: $49,278 (reported on 82.5% of returns)
Here:
$49,278
State:
$55,872
(% of AGI for various income ranges: 1078.0% for AGIs below $25k, 3609.9% for AGIs $25k-50k, 6445.0% for AGIs $50k-75k, 10274.0% for AGIs $75k-100k, 15526.7% for AGIs $100k-200k)
Taxable interest for individuals: $875 (reported on 22.3% of returns)
This zip code:
$875
Tennessee:
$1,945
(% of AGI for various income ranges: 6.4% for AGIs below $25k, 22.2% for AGIs $25k-50k, 26.1% for AGIs $50k-75k, 20.0% for AGIs $75k-100k, 38.8% for AGIs $100k-200k)
Ordinary dividends: $2,152 (reported on 9.4% of returns)
Here:
$2,152
State:
$8,105
(% of AGI for various income ranges: 4.7% for AGIs below $25k, 10.6% for AGIs $25k-50k, 40.0% for AGIs $50k-75k, 24.0% for AGIs $75k-100k, 64.6% for AGIs $100k-200k)
Net capital gain/loss in AGI: +$18,446 (reported on 9.1% of returns)
Here:
+$18,446
State:
+$33,664
(% of AGI for various income ranges: 5.1% for AGIs below $25k, 14.6% for AGIs $25k-50k, 78.2% for AGIs $50k-75k, 125.5% for AGIs $75k-100k, 535.4% for AGIs $100k-200k)
Profit/loss from business: +$16,649 (reported on 18.4% of returns)
Here:
+$16,649
State:
+$18,991
(% of AGI for various income ranges: 179.9% for AGIs below $25k, 220.3% for AGIs $25k-50k, 379.5% for AGIs $50k-75k, 446.0% for AGIs $75k-100k, 1759.6% for AGIs $100k-200k)
Taxable individual retirement arrangement distribution: $15,395 (reported on 6.5% of returns)
37025:
$15,395
Tennessee:
$20,036
(% of AGI for various income ranges: 38.6% for AGIs below $25k, 86.0% for AGIs $25k-50k, 120.8% for AGIs $50k-75k, 215.5% for AGIs $75k-100k, 541.7% for AGIs $100k-200k)
Total itemized deductions: $33,400 (reported on 2.9% of returns)
Here:
$33,400
State:
$40,136
(% of AGI for various income ranges: 296.3% for AGIs $50k-75k, 783.3% for AGIs $100k-200k)
Charity contributions: $10,238 (reported on 2.6% of returns)
Here:
$10,238
State:
$19,852
(% of AGI for various income ranges: 19.3% for AGIs $25k-50k, 287.5% for AGIs $100k-200k)
Taxes paid: $5,411 (reported on 2.9% of returns)
37025:
$5,411
State:
$6,038
(% of AGI for various income ranges: 40.3% for AGIs $50k-75k, 139.2% for AGIs $100k-200k)
Earned income credit: $2,327 (reported on 19.1% of returns)
Here:
$2,327
State:
$2,391
(% of AGI for various income ranges: 104.1% for AGIs below $25k, 79.1% for AGIs $25k-50k)
Percentage of individuals using paid preparers for their 2020 taxes: 94.2%
Here:
94%
State:
93%
(% for various income ranges: 92.5% for AGIs below $25k, 95.1% for AGIs $25k-50k, 96.0% for AGIs $50k-75k, 93.1% for AGIs $75k-100k, 94.4% for AGIs $100k-200k, 100.0% for AGIs over 200k)
Averages for the 2012 tax year for zip code 37025, filed in 2013:
Average Adjusted Gross Income (AGI) in 2012: $40,270 (Individual Income Tax Returns)
Here:
$40,270
State:
$53,767
Salary/wage: $38,410 (reported on 84.2% of returns)
Here:
$38,410
State:
$45,421
(% of AGI for various income ranges: 70.4% for AGIs below $25k, 84.3% for AGIs $25k-50k, 85.1% for AGIs $50k-75k, 80.8% for AGIs $75k-100k, 108.3% for AGIs $100k-200k)
Taxable interest for individuals: $725 (reported on 21.5% of returns)
This zip code:
$725
Tennessee:
$1,732
(% of AGI for various income ranges: 1.0% for AGIs below $25k, 0.5% for AGIs $25k-50k, 0.3% for AGIs $50k-75k, 0.2% for AGIs $75k-100k, 0.2% for AGIs $100k-200k)
Ordinary dividends: $1,495 (reported on 8.1% of returns)
Here:
$1,495
State:
$6,739
(% of AGI for various income ranges: 0.4% for AGIs below $25k, 0.3% for AGIs $25k-50k, 0.5% for AGIs $50k-75k, 0.2% for AGIs $75k-100k, 0.3% for AGIs $100k-200k)
Net capital gain/loss in AGI: +$4,211 (reported on 6.9% of returns)
Here:
+$4,211
State:
+$19,082
(% of AGI for various income ranges: 0.2% for AGIs $25k-50k, 0.4% for AGIs $50k-75k, 3.4% for AGIs $100k-200k)
Profit/loss from business: +$9,643 (reported on 18.1% of returns)
Here:
+$9,643
State:
+$15,240
(% of AGI for various income ranges: 13.6% for AGIs below $25k, 3.9% for AGIs $25k-50k, 2.8% for AGIs $50k-75k, 4.6% for AGIs $75k-100k, 1.1% for AGIs $100k-200k)
Taxable individual retirement arrangement distribution: $14,871 (reported on 5.4% of returns)
37025:
$14,871
Tennessee:
$15,505
(% of AGI for various income ranges: 3.4% for AGIs below $25k, 1.5% for AGIs $25k-50k, 2.6% for AGIs $50k-75k, 3.5% for AGIs $100k-200k)
Total itemized deductions: $17,900 (24% of AGI, reported on 15.8% of returns)
Here:
$17,900
State:
$21,976
Here:
23.8% of AGI
State:
17.8% of AGI
(% of AGI for various income ranges: 5.9% for AGIs below $25k, 6.7% for AGIs $25k-50k, 6.3% for AGIs $50k-75k, 8.4% for AGIs $75k-100k, 10.9% for AGIs $100k-200k)
Charity contributions: $4,348 (reported on 8.8% of returns)
Here:
$4,348
State:
$6,709
(% of AGI for various income ranges: 0.2% for AGIs below $25k, 0.5% for AGIs $25k-50k, 0.6% for AGIs $50k-75k, 1.5% for AGIs $75k-100k, 2.5% for AGIs $100k-200k)
Taxes paid: $3,182 (reported on 15.4% of returns)
37025:
$3,182
State:
$4,829
(% of AGI for various income ranges: 0.7% for AGIs below $25k, 1.0% for AGIs $25k-50k, 1.1% for AGIs $50k-75k, 1.6% for AGIs $75k-100k, 2.2% for AGIs $100k-200k)
Earned income credit: $2,407 (reported on 26.2% of returns)
Here:
$2,407
State:
$2,404
(% of AGI for various income ranges: 9.0% for AGIs below $25k, 1.4% for AGIs $25k-50k)
Percentage of individuals using paid preparers for their 2012 taxes: 51.5%
Here:
52%
State:
52%
(% for various income ranges: 49.1% for AGIs below $25k, 52.7% for AGIs $25k-50k, 54.1% for AGIs $50k-75k, 47.4% for AGIs $75k-100k, 71.4% for AGIs $100k-200k)
Averages for the 2004 tax year for zip code 37025, filed in 2005:
Average Adjusted Gross Income (AGI) in 2004: $35,386 (Individual Income Tax Returns)
Here:
$35,386
State:
$44,088
Salary/wage: $33,952 (reported on 86.5% of returns)
Here:
$33,952
State:
$38,825
(% of AGI for various income ranges: 92.3% for AGIs below $10k, 78.1% for AGIs $10k-25k, 86.8% for AGIs $25k-50k, 87.0% for AGIs $50k-75k, 92.2% for AGIs $75k-100k, 64.3% for AGIs over 100k)
Taxable interest for individuals: $797 (reported on 29.6% of returns)
This zip code:
$797
Tennessee:
$1,802
(% of AGI for various income ranges: 3.3% for AGIs below $10k, 1.3% for AGIs $10k-25k, 0.5% for AGIs $25k-50k, 0.5% for AGIs $50k-75k, 0.4% for AGIs $75k-100k, 0.5% for AGIs over 100k)
Taxable dividends: $1,004 (reported on 9.9% of returns)
Here:
$1,004
State:
$3,727
(% of AGI for various income ranges: 1.3% for AGIs below $10k, 0.4% for AGIs $10k-25k, 0.5% for AGIs $25k-50k, 0.2% for AGIs $50k-75k, 0.1% for AGIs $75k-100k, 0.1% for AGIs over 100k)
Net capital gain/loss: +$6,121 (reported on 8.8% of returns)
Here:
+$6,121
State:
+$15,776
(% of AGI for various income ranges: -1.4% for AGIs below $10k, 0.2% for AGIs $10k-25k, 0.7% for AGIs $25k-50k, 1.5% for AGIs $50k-75k, 2.1% for AGIs $75k-100k, 3.9% for AGIs over 100k)
Profit/loss from business: +$8,914 (reported on 20.6% of returns)
Here:
+$8,914
State:
+$12,882
(% of AGI for various income ranges: 17.5% for AGIs below $10k, 12.5% for AGIs $10k-25k, 4.8% for AGIs $25k-50k, 3.2% for AGIs $50k-75k, 0.2% for AGIs $75k-100k, 5.4% for AGIs over 100k)
IRA payment deduction: $3,400 (reported on 1.3% of returns)
37025:
$3,400
Tennessee:
$2,934
Total itemized deductions: $14,891 (24% of AGI, reported on 17.9% of returns)
Here:
$14,891
State:
$18,035
Here:
23.8% of AGI
State:
19.9% of AGI
(% of AGI for various income ranges: 4.8% for AGIs $10k-25k, 6.5% for AGIs $25k-50k, 8.7% for AGIs $50k-75k, 10.4% for AGIs $75k-100k, 8.4% for AGIs over 100k)
Charity contributions deductions: $3,368 (5% of AGI, reported on 13.5% of returns)
Here:
$3,368
State:
$5,167
Here:
5.1% of AGI
State:
5.3% of AGI
(% of AGI for various income ranges: 0.3% for AGIs $10k-25k, 0.7% for AGIs $25k-50k, 1.2% for AGIs $50k-75k, 1.9% for AGIs $75k-100k, 2.9% for AGIs over 100k)
Total tax: $4,257 (reported on 74.0% of returns)
37025:
$4,257
State:
$7,482
(% of AGI for various income ranges: 5.2% for AGIs below $10k, 4.7% for AGIs $10k-25k, 6.5% for AGIs $25k-50k, 8.2% for AGIs $50k-75k, 10.4% for AGIs $75k-100k, 17.3% for AGIs over 100k)
Earned income credit: $1,994 (reported on 20.9% of returns)
Here:
$1,994
State:
$1,826
Percentage of individuals using paid preparers for their 2004 taxes: 58.4%
Here:
58%
State:
60%
(% for various income ranges: 51.0% for AGIs below $10k, 61.3% for AGIs $10k-25k, 61.2% for AGIs $25k-50k, 58.8% for AGIs $50k-75k, 50.3% for AGIs $75k-100k, 64.2% for AGIs over 100k)
Household received Food Stamps/SNAP in the past 12 months: 172 Household did not receive Food Stamps/SNAP in the past 12 months: 2,110
Women who had a birth in the past 12 months: 68 (60 now married, 8 unmarried) Women who did not have a birth in the past 12 months: 1,649 (834 now married, 814 unmarried)
Housing units in zip code 37025 with a mortgage: 1,254 (68 second mortgage, 49 both second mortgage and home equity loan) Median monthly owner costs for units with a mortgage: $1,305 Median monthly owner costs for units without a mortgage: $340
Residents with income below the poverty level in 2022:
This zip code:
10.0%
Whole state:
13.3%
Residents with income below 50% of the poverty level in 2022:
This zip code:
5.8%
Whole state:
7.1%
Median number of rooms in houses and condos:
Here:
6.3
State:
6.5
Median number of rooms in apartments:
Here:
6.0
State:
4.4
Notable locations in this zip code not listed on our city pages
Churches in zip code 37025 include: Five Point Church (A), Spring Creek Church (B), Parham Chapel (C), Bon Aqua Church (D), New Hope Church (E), Missionary Ridge Church (F). Display/hide their locations on the map
Cemeteries: Tidwell Cemetery (1), Tomlinson Cemetery (2), Jenkins Cemetery (3), Vaughn Cemetery (4), Jordan Cemetery (5), White Cemetery (6), Lampley Cemetery (7). Display/hide their locations on the map
In group quarters: 2 (-1 institutionalized population)
Size of family households: 700 2-persons, 565 3-persons, 252 4-persons, 142 5-persons, 15 6-persons, 26 7-or-more-persons
Size of nonfamily households: 368 1-person, 205 2-persons, 12 3-persons
802 married couples with children.
396 single-parent households (165 men, 231 women).
97.7% of residents of 37025 zip code speak English at home.
0.4% of residents speak Spanish at home (100% well).
0.3% of residents speak other Indo-European language at home (100% very well).
1.2% of residents speak Asian or Pacific Island language at home (100% very well).
Foreign born population: 9 (0.2%) (0.0% of them are naturalized citizens)
:
0.2%
Whole state:
5.6%
122%United Kingdom, excluding England and Scotland
100%Sweden
24%American
20%English
9%Scotch-Irish
8%Irish
7%German
3%European
2%French
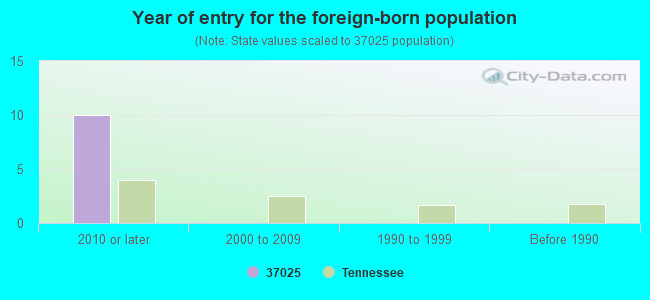
Year of entry for the foreign-born population
102010 or later
02000 to 2009
01990 to 1999
0Before 1990
Facilities with environmental interests located in this zip code:
ANDERSON LESLIE H (RURAL RT 1 BOX 413 in BON AQUA, TN)
(Resource Conservation and Recovery Act (tracking hazardous waste))
Housing units lacking complete plumbing facilities: 1.4% Housing units lacking complete kitchen facilities: 2.3%
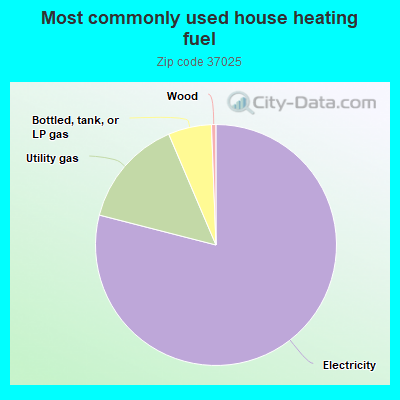
79.0%Electricity
14.6%Utility gas
5.8%Bottled, tank, or LP gas
0.6%Wood
Population in 1990: 3,984. Population change in the 1990s: +1,166 (+29.3%).
Place of birth for U.S.-born residents:
This state: 4,482
Northeast: 213
Midwest: 503
South: 763
West: 280
54% of the 37025 zip code residents lived in the same house 5 years ago. Out of people who lived in different houses, 36% lived in this county. Out of people who lived in different counties, 50% lived in Tennessee.
97% of the 37025 zip code residents lived in the same house 1 year ago. Out of people who lived in different houses, 32% moved from this county. Out of people who lived in different houses, 84% moved from different county within same state. Out of people who lived in different houses, 1% moved from different state.
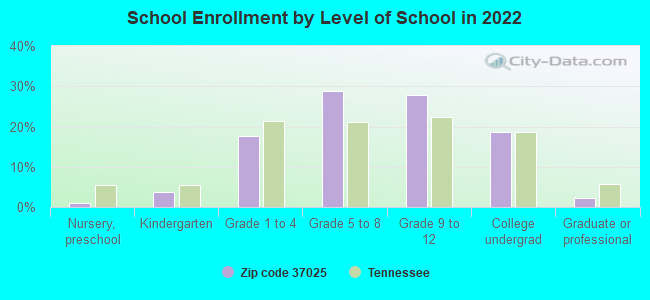
Private vs. public school enrollment:
Students in private schools in grades 1 to 8 (elementary and middle school): 120
Here:
17.9%
Tennessee:
15.0%
Students in private schools in grades 9 to 12 (high school): 18
Here:
4.8%
Tennessee:
16.2%
Students in private undergraduate colleges: 24
Here:
9.1%
Tennessee:
23.5%
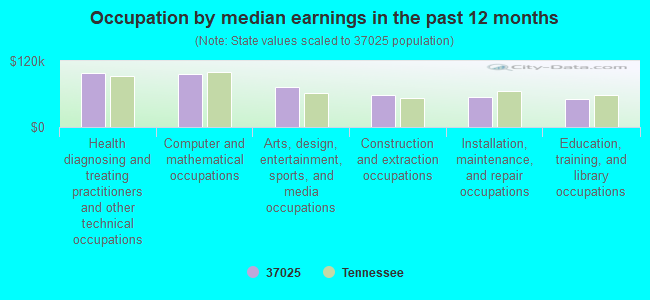
Occupation by median earnings in the past 12 months ($)
98,785Health diagnosing and treating practitioners and other technical occupations
95,524Computer and mathematical occupations
73,080Arts, design, entertainment, sports, and media occupations
57,611Construction and extraction occupations
54,624Installation, maintenance, and repair occupations
50,631Education, training, and library occupations
Companies with federal contracts located in this zip code:
ECI DEFENSE GROUP (6169 HIGHWAY 100 in BON AQUA, TN; small business) : $2,183,472 in 113 contractsfrom 2004 to 2006
Contracts for Batteries, Nonrechargeable, Motors, Electrical, Miscellaneous Aircraft Accessories and Components, Gas Turbines and Jet Engines, Non-Aircraft; and Components, and moreby Defense Logistics Agency, U.S. Coast Guard, Air Force, Federal Supply Service, and others Signed by year:2000: $0; 2001: $0; 2002: $0; 2003: $0; 2004: $63,239; 2005: $1,165,696; 2006: $954,537.
Biggest contracts:
$99,952 with Defense Logistics Agency for Batteries, Nonrechargeable. Signed on 2006-04-06. Completion date: 2006-07-01.
$95,549 with Defense Logistics Agency for Motors, Electrical. Signed on 2005-03-25. Completion date: 2005-12-04.
$95,549, same as above.Signed on 2005-03-28. Completion date: 2005-12-07.
$89,664 with Defense Logistics Agency for Miscellaneous Aircraft Accessories and Components. Signed on 2006-05-08. Completion date: 2006-10-25.
OVERHEAD CRANE, CONVEYOR & SER (1336 WHITE RD in BON AQUA, TN; small business)
$14,896 with Army for Winches, Hoists, Cranes, and Derricks. Signed on 2004-09-30. Completion date: 2004-09-07.
Top industries in this zip code by the number of employees in 2005:
Health Care and Social Assistance: Home Health Care Services (20-49 employees: 1 establishment)
Construction: Site Preparation Contractors (20-49: 1)
Construction: Masonry Contractors (10-19: 1)
Construction: Painting and Wall Covering Contractors (10-19: 1)
Mining: Crushed and Broken Limestone Mining and Quarrying (10-19: 1)
Health Care and Social Assistance: Child Day Care Services (10-19: 1)
Administrative and Support and Waste Management and Remediation Services: Landscaping Services (5-9: 1, 1-4: 1)
Fatal accident statistics in 2013:
Fatal accident count: 2
Vehicles involved in fatal accidents: 3
Fatal accidents caused by drunken drivers: 0
Fatalities: 2
Persons involved in fatal accidents: 3
Pedestrians involved in fatal accidents: 0
Home Mortgage Disclosure Act Aggregated Statistics For Year 2009 (Based on 2 partial tracts)
A) FHA, FSA/RHS & VA Home Purchase Loans
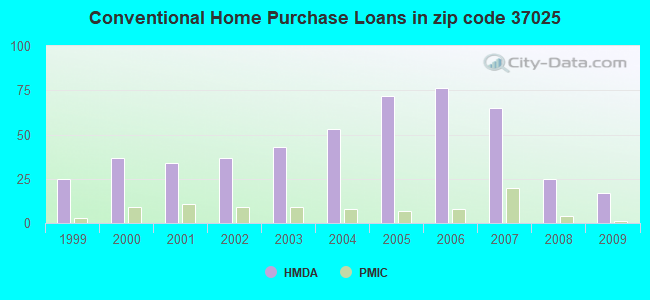
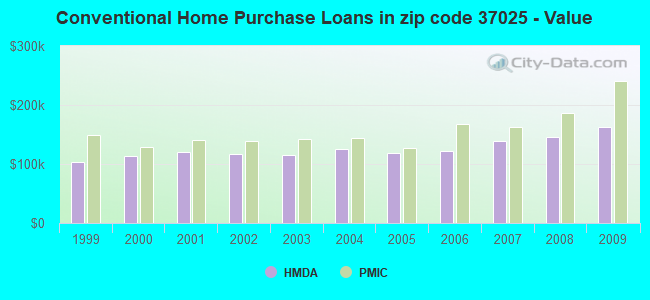
B) Conventional Home Purchase Loans
C) Refinancings
D) Home Improvement Loans
F) Non-occupant Loans on < 5 Family Dwellings (A B C & D)
G) Loans On Manufactured Home Dwelling (A B C & D)
Number
Average Value
Number
Average Value
Number
Average Value
Number
Average Value
Number
Average Value
Number
Average Value
LOANS ORIGINATED
22
$163,744
17
$161,899
79
$158,634
9
$53,390
5
$127,366
1
$153,450
APPLICATIONS APPROVED, NOT ACCEPTED
1
$174,340
1
$95,090
7
$160,391
1
$68,440
0
$0
1
$122,470
APPLICATIONS DENIED
4
$144,530
4
$208,195
26
$145,964
3
$85,727
1
$234,130
2
$73,840
APPLICATIONS WITHDRAWN
2
$133,815
2
$167,135
14
$170,812
1
$100,860
0
$0
1
$72,760
FILES CLOSED FOR INCOMPLETENESS
0
$0
0
$0
4
$124,720
1
$61,590
0
$0
0
$0
Aggregated Statistics For Year 2008 (Based on 2 partial tracts)
A) FHA, FSA/RHS & VA Home Purchase Loans
B) Conventional Home Purchase Loans
C) Refinancings
D) Home Improvement Loans
F) Non-occupant Loans on < 5 Family Dwellings (A B C & D)
G) Loans On Manufactured Home Dwelling (A B C & D)
Number
Average Value
Number
Average Value
Number
Average Value
Number
Average Value
Number
Average Value
Number
Average Value
LOANS ORIGINATED
16
$145,498
25
$146,025
51
$147,675
8
$48,852
10
$111,626
3
$75,283
APPLICATIONS APPROVED, NOT ACCEPTED
0
$0
1
$109,500
6
$145,642
1
$29,540
0
$0
0
$0
APPLICATIONS DENIED
2
$93,650
1
$139,400
33
$141,056
8
$72,490
1
$131,110
3
$87,770
APPLICATIONS WITHDRAWN
3
$94,373
5
$124,774
13
$163,863
0
$0
1
$152,000
1
$108,060
FILES CLOSED FOR INCOMPLETENESS
0
$0
0
$0
3
$133,993
1
$62,310
0
$0
0
$0
Aggregated Statistics For Year 2007 (Based on 2 partial tracts)
A) FHA, FSA/RHS & VA Home Purchase Loans
B) Conventional Home Purchase Loans
C) Refinancings
D) Home Improvement Loans
F) Non-occupant Loans on < 5 Family Dwellings (A B C & D)
G) Loans On Manufactured Home Dwelling (A B C & D)
Number
Average Value
Number
Average Value
Number
Average Value
Number
Average Value
Number
Average Value
Number
Average Value
LOANS ORIGINATED
12
$141,198
65
$138,333
53
$132,948
10
$59,145
10
$112,274
6
$68,618
APPLICATIONS APPROVED, NOT ACCEPTED
0
$0
10
$116,993
8
$162,360
2
$64,475
3
$66,277
1
$132,550
APPLICATIONS DENIED
1
$149,480
12
$122,588
40
$155,102
8
$62,810
2
$109,140
3
$53,430
APPLICATIONS WITHDRAWN
1
$215,400
7
$126,996
13
$143,388
3
$93,893
1
$159,570
1
$81,410
FILES CLOSED FOR INCOMPLETENESS
0
$0
1
$118,150
4
$148,852
0
$0
0
$0
0
$0
Aggregated Statistics For Year 2006 (Based on 2 partial tracts)
A) FHA, FSA/RHS & VA Home Purchase Loans
B) Conventional Home Purchase Loans
C) Refinancings
D) Home Improvement Loans
F) Non-occupant Loans on < 5 Family Dwellings (A B C & D)
G) Loans On Manufactured Home Dwelling (A B C & D)
Number
Average Value
Number
Average Value
Number
Average Value
Number
Average Value
Number
Average Value
Number
Average Value
LOANS ORIGINATED
13
$168,574
76
$122,406
54
$145,061
9
$44,864
8
$99,370
6
$65,197
APPLICATIONS APPROVED, NOT ACCEPTED
0
$0
9
$96,053
12
$145,611
3
$44,063
0
$0
2
$66,275
APPLICATIONS DENIED
1
$220,080
17
$79,901
36
$130,082
10
$33,715
3
$87,410
4
$78,432
APPLICATIONS WITHDRAWN
1
$79,960
7
$148,454
24
$137,777
1
$174,340
1
$171,460
1
$77,080
FILES CLOSED FOR INCOMPLETENESS
0
$0
3
$63,397
6
$173,017
0
$0
0
$0
0
$0
Aggregated Statistics For Year 2005 (Based on 2 partial tracts)
A) FHA, FSA/RHS & VA Home Purchase Loans
B) Conventional Home Purchase Loans
C) Refinancings
D) Home Improvement Loans
F) Non-occupant Loans on < 5 Family Dwellings (A B C & D)
G) Loans On Manufactured Home Dwelling (A B C & D)
Number
Average Value
Number
Average Value
Number
Average Value
Number
Average Value
Number
Average Value
Number
Average Value
LOANS ORIGINATED
13
$140,533
72
$118,531
63
$119,586
8
$29,041
7
$82,486
3
$95,333
APPLICATIONS APPROVED, NOT ACCEPTED
1
$48,270
6
$93,832
13
$118,478
1
$21,970
0
$0
1
$58,710
APPLICATIONS DENIED
3
$97,133
14
$90,256
52
$110,872
6
$42,803
1
$111,660
8
$63,260
APPLICATIONS WITHDRAWN
1
$120,670
10
$124,881
41
$135,207
2
$106,080
1
$104,100
1
$104,460
FILES CLOSED FOR INCOMPLETENESS
0
$0
2
$61,955
6
$130,993
0
$0
0
$0
0
$0
Aggregated Statistics For Year 2004 (Based on 2 partial tracts)
A) FHA, FSA/RHS & VA Home Purchase Loans
B) Conventional Home Purchase Loans
C) Refinancings
D) Home Improvement Loans
F) Non-occupant Loans on < 5 Family Dwellings (A B C & D)
G) Loans On Manufactured Home Dwelling (A B C & D)
Number
Average Value
Number
Average Value
Number
Average Value
Number
Average Value
Number
Average Value
Number
Average Value
LOANS ORIGINATED
13
$126,430
53
$124,915
65
$108,520
12
$40,222
7
$78,163
6
$78,763
APPLICATIONS APPROVED, NOT ACCEPTED
0
$0
4
$78,885
19
$118,544
1
$17,650
1
$67,360
1
$88,610
APPLICATIONS DENIED
1
$181,540
11
$92,473
44
$108,682
6
$31,578
1
$43,220
6
$69,818
APPLICATIONS WITHDRAWN
1
$180,820
7
$110,376
34
$117,552
0
$0
1
$137,960
1
$50,430
FILES CLOSED FOR INCOMPLETENESS
0
$0
1
$178,300
4
$102,388
0
$0
0
$0
0
$0
Aggregated Statistics For Year 2003 (Based on 2 partial tracts)
A) FHA, FSA/RHS & VA Home Purchase Loans
B) Conventional Home Purchase Loans
C) Refinancings
D) Home Improvement Loans
F) Non-occupant Loans on < 5 Family Dwellings (A B C & D)
Number
Average Value
Number
Average Value
Number
Average Value
Number
Average Value
Number
Average Value
LOANS ORIGINATED
17
$123,782
43
$114,460
145
$117,164
11
$52,360
8
$69,159
APPLICATIONS APPROVED, NOT ACCEPTED
0
$0
5
$88,394
16
$92,324
3
$35,180
0
$0
APPLICATIONS DENIED
1
$116,340
10
$103,846
47
$103,860
5
$22,692
0
$0
APPLICATIONS WITHDRAWN
0
$0
3
$98,093
29
$125,238
1
$10,090
1
$107,340
FILES CLOSED FOR INCOMPLETENESS
0
$0
2
$133,455
6
$107,880
0
$0
0
$0
Aggregated Statistics For Year 2002 (Based on 2 partial tracts)
A) FHA, FSA/RHS & VA Home Purchase Loans
B) Conventional Home Purchase Loans
C) Refinancings
D) Home Improvement Loans
F) Non-occupant Loans on < 5 Family Dwellings (A B C & D)
Number
Average Value
Number
Average Value
Number
Average Value
Number
Average Value
Number
Average Value
LOANS ORIGINATED
21
$120,101
37
$116,919
100
$115,055
6
$31,638
6
$89,570
APPLICATIONS APPROVED, NOT ACCEPTED
0
$0
3
$124,390
13
$79,521
1
$42,860
1
$78,160
APPLICATIONS DENIED
1
$64,480
8
$126,700
38
$109,908
5
$12,896
0
$0
APPLICATIONS WITHDRAWN
1
$122,110
4
$118,955
22
$116,443
0
$0
0
$0
FILES CLOSED FOR INCOMPLETENESS
0
$0
0
$0
7
$109,501
0
$0
1
$106,980
Aggregated Statistics For Year 2001 (Based on 2 partial tracts)
A) FHA, FSA/RHS & VA Home Purchase Loans
B) Conventional Home Purchase Loans
C) Refinancings
D) Home Improvement Loans
F) Non-occupant Loans on < 5 Family Dwellings (A B C & D)
Number
Average Value
Number
Average Value
Number
Average Value
Number
Average Value
Number
Average Value
LOANS ORIGINATED
14
$119,689
34
$119,565
90
$117,077
9
$21,932
6
$61,473
APPLICATIONS APPROVED, NOT ACCEPTED
0
$0
4
$105,178
14
$103,841
1
$10,810
0
$0
APPLICATIONS DENIED
2
$90,410
9
$68,838
29
$94,434
5
$14,624
0
$0
APPLICATIONS WITHDRAWN
2
$118,325
3
$160,290
21
$85,676
1
$1,080
0
$0
FILES CLOSED FOR INCOMPLETENESS
0
$0
2
$62,495
6
$83,447
0
$0
0
$0
Aggregated Statistics For Year 2000 (Based on 2 partial tracts)
A) FHA, FSA/RHS & VA Home Purchase Loans
B) Conventional Home Purchase Loans
C) Refinancings
D) Home Improvement Loans
F) Non-occupant Loans on < 5 Family Dwellings (A B C & D)
Number
Average Value
Number
Average Value
Number
Average Value
Number
Average Value
Number
Average Value
LOANS ORIGINATED
13
$117,481
37
$113,765
30
$86,148
9
$21,332
6
$48,987
APPLICATIONS APPROVED, NOT ACCEPTED
1
$136,160
5
$92,140
12
$69,038
4
$21,702
1
$29,180
APPLICATIONS DENIED
0
$0
12
$67,868
21
$62,280
5
$21,468
0
$0
APPLICATIONS WITHDRAWN
2
$69,700
5
$113,680
19
$65,556
1
$12,250
2
$60,695
FILES CLOSED FOR INCOMPLETENESS
0
$0
1
$75,280
4
$100,045
0
$0
0
$0
Aggregated Statistics For Year 1999 (Based on 1 partial tract)
A) FHA, FSA/RHS & VA Home Purchase Loans
B) Conventional Home Purchase Loans
C) Refinancings
D) Home Improvement Loans
F) Non-occupant Loans on < 5 Family Dwellings (A B C & D)
Detailed PMIC statistics for the following Tracts:0604.00
2004 - 2018 National Fire Incident Reporting System (NFIRS) incidents
According to the data from the years 2004 - 2018 the average number of fires per year is 13. The highest number of reported fires - 29 took place in 2018, and the least - 0 in 2012. The data has a growing trend.
When looking into fire subcategories, the most incidents belonged to: Structure Fires (51.0%), and Outside Fires (30.4%).
Fire incident types reported to NFIRS in Zip Code 37025


 Nearest zip codes: 37098, 37029, 38476, 37062, 37055, 37137.
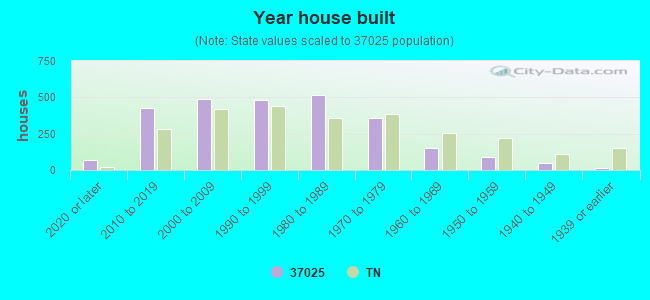


 According to the data from the years 2004 - 2018 the average number of fires per year is 13. The highest number of reported fires - 29 took place in 2018, and the least - 0 in 2012. The data has a growing trend.
 When looking into fire subcategories, the most incidents belonged to: Structure Fires (51.0%), and Outside Fires (30.4%).